3223 Avenue S NW · Inwood, FL
Flood risk 1/10 · Minimal
- FEMA flood zone
- X (unshaded)
- Chance of flooding over 30 yrs
- 0.0%
- Est. flood insurance / yr
- $507 – $1,088
Fire risk 1/10 · Minimal
- Est. fire insurance / yr
- $947 – $1,759
Heat risk 8/10 · Major
- Hot days now (above 107°F)
- 7 days/yr
- Hot days in 30 yrs
- 23 days/yr
Wind risk 9/10 · Severe
- Chance of severe wind over 30 yrs
- 99.0%
Air-quality risk 2/10 · Minimal
- Unhealthy air days now
- 2 days/yr
- Unhealthy air days in 30 yrs
- 2 days/yr
Risk factors via First Street. Map © Google.
Why this score? — see what drove the B- grade
The composite is a weighted blend of 9 inputs, each scored 0–100. Each bar is that input's sub-score; the figure is the points it added to the 100-point composite (weight × sub-score).
- Cash flow +30.0/30.0
- 1% rule +10.0/10.0
- DSCR +10.0/10.0
- ARV discount +7.5/15.0
- Schools +3.5/10.0
- Livability +3.3/5.0
- Rent growth +3.0/5.0
- Condition / age +2.5/5.0
- Appreciation +0.0/10.0
$110,000
🖨 Deal sheet 📄 Offer letter ✓ Due diligence
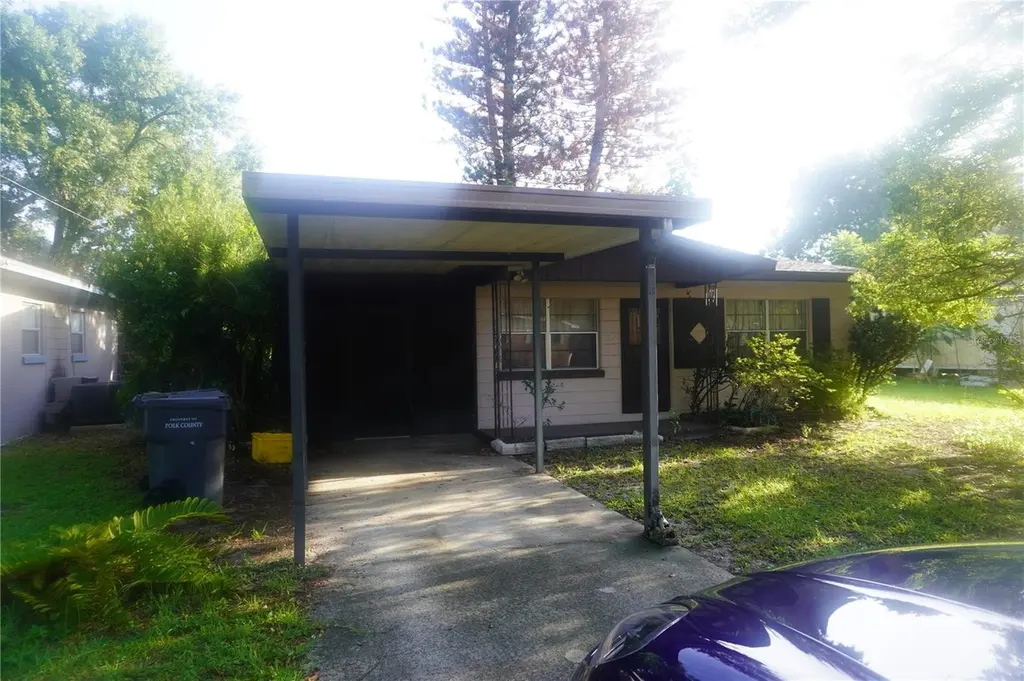
Listing remarks
Under contract-accepting backup offers. Opportunity is knocking in the heart of Winter Haven! Nestled on a generously sized lot shaded by mature trees, this charming fixer-upper is ready for its next chapter. Whether you're an investor searching for your next project, a first-time buyer looking to build sweat equity, or someone who appreciates the character of an older home, this property offers incredible potential at an affordable price point. As you arrive, you'll be welcomed by a covered carport, a spacious screened front porch, and a beautifully crafted front door that hints at the home's timeless character. Inside, you'll find a functional floor plan with a comfortable living area, an
Key facts
- Generously sized lot
- Covered carport
- Large backyard
Tags
Property features AI
Finance
- Other: Property type: Residential - Single Family Residence; Zoning: R-1; Public maintained paved road access
- HOA & community: No association; Pets allowed
Exterior
- Parking: Driveway; 1-car carport
- Utilities: Public water; Septic tank; Electricity connected; Water connected
- Home design: Single family residence; One story; Faces south; Homestead exempt
- Construction: Block construction; Shingle roof; Slab foundation; Built on an oversized, paved lot
- Exterior features: Front porch; Rear porch; Storage shed(s); Chain link fencing; Mature landscaping with trees
Interior
- Kitchen: Range; Refrigerator; Electric water heater
- Bedrooms: 2 bedrooms
- Flooring: Laminate
- Bathrooms: 1 full bathroom
- Heating & cooling: Space heater; Wall/window air conditioning unit(s)
- Interior features: Ceiling fans; Kitchen and family room combined; Drapes
- Laundry & utility: Washer hookup; Dryer hookup (gas); Outdoor laundry access
Neighborhood map
What this means for you Summary
Snapshot
- This is a 3-bed/1.0-bath single-family listed at $110k.
Deal economics
- At list price, monthly cash flow is $721 ($9k/yr) — positive.
- The deal already cash-flows at list — no discount required.
- Meets the 1% rule at list price ($2k rent vs $110k).
Location & tenants
- Location reads 66/100 on livability (#594 in FL) — a middle-class / working-renter tenant base. Strengths: cost of living A+, housing A+, health & safety A; Watch: amenities F, commute F, employment F.
- Polk (suburban): math 39% / reading 43% proficiency, ranked #62 of 73 in FL (top 85%) — families likely to look elsewhere, expect single-tenant / working-renter base with shorter leases.
- Zoned schools: Inwood Elementary School (math 27% / reading 27%, grade F, #1,969 of 2,144 statewide, top 94%, 298 students, 70% FRL).
- Zoned-school proficiency averages 27% at this address vs 41% district-wide (-14 pts) — the specific schools serving this property underperform the Polk average; the district grade overstates school quality for this exact location.
- Market conditions: Rents rising (+2.1%/yr); 491 active listings in the ZIP; 5 comparable units currently listed for rent nearby; rentals leasing fast (median 3d on market — plan ~1-2 weeks tenant-placement turnaround); 10,384 units permitted in Polk County in 2024 (1,716 in 5+ unit buildings).
- This rent runs 38% of the median local income ($57k/yr) — at the standard rent-burdened threshold; future hikes will face affordability resistance.
Forward outlook
- Local home prices are declining (-3.0%/yr); year-one equity from $761 of loan paydown is wiped out by about $3k of value loss. Plan a longer hold.
- Polk County population projected at +33% by 2050 — long-run rental-demand tailwind backs the buy-and-hold thesis.
- At projected returns (-3.0% appreciation + 2.1% rent growth), your $31k cash investment doubles in ~5 years — after that, you're playing with house money.
Negotiation context
- Only 1 days on market — expect competitive offers; lowballing is unlikely to land.
Risks & watch-outs
- Watch-outs: built in 1956 — expect roof / HVAC / electrical / plumbing capex.
- Climate carrying-cost: severe wind risk, 99% chance of damaging wind over 30y; extreme-heat days projected 7→23/yr by 2055 (HVAC capex compounding) — expect insurance premiums to compound above CPI over the hold.
Questions for the listing agent
- Built in 1956 — when were the roof, HVAC, electrical panel, plumbing, and water heater last replaced?
- Is there a deadline driving the sale (1031 exchange, divorce, estate, relocation)? That informs how much negotiation room exists.
- Schools are D-rated, which usually means shorter tenancies and higher turnover. Who's the typical renter profile here, and what's been the actual vacancy rate?
- What's the average days-on-market for RENTAL listings here right now (not sales)? A rising rental-DOM trend means longer vacancies and softer asking-rent achievability than the comps imply.
- What's the recent tenant-quality profile in this submarket — average credit score on applications, eviction rate, late-payment / NSF rate, and stable-employment percentage? A property-management company in the area should have these aggregated.
- How much new for-sale + rental construction is in the pipeline within 1–3 miles? Heavy new supply typically softens prices + rents 12–24 months out; constrained supply supports both.
Investment metrics
- 1% rule
- 1.62% ✓
- Cap rate
- 14.16%
- Cash-on-cash
- 28.10%
- DSCR
- 2.25
- GRM
- 5.1
CMA / ARV
No comps found within radius.
Projected returns pro-forma
-3.0% appreciation · 2.1% rent growth · sell at horizon
- IRR
- 21.3%
- Equity multiple
- 1.86×
- Total profit
- $26,497
- Equity at exit
- $16,401
- IRR
- 28.8%
- Equity multiple
- 3.46×
- Total profit
- $75,705
- Equity at exit
- $9,511
Cash invested: $30,800 (down + closing). Projections, not guarantees.
Landlord ↔ Tenant lean methodology
- Overall (STATE)
- 87 Strongly Landlord-Friendly
- State Florida
- 87 Strongly Landlord-Friendly · R+3
- County
- — inherits STATE
- City
- — inherits STATE
ZIP-level market 33881
- Home prices YoY
- -24.3%
- Rents YoY
- 2.1%
- Active inventory
- 491
- Price-to-rent
- 5.1×
Monthly cashflow live
- Estimated rent
- $1,784 high interval (Pro) →
- Mortgage (P&I)
- −$577
- Tax from tax record
- −$65 /mo · $783/yr
- Insurance
- −$46
- HOA
- −$0
- Vacancy / Maint / Mgmt
- −$375
- Net cashflow
- $721
Break-even live
UW: 25.0% down · 7.5% · 30yr · 1.5% tax · 5.0% vac · 8.0% maint · 8.0% mgmt
Financing live
Cash to close
- Down payment
- $27,500
- Closing costs
- $3,300
- Reserves months
- —
- Total cash needed
- —
Loan-product check · same deal, 3 products live
Conventional
25% down · 7.5% · 30yr
- Down + closing
- —
- Monthly P&I
- —
- Monthly cashflow
- —
- DSCR
- —
- Eligible?
- —
Personal DTI + credit; lowest rate.
DSCR
20% down · 8.5% · 30yr
- Down + closing
- —
- Monthly P&I
- —
- Monthly cashflow
- —
- DSCR
- —
- Eligible?
- —
No personal income docs; deal must DSCR.
Hard money
10% down · 12.0% · 12mo
- Down + closing
- —
- Monthly P&I
- —
- Monthly cashflow
- —
- DSCR
- —
- Eligible?
- —
Short-term bridge; refi at stabilization.
Rent comps 5 comps
| Address | Beds | Baths | Sqft | Rent | $/sqft | DOM | Units | Dist |
|---|---|---|---|---|---|---|---|---|
| 5004 Dream Dr Winter Haven, FL | 1.0–2.0 | 1.0–2.0 | 859 | $1,899 | $2.21 | 14d | 76 | 1.02mi |
| 5004 Dream Dr Winter Haven, FL | 1.0–2.0 | 1.0–2.0 | 859 | $1,899 | $2.21 | 2d | 71 | 1.02mi |
| 507 Twin Pines Ln Unit C Auburndale, FL | 2.0 | 1.0 | 640 | $1,000 | $1.56 | 14d | 1 | 1.15mi |
| 350 24th St NW Winter Haven, FL | 2.0 | 1.0–2.0 | 660 | $1,549 | $2.35 | 3d | 13 | 1.25mi |
| 2000 15th Ct NW Winter Haven, FL | 2.0 | 1.0 | 750 | $1,395 | $1.86 | 2d | 1 | 1.37mi |
Listing history 2 events
-
2026-06-18remarks 699-char remark
-
2026-06-18$110,000 Pending 1 DOM
ⓘ Source: listings_history table (triggers on properties + properties_extension) + one-shot
backfill from property_details.listing_events for pre-trigger history.
Tax reassessment forecast FL · Resets to sale price
- Current annual tax
- $783 · $65/mo
- Projected year-2 tax
- $913 · $76/mo
- Expected delta
- +$130/yr (+$11/mo · 16.6%)
ⓘ Screening estimate from a state-policy table — verify with the county assessor before closing.
Climate risk First Street
- Flood 1/10 Low FEMA zone X (unshaded) · 0% chance over 30 yrs
- Wildfire 1/10 Low
- Heat 8/10 Severe 7 d/yr ≥107°F today · 23 d/yr by 30 yrs out
- Wind 9/10 Extreme 99% chance of damaging wind over 30 yrs
- Air quality 2/10 Low 2 unhealthy d/yr today · 2 by 30 yrs out
Nearby sold comps map
Loading sold comps map…
Walkable amenities ~0.75 mi
Loading nearby amenities…
Taxation est. · year 1
- Rental income
- $21,406
- − Mortgage interest
- −$6,162
- − Property taxes
- −$783
- − Insurance
- −$550
- − Repairs & maintenance
- −$1,713
- − Management
- −$1,713
- − Depreciation
- −$3,200
- Taxable income
- $7,286
- Est. tax owed @ 24.0%
- −$1,749
- After-tax cash flow
- $6,907/yr
For passive investors: Depreciation is non-cash, so a rental often shows a tax loss while cash-flowing — sheltering income. Rental losses are passive: they offset passive income freely, and up to $25,000/yr can offset ordinary (W-2) income if you actively participate and your MAGI is under $100k (phasing out to $0 by $150k); unused losses carry forward. On sale, claimed depreciation is recaptured at up to 25%, and gains may owe capital-gains tax (a 1031 exchange can defer both). Figures are a year-1 estimate at your 24.0% rate — not tax advice; consult a CPA.
Schools (NCES district)
- District
- Polk
- NCES district ID
- 1201590
- Math proficiency
- 39% ▼ -11.00%
- Reading proficiency
- 43% ▼ -4.00%
- Median HH income
- $43,979
- Composite
- 34.74/100
- National rank
- #5132
- State rank
- #62 of 73 in FL
Livability — Inwood
- Score
- 66/100
- State rank
- #594
- US rank
- #11391
Category grades
Schools grade is shown separately in the Schools card above.
Census & demographics
- Census place
- Inwood, FL
- County
- Polk County · 740,051 people
- Metro
- Lakeland-Winter Haven, FL
- Population (ZIP)
- 40,808
- Household income
- $57,024
- Rent vs Own
- Severe rent burden
- 1270.0
Population outlook (Polk County) Hauer SSP2
- Today (2025)
- 752,975 people
- By 2030
- 804,621 · +6.9%
- By 2040
- 906,117 · +20.3%
- By 2050
- 1,000,476 · +32.9%
- By 2075
- 1,197,520 · +59.0%
- By 2100
- 1,271,518 · +68.9%
Race, ethnicity, and origin ACS 2023
- Neighborhood character
- Diverse neighborhood (Simpson 0.68)
- Race & ethnicity
- White 44% Black 27% Hispanic / Latino 25% Two or more races 15%
- Hispanic origin (detail)
- Mexican 4% Puerto Rican 12% Cuban 1%
- Common ancestry
- Hispanic 5% Slovak 1% Italian 1%
- Foreign-born
- 15% · Canada, Jamaica
- Languages at home
- 73% English-only · Spanish 20% French/Haitian/Cajun 6%
Political lean MEDSL · Polk
- 2024 margin
- Strong R (+20.7) · D 39.2% · R 59.9%
- 2008→2024 swing
- -14.6pp toward R · 2008: -6.1pp · 2024: -20.7pp
- All cycles
- 2024: R+20.7 2020: R+14.4 2016: R+14.1 2012: R+6.8 2008: R+6.1
Not yet ingested
- Civics
- —
Market trends
- HPI YoY
- ▼ -88.95%
- Current HPI
- 277.0597
- Rent YoY
- ▲ 2.10%
- Metro
- Lakeland-Winter Haven, FL
- State GDP YoY
- ▲ 3.28%
- F500 in state
- 36
Industry mix (Fortune 500 HQ in FL)
| Industry | F500 HQs | Revenue |
|---|---|---|
| Industrial Technology | 2 | $29B |
|
||
| Insurance | 2 | $17B |
|
||
| Retail | 1 | $60B |
|
||
| Technology Distribution | 1 | $58B |
|
||
| Homebuilding | 1 | $35B |
|
||
| Technology Manufacturing | 1 | $35B |
|
||
Price history
2 events — show timeline
- 2026-06-18 Pending — Stellar MLS as Distributed by MLS Grid
- 2026-06-18 Listed $110,000 Stellar MLS as Distributed by MLS Grid
Property tax history
+7.7%/yrLatest (2025): $783 · +26.7% YoY. Source: county tax records.
Cash-flow waterfall
monthlySold comps — $/sqft
last 12 mo · ≤1 miLoading sold comps…