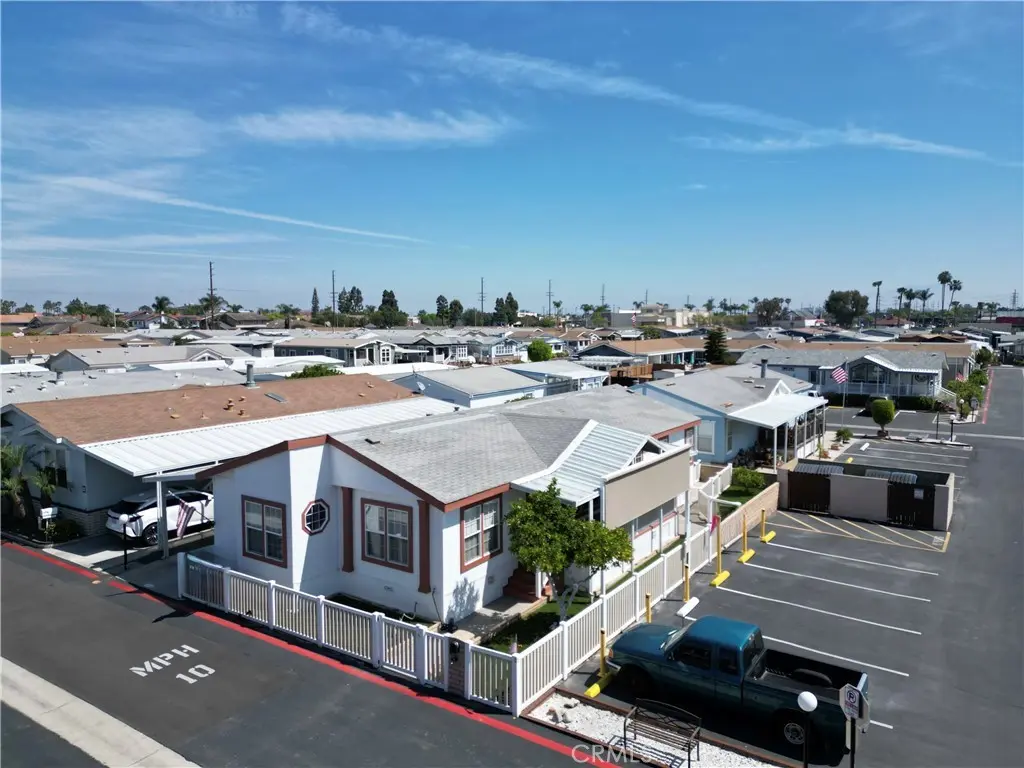
9850 Garfield Ave #8 · Huntington Beach, CA
Flood risk 5/10 · Moderate
- FEMA flood zone
- X
- Chance of flooding over 30 yrs
- 0.27%
- Est. flood insurance / yr
- $507 – $1,088
Fire risk 1/10 · Minimal
- Est. fire insurance / yr
- $659 – $1,223
Heat risk 5/10 · Moderate
- Hot days now (above 85°F)
- 7 days/yr
- Hot days in 30 yrs
- 23 days/yr
Wind risk 1/10 · Minimal
- Chance of severe wind over 30 yrs
- —
Air-quality risk 4/10 · Minor
- Unhealthy air days now
- 5 days/yr
- Unhealthy air days in 30 yrs
- 7 days/yr
Risk factors via First Street. Map © Google.
Why this score? — see what drove the B- grade
The composite is a weighted blend of 9 inputs, each scored 0–100. Each bar is that input's sub-score; the figure is the points it added to the 100-point composite (weight × sub-score).
- Cash flow +30.0/30.0
- 1% rule +10.0/10.0
- DSCR +10.0/10.0
- Schools +6.5/10.0
- Livability +3.4/5.0
- Rent growth +2.8/5.0
- Condition / age +2.5/5.0
- ARV discount +0.0/15.0
- Appreciation +0.0/10.0
$274,500
🖨 Deal sheet (PDF) 📄 Offer letter ✓ Due diligence
Listing remarks MLS
Senior Park 55-40+ Space Rent $2050.00 1997 Skyline 1525 sq ft 3 Large Beds/2 Bath Corner Next to Guest Parking Vaulted Ceilings & All Drywall Corian Kitchen w/ Island Laundry/Utility Room Sitting Porch Composite Well Maintained. .. Pride of Ownership Faces West, whole side is South Dual Paned Windows Serial #45710132Ka/B
Key facts
- New furnace
- New toilets
- New ceiling fans
Tags
Property features AI
Finance
- Other: Park name: Brookfield Manor; Directions: Enter the community and go straight, make the second right turn and the home will be on the right
- Financial info: Rent includes pool
- HOA & community: Association amenities include pool, spa, clubhouse, gym/exercise room, billiard room, barbecue area, and pet rules; Street lighting in community; Manager approval required for move-in; Pets allowed with breed restrictions; Land lease of $2,150 monthly (park provided)
Exterior
- Parking: Attached carport with 3 parking spaces
- Utilities: Public sewer; District/public water
- Home design: Mobile/manufactured home (26' x 60'); Double-wide body type; Single story; Mobile home remains on parcel; Located in a senior community; Community-facing: Brookfield Manor
- Construction: Composition roof; Year built source: builder
- Exterior features: Composition roof; Vinyl fencing; Shed; In-ground pool (association); Corner lot; Close to clubhouse; Yard
Interior
- Flooring: Vinyl flooring
- Bathrooms: 2 full bathrooms
- Heating & cooling: Central heating (furnace); Central cooling
- Interior features: One-level home; Entry on main level; Association spa and in-ground spa
- Laundry & utility: Inside laundry
Neighborhood map
What this means for you Summary
Snapshot
- This is a 3-bed/2.0-bath manufactured listed at $274k.
Deal economics
- At list price, monthly cash flow is $2k ($19k/yr) — positive.
- The deal already cash-flows at list — no discount required.
- Meets the 1% rule at list price ($4k rent vs $274k).
- Recommended offer: $270k (1.5% below list) — sets the bar for market timing.
- Cap rate 13.2% vs local median 1.6% in Huntington Beach — top-decile yield for the area; either an underpriced asset or a hidden risk that comps aren't pricing in. Stress-test before assuming the spread holds.
Location & tenants
- Location reads 67/100 on livability (#306 in CA) — a middle-class / working-renter tenant base. Strengths: employment A+, commute A-; Watch: amenities C-, cost of living F, health & safety F.
- Huntington Beach Union High (suburban): math 65% / reading 82% proficiency, ranked #39 of 517 in CA (top 8%) — strong family-tenant draw, lease renewals of 3-5y typical.
- Zoned schools: Oka (Isojiro) Elementary (518 students, 27% FRL); Talbert (Samuel E.) Middle (712 students, 19% FRL); Huntington Beach High (math 72% / reading 87%, grade A-, #45 of 1,170 statewide, top 4%, 2,807 students, 32% FRL).
- Market conditions: Rents rising (+1.2%/yr); 120 active listings in the ZIP; 28 comparable units currently listed for rent nearby; rentals at typical pace (median 17d on market — plan ~3-4 weeks tenant-placement turnaround); high-income renter base; 6,974 units permitted in Orange County in 2024 (3,839 in 5+ unit buildings).
- This rent runs 40% of the median local income ($131k/yr) — at the standard rent-burdened threshold; future hikes will face affordability resistance.
Forward outlook
- Local home prices are declining (-3.0%/yr); year-one equity from $2k of loan paydown is wiped out by about $8k of value loss. Plan a longer hold.
- Orange County population projected at +14% by 2050 — modest demand growth; plan on rents tracking national, not racing it.
- At projected returns (-3.0% appreciation + 1.2% rent growth), your $77k cash investment doubles in ~6 years — after that, you're playing with house money.
Negotiation context
- It's been on market 16 days — a 2% lower offer ($270k) is reasonable based on typical stale-listing flexibility.
- 4 sale attempts since 2y ago with the ask held roughly flat each time — persistent listings suggest the price (not the market) is what's stuck; bring a comps-based counter.
- Current owner paid $195k; 41% above their basis — modest negotiation headroom, anchor on the comps not their cost.
Risks & watch-outs
- Climate carrying-cost: moderate flood risk; extreme-heat days projected 7→23/yr by 2055 (HVAC capex compounding) — expect insurance premiums to compound above CPI over the hold.
Questions for the listing agent
- Is there a deadline driving the sale (1031 exchange, divorce, estate, relocation)? That informs how much negotiation room exists.
- Schools are B-rated — typically a magnet for longer-tenancy family renters. What's the average tenant stay here, and is there a school-zone premium baked into asking?
- What's the average days-on-market for RENTAL listings here right now (not sales)? A rising rental-DOM trend means longer vacancies and softer asking-rent achievability than the comps imply.
- What's the recent tenant-quality profile in this submarket — average credit score on applications, eviction rate, late-payment / NSF rate, and stable-employment percentage? A property-management company in the area should have these aggregated.
- How much new for-sale + rental construction is in the pipeline within 1–3 miles? Heavy new supply typically softens prices + rents 12–24 months out; constrained supply supports both.
Investment metrics
- 1% rule
- 1.60% ✓
- Cap rate
- 13.16%
- Cash-on-cash
- 24.52%
- DSCR
- 2.09
- GRM
- 5.2
CMA / ARV
- ARV (on-the-fly)
- $200,448
- Comps found
- 12
Show comp detail 12 sales within ~0.75 mi
| Address | Dist | Beds/Ba | Sqft | Sold | Price | $/sf | Match |
|---|---|---|---|---|---|---|---|
| 9850 Garfield #129 | 0.00mi | 3/2.0 | 1,560 (-0%) | 2mo | $285,000 | $183 | 97 |
| 9850 Garfield Ave #74 | 0.00mi | 3/2.0 | 1,750 (+12%) | 1mo | $312,500 | $179 | 80 |
| 19251 Brookhurst St #71 | 0.10mi | 2/2.0 (-1) | 1,608 (+3%) | 10mo | $125,000 | $78 | 78 |
| 19361 Brookhurst St #51 | 0.30mi | 3/2.0 | 1,536 (-2%) | 12mo | $161,000 | $105 | 73 |
| 19361 Brookhurst St #33 | 0.30mi | 3/2.0 | 1,680 (+7%) | 4mo | $277,365 | $165 | 70 |
| 19251 Brookhurst St #95 | 0.08mi | 2/2.0 (-1) | 1,440 (-8%) | 11mo | $103,000 | $72 | 69 |
| 19361 Brookhurst #101 | 0.30mi | 3/2.0 | 1,440 (-8%) | 5mo | $208,000 | $144 | 69 |
| 9850 Garfield Ave #130 | 0.00mi | 3/2.0 | 1,800 (+15%) | 8mo | $335,000 | $186 | 69 |
| 19251 Brookhurst #69 | 0.19mi | 3/2.0 | 1,347 (-14%) | 0mo | $95,000 | $71 | 68 |
| 19251 Brookhurst St #22 | 0.19mi | 3/2.0 | 1,344 (-14%) | 3mo | $172,000 | $128 | 65 |
| 19361 Brookhurst St #120 | 0.30mi | 2/2.0 (-1) | 1,500 (-4%) | 11mo | $138,000 | $92 | 65 |
| 19361 Brookhurst St #34 | 0.32mi | 2/2.0 (-1) | 1,404 (-10%) | 11mo | $156,000 | $111 | 54 |
Match score weights: distance 35% · size 25% · config 20% · recency 20%. Top-matched comps best support the ARV.
Projected returns pro-forma
-3.0% appreciation · 1.2% rent growth · sell at horizon
- IRR
- 15.8%
- Equity multiple
- 1.62×
- Total profit
- $47,795
- Equity at exit
- $40,929
- IRR
- 23.1%
- Equity multiple
- 2.82×
- Total profit
- $139,772
- Equity at exit
- $23,734
Cash invested: $76,860 (down + closing). Projections, not guarantees.
Landlord ↔ Tenant lean methodology
- Overall (STATE)
- 18 Strongly Tenant-Friendly
- State California
- 18 Strongly Tenant-Friendly · D+13
- County
- — inherits STATE
- City
- — inherits STATE
ZIP-level market 92646
- Rents YoY
- 1.2%
- Active inventory
- 120
- Price-to-rent
- 5.2×
Monthly cashflow live
- Estimated rent
- $4,389 high interval (Pro) →
- Mortgage (P&I)
- −$1,440
- Tax est. 1.5%
- −$343 /mo · $4,118/yr
- Insurance
- −$114
- HOA
- −$0
- Vacancy / Maint / Mgmt
- −$922
- Net cashflow
- $1,570
Break-even live
Sensitivity live
| Price | -10% $1,760 | -5% $1,665 | +0% $1,570 | +5% $1,476 | +10% $1,381 |
|---|---|---|---|---|---|
| Rent | -10% $1,224 | -5% $1,397 | +0% $1,570 | +5% $1,744 | +10% $1,917 |
| Rate | -1.0pp $1,709 | -0.5pp $1,640 | base $1,570 | +0.5pp $1,499 | +1.0pp $1,427 |
UW: 25.0% down · 7.5% · 30yr · 1.5% tax · 5.0% vac · 8.0% maint · 8.0% mgmt
Financing live
Cash to close
- Down payment
- $68,625
- Closing costs
- $8,235
- Reserves months
- —
- Total cash needed
- —
Loan-product check · same deal, 3 products live
Conventional
25% down · 7.5% · 30yr
- Down + closing
- —
- Monthly P&I
- —
- Monthly cashflow
- —
- DSCR
- —
- Eligible?
- —
Personal DTI + credit; lowest rate.
DSCR
20% down · 8.5% · 30yr
- Down + closing
- —
- Monthly P&I
- —
- Monthly cashflow
- —
- DSCR
- —
- Eligible?
- —
No personal income docs; deal must DSCR.
Hard money
10% down · 12.0% · 12mo
- Down + closing
- —
- Monthly P&I
- —
- Monthly cashflow
- —
- DSCR
- —
- Eligible?
- —
Short-term bridge; refi at stabilization.
Rent comps 28 comps
| Address | Beds | Baths | Sqft | Rent | $/sqft | DOM | Units | Dist |
|---|---|---|---|---|---|---|---|---|
| 9704 Lark Cir Fountain Valley, CA | 4.0 | 2.5 | 1528 | $4,600 | $3.01 | 23d | 1 | 0.62mi |
| 19754 Kingswood Ln Huntington Beach, CA | 4.0 | 1.5 | 1254 | $3,595 | $2.87 | 0d | 1 | 0.71mi |
| 19775 Cambridge Ln Huntington Beach, CA | 3.0 | 2.5 | 1122 | $3,495 | $3.11 | 0d | 1 | 0.72mi |
| 9552 Bickley Dr #7 Huntington Beach, CA | 3.0 | 1.5 | 1100 | $3,500 | $3.18 | 0d | 1 | 0.75mi |
| 19844 Inverness Ln Huntington Beach, CA | 4.0 | 1.5 | 1254 | $3,675 | $2.93 | 0d | 1 | 0.80mi |
| 10107 Holburn Dr Huntington Beach, CA | 3.0 | 1.5 | 1122 | $3,500 | $3.12 | 0d | 1 | 0.81mi |
| 9021 Hyde Park Dr Huntington Beach, CA | 4.0 | 2.5 | 1818 | $5,750 | $3.16 | 0d | 1 | 0.81mi |
| 9022 Hyde Park Dr Huntington Beach, CA | 4.0 | 2.5 | 1868 | $4,995 | $2.67 | 26d | 1 | 0.82mi |
| 9582 Pettswood Dr Huntington Beach, CA | 3.0 | 1.5 | 1178 | $3,700 | $3.14 | 20d | 1 | 0.82mi |
| 9582 Pettswood Dr Huntington Beach, CA | 3.0 | 1.5 | 1174 | $3,700 | $3.15 | 18d | 1 | 0.82mi |
| 9595 Toucan Ave Fountain Valley, CA | 3.0 | 2.5 | 1548 | $4,200 | $2.71 | 18d | 1 | 0.83mi |
| 18236 Sanmian Ct Fountain Valley, CA | 3.0 | 3.0 | 1690 | $4,100 | $2.43 | 23d | 1 | 0.85mi |
| 19343 McLaren Ln Huntington Beach, CA | 3.0 | 2.0 | 1654 | $4,000 | $2.42 | 25d | 1 | 0.86mi |
| 9111 Warfield Dr Huntington Beach, CA | 4.0 | 2.5 | 1812 | $5,500 | $3.04 | 25d | 1 | 0.88mi |
| 19901 Sheffield Ln Huntington Beach, CA | 4.0 | 1.5 | 1254 | $3,795 | $3.03 | 18d | 1 | 0.90mi |
| 9727 Adams Ave Huntington Beach, CA | 3.0 | 2.5 | 1122 | $3,300 | $2.94 | 0d | 1 | 0.92mi |
| 10172 Ascot Cir Huntington Beach, CA | 3.0 | 1.5 | 1122 | $4,500 | $4.01 | 0d | 1 | 0.97mi |
| 18229 Olympic Ct Fountain Valley, CA | 3.0 | 2.0 | 1144 | $4,300 | $3.76 | 0d | 1 | 0.98mi |
| 8831 Sailport Dr Huntington Beach, CA | 4.0 | 3.0 | 2224 | $6,095 | $2.74 | 0d | 1 | 1.09mi |
| 8831 Sailport Dr Huntington Beach, CA | 4.0 | 2.5 | 2224 | $6,095 | $2.74 | 20d | 1 | 1.09mi |
| 18131 S 3rd St Fountain Valley, CA | 3.0 | 2.0 | 1254 | $5,000 | $3.99 | 0d | 1 | 1.19mi |
| 9213 El Tango Cir Fountain Valley, CA | 3.0 | 3.0 | 1670 | $4,800 | $2.87 | 0d | 1 | 1.36mi |
| 9891 Hot Springs Dr Huntington Beach, CA | 3.0 | 2.0 | 1494 | $7,000 | $4.69 | 0d | 1 | 1.40mi |
| 10220 El Monterey Ave Fountain Valley, CA | 3.0 | 2.0 | 1820 | $5,000 | $2.75 | 17d | 1 | 1.40mi |
| 10220 El Monterey Ave Fountain Valley, CA | 3.0 | 2.0 | 1820 | $5,000 | $2.75 | 18d | 1 | 1.40mi |
| 1803 Iowa St Costa Mesa, CA | 3.0 | 2.0 | 1550 | $4,300 | $2.77 | 22d | 1 | 1.43mi |
| 17698 Locust St Fountain Valley, CA | 4.0 | 2.0 | 2014 | $7,000 | $3.48 | 4d | 1 | 1.45mi |
| 8579 Volga River Cir Fountain Valley, CA | 3.0 | 2.0 | 1425 | $3,500 | $2.46 | 25d | 1 | 1.46mi |
Listing history 11 events
-
2026-06-21days on market $274,500 Active 16 DOM
-
2026-06-18days on market $274,500 Active 13 DOM
-
2026-06-17days on market $274,500 Active 12 DOM
-
2026-06-16days on market $274,500 Active 11 DOM
-
2026-06-15days on market $274,500 Active 10 DOM
-
2026-06-13days on market $274,500 Active 8 DOM
-
2026-06-13days on market $274,500 Active 7 DOM
-
2026-06-09days on market $274,500 Active 4 DOM
-
2026-06-08days on market $274,500 Active 3 DOM
-
2026-06-07remarks 695-char remark
-
2026-06-07$274,500 Active 2 DOM
ⓘ Source: listings_history table (triggers on properties + properties_extension) + one-shot
backfill from property_details.listing_events for pre-trigger history.
Climate risk First Street
- Flood 5/10 Major FEMA zone X · 27% chance over 30 yrs
- Wildfire 1/10 Low
- Heat 5/10 Major 7 d/yr ≥85°F today · 23 d/yr by 30 yrs out
- Wind 1/10 Low
- Air quality 4/10 Moderate 5 unhealthy d/yr today · 7 by 30 yrs out
Nearby sold comps map
Loading sold comps map…
Walkable amenities ~0.75 mi
Loading nearby amenities…
Taxation est. · year 1
- Rental income
- $52,669
- − Mortgage interest
- −$15,376
- − Property taxes
- −$4,118
- − Insurance
- −$1,372
- − Repairs & maintenance
- −$4,214
- − Management
- −$4,214
- − Depreciation
- −$7,985
- Taxable income
- $15,391
- Est. tax owed @ 24.0%
- −$3,694
- After-tax cash flow
- $15,151/yr
For passive investors: Depreciation is non-cash, so a rental often shows a tax loss while cash-flowing — sheltering income. Rental losses are passive: they offset passive income freely, and up to $25,000/yr can offset ordinary (W-2) income if you actively participate and your MAGI is under $100k (phasing out to $0 by $150k); unused losses carry forward. On sale, claimed depreciation is recaptured at up to 25%, and gains may owe capital-gains tax (a 1031 exchange can defer both). Figures are a year-1 estimate at your 24.0% rate — not tax advice; consult a CPA.
Schools (NCES district)
- District
- Huntington Beach Union High
- NCES district ID
- 0618060
- Math proficiency
- 65% ▲ 17.00%
- Reading proficiency
- 82% ▲ 8.00%
- Median HH income
- $78,159
- Composite
- 64.9/100
- National rank
- #511
- State rank
- #39 of 517 in CA
Livability — Huntington Beach
- Score
- 67/100
- State rank
- #306
- US rank
- #10298
Category grades
Schools grade is shown separately in the Schools card above.
Census & demographics
- Census place
- Huntington Beach, CA
- County
- Orange County · 3,096,323 people
- City population
- 194,835
- Metro
- Los Angeles-Long Beach-Anaheim, CA
- Population (ZIP)
- 54,615
- Household income
- $130,672
- Rent vs Own
- Severe rent burden
- 1226.0
Population outlook (Orange County) Hauer SSP2
- Today (2025)
- 3,477,456 people
- By 2030
- 3,613,117 · +3.9%
- By 2040
- 3,835,945 · +10.3%
- By 2050
- 3,968,736 · +14.1%
- By 2075
- 4,097,053 · +17.8%
- By 2100
- 3,903,633 · +12.3%
Race, ethnicity, and origin ACS 2023
- Neighborhood character
- Diverse neighborhood (Simpson 0.56)
- Race & ethnicity
- White 63% Hispanic / Latino 16% Asian 13% Two or more races 13%
- Hispanic origin (detail)
- Mexican 11%
- Common ancestry
- Italian 3% Romanian 2% Lithuanian 2%
- Foreign-born
- 15% · Vietnam, Canada, China
- Languages at home
- 80% English-only · Spanish 7% Vietnamese 5% Chinese 2%
Political lean MEDSL · Orange
- 2024 margin
- Toss-up / Even · D 49.7% · R 47.1% · Other 3.2%
- 2008→2024 swing
- +5.2pp toward D · 2008: -2.6pp · 2024: 2.6pp
- All cycles
- 2024: D+2.6 2020: D+9.0 2016: D+7.7 2012: R+8.3 2008: R+2.6
Not yet ingested
- Civics
- —
Market trends
- HPI YoY
- ▼ -1082.92%
- Current HPI
- 459.3987
- Rent YoY
- ▲ 1.20%
- Metro
- Los Angeles-Long Beach-Anaheim, CA
- State GDP YoY
- ▲ 3.21%
- F500 in state
- 116
Industry mix (Fortune 500 HQ in CA)
| Industry | F500 HQs | Revenue |
|---|---|---|
| Technology | 27 | $1,492B |
|
||
| Financial Services | 3 | $174B |
|
||
| Retail | 3 | $44B |
|
||
| Insurance | 3 | $26B |
|
||
| Media / Entertainment | 2 | $115B |
|
||
| Pharmaceuticals / Biotech | 2 | $62B |
|
||
Price history
+20.7% since first listed12 events — show timeline
- 2026-06-05 Listed $274,500 CRMLS
- 2025-01-06 Sold (MLS) $195,000 CRMLS
- 2025-01-01 Pending — CRMLS
- 2024-12-23 Contingent — CRMLS
- 2024-10-04 Price Changed $197,000 CRMLS
- 2024-08-22 Listed $215,000 CRMLS
- 2024-07-25 Sold (MLS) $199,999 CRMLS
- 2024-07-11 Pending — CRMLS
- 2024-06-21 Relisted — CRMLS
- 2024-06-06 Price Changed $199,999 CRMLS
- 2024-04-25 Listed $227,500 CRMLS
- 2024-04-21 Coming Soon $227,500 CRMLS
Property tax history
-3.6%/yrLatest (2025): $269 · +25.0% YoY. Source: county tax records.
Cash-flow waterfall
monthlySold comps — $/sqft
last 12 mo · ≤1 miLoading sold comps…