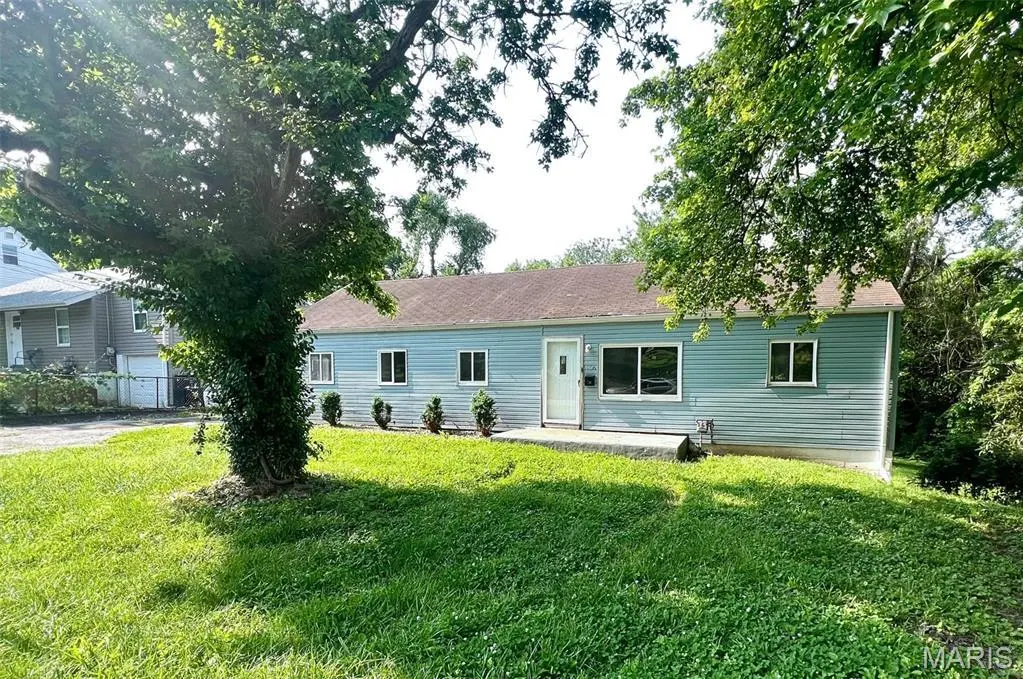
456 Bluff Dr · Riverview, MO
Flood risk 1/10 · Minimal
- FEMA flood zone
- X (unshaded)
- Chance of flooding over 30 yrs
- 0.0%
- Est. flood insurance / yr
- $473 – $860
Fire risk 1/10 · Minimal
- Est. fire insurance / yr
- $1,054 – $1,958
Heat risk 5/10 · Moderate
- Hot days now (above 107°F)
- 7 days/yr
- Hot days in 30 yrs
- 21 days/yr
Wind risk 2/10 · Minimal
- Chance of severe wind over 30 yrs
- 1.0%
Air-quality risk 4/10 · Minor
- Unhealthy air days now
- 5 days/yr
- Unhealthy air days in 30 yrs
- 6 days/yr
Risk factors via First Street. Map © Google.
Why this score? — see what drove the B- grade
The composite is a weighted blend of 9 inputs, each scored 0–100. Each bar is that input's sub-score; the figure is the points it added to the 100-point composite (weight × sub-score).
- Cash flow +30.0/30.0
- 1% rule +10.0/10.0
- DSCR +10.0/10.0
- ARV discount +9.7/15.0
- Rent growth +4.1/5.0
- Livability +2.9/5.0
- Condition / age +2.5/5.0
- Schools +0.4/10.0
- Appreciation +0.0/10.0
$75,900
🖨 Deal sheet 📄 Offer letter ✓ Due diligence
Listing remarks
Welcome to this expansive 1,200+ square foot, single-story home in the heart of Riverview! Situated on a large lot, this home offers the perfect balance of comfort and functionality. Featuring three generous bedrooms, including one with a walk-in closet, and a hall bath located directly outside of the bedrooms, this property provides plenty of space for family and guests. Step into the inviting large living room, where natural light pours in, creating a warm and welcoming atmosphere. A bonus living room sits just off to the right, perfect for a cozy reading nook, play area, or home office. The separate dining area and eat-in kitchen offer the ideal spaces for entertaining or casual meals. T
Key facts
- Walk-in closet
- Large lot
- Walk-out basement
Tags
Property features AI
Finance
- Other: Living area: 1,248 (per public records); Lot size approximately 0.39 acres
- Financial info: Lease not considered; Seller may consider concessions
Exterior
- Utilities: Public water; Public sewer; Ameren electric; Cable available; Natural gas connected; Phone available; Sewer connected; Water connected
- Home design: Single-family residence; One story; Residential property
- Construction: Vinyl siding; Block foundation; Basement (unfinished, 8+ ft pour); Year built: public records
- Exterior features: Many trees on the lot; Near public transit; Walk-out basement access
Interior
- Kitchen: Dishwasher; Microwave
- Bedrooms: 3 bedrooms (all on the main level)
- Bathrooms: 1 full bathroom (main level)
- Heating & cooling: Forced air heating; Central air conditioning
- Interior features: Eat-in kitchen; Decorative fireplace
- Laundry & utility: Main level laundry
Neighborhood map
What this means for you Summary
Snapshot
- This is a 3-bed/1.0-bath single-family listed at $76k.
Deal economics
- At list price, monthly cash flow is $508 ($6k/yr) — positive.
- The deal already cash-flows at list — no discount required.
- Meets the 1% rule at list price ($1k rent vs $76k).
Location & tenants
- Location reads 58/100 on livability (#579 in MO) — a working-class tenant base; expect higher turnover. Strengths: cost of living A+, housing A+; Watch: employment D+, crime F, amenities F.
- Riverview Gardens (suburban): math 2% / reading 9% proficiency, ranked #324 of 324 in MO (top 100%) — low school quality limits family demand, transient renter base, plan for 1-2y turnover; 90% free/reduced lunch — lower-income household profile, screen leases tightly.
- Zoned schools: Glasgow Elem. (math 2% / reading 2%, grade F, #1,099 of 1,115 statewide, top 100%, 269 students, 99% FRL); Riverview Gardens Sr. High (math 2% / reading 18%, grade F, #501 of 521 statewide, top 97%, 1,331 students, 100% FRL).
- Market conditions: Rents rising fast (+6.6%/yr); 201 active listings in the ZIP; 40 comparable units currently listed for rent nearby; rentals at typical pace (median 24d on market — plan ~3-4 weeks tenant-placement turnaround); 42% of comp listings sitting > 30 days — soft ceiling on asking rent; lower-income renter base — watch delinquency; 920 units permitted in St. Louis County in 2024 (250 in 5+ unit buildings).
- This rent runs 36% of the median local income ($43k/yr) — at the standard rent-burdened threshold; future hikes will face affordability resistance.
Forward outlook
- Local home prices are declining (-3.0%/yr); year-one equity from $525 of loan paydown is wiped out by about $2k of value loss. Plan a longer hold.
- At projected returns (-3.0% appreciation + 6.6% rent growth), your $21k cash investment doubles in ~4 years — after that, you're playing with house money.
Negotiation context
- Only 6 days on market — expect competitive offers; lowballing is unlikely to land.
- 8 sale attempts since 7y ago with the ask held roughly flat each time — persistent listings suggest the price (not the market) is what's stuck; bring a comps-based counter.
Risks & watch-outs
- Watch-outs: built in 1950 — expect roof / HVAC / electrical / plumbing capex.
- Climate carrying-cost: extreme-heat days projected 7→21/yr by 2055 (HVAC capex compounding) — expect insurance premiums to compound above CPI over the hold.
Questions for the listing agent
- Built in 1950 — when were the roof, HVAC, electrical panel, plumbing, and water heater last replaced?
- Is there a deadline driving the sale (1031 exchange, divorce, estate, relocation)? That informs how much negotiation room exists.
- Schools are F-rated, which usually means shorter tenancies and higher turnover. Who's the typical renter profile here, and what's been the actual vacancy rate?
- Crime grade is F in this area — have there been break-ins, vandalism, or insurance claims at this property in the last 3 years? What carrier currently insures it and at what premium?
- What's the average days-on-market for RENTAL listings here right now (not sales)? A rising rental-DOM trend means longer vacancies and softer asking-rent achievability than the comps imply.
- What's the recent tenant-quality profile in this submarket — average credit score on applications, eviction rate, late-payment / NSF rate, and stable-employment percentage? A property-management company in the area should have these aggregated.
- How much new for-sale + rental construction is in the pipeline within 1–3 miles? Heavy new supply typically softens prices + rents 12–24 months out; constrained supply supports both.
Investment metrics
- 1% rule
- 1.73% ✓
- Cap rate
- 14.32%
- Cash-on-cash
- 28.68%
- DSCR
- 2.28
- GRM
- 4.8
CMA / ARV
- ARV (on-the-fly)
- $79,872
- Comps found
- 12
Show comp detail 12 sales within ~0.75 mi
| Address | Dist | Beds/Ba | Sqft | Sold | Price | $/sf | Match |
|---|---|---|---|---|---|---|---|
| 356 Scenic Dr | 0.24mi | 4/2.0 (+1) | 1,252 (+0%) | 0mo | $39,900 | $32 | 79 |
| 9920 Diamond Dr | 0.38mi | 2/1.0 (-1) | 1,273 (+2%) | 3mo | $33,352 | $26 | 72 |
| 435 Adrian Dr | 0.06mi | 3/2.0 | 1,100 (-12%) | 4mo | $45,000 | $41 | 71 |
| 465 Bluff Dr | 0.05mi | 2/2.0 (-1) | 1,333 (+7%) | 10mo | $85,000 | $64 | 68 |
| 9846 Lilac Dr | 0.25mi | 3/1.0 | 1,116 (-11%) | 4mo | $55,000 | $49 | 68 |
| 555 Leeton Ave | 0.41mi | 3/1.0 | 1,320 (+6%) | 5mo | $39,900 | $30 | 67 |
| 9916 Lilac Dr | 0.35mi | 3/1.0 | 1,352 (+8%) | 9mo | $146,000 | $108 | 62 |
| 10042 Lilac Ave | 0.61mi | 2/1.0 (-1) | 1,282 (+3%) | 2mo | $104,900 | $82 | 61 |
| 122 Coburg Dr | 0.74mi | 3/1.5 | 1,188 (-5%) | 0mo | $10,000 | $8 | 55 |
| 9705 Riverview Dr | 0.34mi | 2/1.0 (-1) | 1,066 (-15%) | 10mo | $125,000 | $117 | 47 |
| 10203 Hobkirk Dr | 0.71mi | 3/1.0 | 1,108 (-11%) | 9mo | $105,000 | $95 | 40 |
| 10219 Valley Dr | 0.72mi | 3/1.0 | 1,100 (-12%) | 11mo | $95,000 | $86 | 38 |
Match score weights: distance 35% · size 25% · config 20% · recency 20%. Top-matched comps best support the ARV.
Projected returns pro-forma
-3.0% appreciation · 6.59% rent growth · sell at horizon
- IRR
- 27.0%
- Equity multiple
- 2.18×
- Total profit
- $24,998
- Equity at exit
- $11,317
- IRR
- 36.7%
- Equity multiple
- 5.01×
- Total profit
- $85,255
- Equity at exit
- $6,562
Cash invested: $21,252 (down + closing). Projections, not guarantees.
Landlord ↔ Tenant lean methodology
- Overall (STATE)
- 81 Strongly Landlord-Friendly
- State Missouri
- 81 Strongly Landlord-Friendly · R+10
- County
- — inherits STATE
- City
- — inherits STATE
ZIP-level market 63137
- Rents YoY
- 6.6%
- Active inventory
- 201
- Price-to-rent
- 4.8×
Monthly cashflow live
- Estimated rent
- $1,314 high interval (Pro) →
- Mortgage (P&I)
- −$398
- Tax from tax record
- −$101 /mo · $1,207/yr
- Insurance
- −$32
- HOA
- −$0
- Vacancy / Maint / Mgmt
- −$276
- Net cashflow
- $508
Break-even live
UW: 25.0% down · 7.5% · 30yr · 1.5% tax · 5.0% vac · 8.0% maint · 8.0% mgmt
Financing live
Cash to close
- Down payment
- $18,975
- Closing costs
- $2,277
- Reserves months
- —
- Total cash needed
- —
Loan-product check · same deal, 3 products live
Conventional
25% down · 7.5% · 30yr
- Down + closing
- —
- Monthly P&I
- —
- Monthly cashflow
- —
- DSCR
- —
- Eligible?
- —
Personal DTI + credit; lowest rate.
DSCR
20% down · 8.5% · 30yr
- Down + closing
- —
- Monthly P&I
- —
- Monthly cashflow
- —
- DSCR
- —
- Eligible?
- —
No personal income docs; deal must DSCR.
Hard money
10% down · 12.0% · 12mo
- Down + closing
- —
- Monthly P&I
- —
- Monthly cashflow
- —
- DSCR
- —
- Eligible?
- —
Short-term bridge; refi at stabilization.
Rent comps 40 comps
| Address | Beds | Baths | Sqft | Rent | $/sqft | DOM | Units | Dist |
|---|---|---|---|---|---|---|---|---|
| 460 Bluff Dr Saint Louis, MO | 3.0 | 1.0 | 1002 | $1,300 | $1.30 | 44d | 1 | 0.04mi |
| 435 Adrian Dr Saint Louis, MO | 3.0 | 1.0 | 1100 | $950 | $0.86 | 20d | 1 | 0.09mi |
| 9746 Diamond Dr Saint Louis, MO | 3.0 | 2.0 | 910 | $1,275 | $1.40 | 44d | 1 | 0.18mi |
| 9640 Diamond Dr Saint Louis, MO | 1.0–2.0 | 1.0 | 625 | $800 | $1.28 | 15d | 3 | 0.19mi |
| 9811 Lilac Dr Unit I St. Louis, MO | 2.0 | 1.0 | 705 | $799 | $1.13 | 44d | 1 | 0.19mi |
| 371 Adrian Dr Saint Louis, MO | 2.0 | 1.0 | 1337 | $1,200 | $0.90 | 44d | 1 | 0.21mi |
| 344 Midridge Dr Saint Louis, MO | 2.0 | 1.0 | 810 | $1,053 | $1.30 | 44d | 1 | 0.23mi |
| 623 Ludlow Dr Saint Louis, MO | 2.0 | 1.0 | 840 | $1,199 | $1.43 | 23d | 1 | 0.29mi |
| 9924 Gloucester Dr Saint Louis, MO | 3.0 | 2.0 | 992 | $1,565 | $1.58 | 10d | 1 | 0.33mi |
| 637 Karess Dr Saint Louis, MO | 2.0 | 2.0 | 1190 | $1,525 | $1.28 | 12d | 1 | 0.35mi |
| 9943 Lilac Dr Saint Louis, MO | 2.0 | 1.0 | 1086 | $1,000 | $0.92 | 44d | 1 | 0.37mi |
| 255 Chambers Rd St. Louis, MO | 2.0 | 1.0 | 700 | $850 | $1.21 | 44d | 1 | 0.48mi |
| 9517 West Ave Unit 1F St. Louis, MO | 3.0 | 1.0 | 1300 | $1,300 | $1.00 | 44d | 1 | 0.55mi |
| 10052 Diamond Dr Saint Louis, MO | 4.0 | 1.0 | 1181 | $1,495 | $1.27 | 12d | 1 | 0.56mi |
| 10019 Northgate Dr Saint Louis, MO | 3.0 | 1.0 | 991 | $1,150 | $1.16 | 22d | 1 | 0.58mi |
| 10052 Lilac Ave Saint Louis, MO | 3.0 | 1.5 | 1143 | $1,100 | $0.96 | 7d | 1 | 0.60mi |
| 10066 Dorothy Ave Saint Louis, MO | 2.0 | 1.0 | 916 | $1,225 | $1.34 | 22d | 1 | 0.66mi |
| 10063 Northgate Dr Saint Louis, MO | 2.0 | 1.0 | 1054 | $1,200 | $1.14 | 44d | 1 | 0.66mi |
| 10201 Gourock Dr Saint Louis, MO | 3.0 | 1.0 | 886 | $1,275 | $1.44 | 44d | 1 | 0.67mi |
| 10213 Durness Dr Saint Louis, MO | 2.0 | 1.0 | 932 | $1,225 | $1.31 | 44d | 1 | 0.71mi |
| 10327 Renfrew Dr Saint Louis, MO | 3.0 | 1.0 | 844 | $1,199 | $1.42 | 44d | 1 | 0.75mi |
| 416 Crawford Rd Saint Louis, MO | 3.0 | 1.0 | 844 | $1,499 | $1.78 | 23d | 1 | 0.78mi |
| 10309 Galloway Dr Saint Louis, MO | 3.0 | 1.0 | 892 | $1,295 | $1.45 | 12d | 1 | 0.78mi |
| 10401 Hobkirk Dr Saint Louis, MO | 3.0 | 1.0 | 1050 | $1,500 | $1.43 | 17d | 1 | 0.86mi |
| 317 Cameron Rd Saint Louis, MO | 3.0 | 1.0 | 854 | $1,350 | $1.58 | 23d | 1 | 0.91mi |
| 325 Caithness Rd Saint Louis, MO | 3.0 | 1.0 | 854 | $1,540 | $1.80 | 44d | 1 | 0.91mi |
| 325 Caithness Rd Saint Louis, MO | 3.0 | 1.0 | 854 | $1,425 | $1.67 | 12d | 1 | 0.91mi |
| 437 Lancashire Rd Saint Louis, MO | 3.0 | 1.0 | 1082 | $1,395 | $1.29 | 44d | 1 | 0.95mi |
| 308 Lanark Rd Saint Louis, MO | 3.0 | 1.0 | 1154 | $1,400 | $1.21 | 23d | 1 | 0.96mi |
| 1130 Forest Home Dr Saint Louis, MO | 3.0 | 1.0 | 1025 | $1,275 | $1.24 | 44d | 1 | 0.96mi |
| 400 Lancashire Rd Saint Louis, MO | 3.0 | 1.0 | 1200 | $1,095 | $0.91 | 44d | 1 | 0.96mi |
| 305 Lancashire Rd Saint Louis, MO | 3.0 | 1.0 | 854 | $1,100 | $1.29 | 18d | 1 | 0.99mi |
| 432 Midlothian Rd Saint Louis, MO | 3.0 | 1.0 | 1120 | $1,350 | $1.21 | 10d | 1 | 1.01mi |
| 232 Cameron Rd Saint Louis, MO | 3.0 | 1.0 | 984 | $1,295 | $1.32 | 12d | 1 | 1.01mi |
| 10203 Trio Ln Saint Louis, MO | 3.0 | 1.0 | 912 | $1,435 | $1.57 | 16d | 1 | 1.01mi |
| 808 Bella Ln Saint Louis, MO | 4.0 | 2.0 | 1300 | $1,650 | $1.27 | 17d | 1 | 1.02mi |
| 743 Shepley Dr Saint Louis, MO | 3.0 | 1.0 | 932 | $1,025 | $1.10 | 7d | 1 | 1.02mi |
| 312 Banff Cir Saint Louis, MO | 3.0 | 1.0 | 854 | $1,175 | $1.38 | 23d | 1 | 1.04mi |
| 815 Bella Ln Saint Louis, MO | 3.0 | 1.0 | 864 | $1,275 | $1.48 | 44d | 1 | 1.05mi |
| 457 Shepley Dr Saint Louis, MO | 3.0 | 1.0 | 854 | $1,350 | $1.58 | 23d | 1 | 1.07mi |
Listing history 6 events
-
2026-06-18days on market $75,900 Active 6 DOM
-
2026-06-17days on market $75,900 Active 5 DOM
-
2026-06-16days on market $75,900 Active 4 DOM
-
2026-06-15days on market $75,900 Active 3 DOM
-
2026-06-13remarks 699-char remark
-
2026-06-13$75,900 Active 1 DOM
ⓘ Source: listings_history table (triggers on properties + properties_extension) + one-shot
backfill from property_details.listing_events for pre-trigger history.
Tax reassessment forecast MO · Resets to sale price
- Current annual tax
- $1,207 · $101/mo
- Projected year-2 tax
- $1,207 · $101/mo
- Expected delta
- $0/yr ($0/mo · 0.0%)
ⓘ Screening estimate from a state-policy table — verify with the county assessor before closing.
Climate risk First Street
- Flood 1/10 Low FEMA zone X (unshaded) · 0% chance over 30 yrs
- Wildfire 1/10 Low
- Heat 5/10 Major 7 d/yr ≥107°F today · 21 d/yr by 30 yrs out
- Wind 2/10 Low 100% chance of damaging wind over 30 yrs
- Air quality 4/10 Moderate 5 unhealthy d/yr today · 6 by 30 yrs out
Nearby sold comps map
Loading sold comps map…
Walkable amenities ~0.75 mi
Loading nearby amenities…
Taxation est. · year 1
- Rental income
- $15,771
- − Mortgage interest
- −$4,252
- − Property taxes
- −$1,207
- − Insurance
- −$380
- − Repairs & maintenance
- −$1,262
- − Management
- −$1,262
- − Depreciation
- −$2,208
- Taxable income
- $5,201
- Est. tax owed @ 24.0%
- −$1,248
- After-tax cash flow
- $4,848/yr
For passive investors: Depreciation is non-cash, so a rental often shows a tax loss while cash-flowing — sheltering income. Rental losses are passive: they offset passive income freely, and up to $25,000/yr can offset ordinary (W-2) income if you actively participate and your MAGI is under $100k (phasing out to $0 by $150k); unused losses carry forward. On sale, claimed depreciation is recaptured at up to 25%, and gains may owe capital-gains tax (a 1031 exchange can defer both). Figures are a year-1 estimate at your 24.0% rate — not tax advice; consult a CPA.
Schools (NCES district)
- District
- Riverview Gardens
- NCES district ID
- 2926670
- Math proficiency
- 2% ▼ -6.00%
- Reading proficiency
- 9% ▼ -6.00%
- Median HH income
- $32,759
- Composite
- 4.22/100
- National rank
- #10058
- State rank
- #324 of 324 in MO
Livability — Riverview
- Score
- 58/100
- State rank
- #579
- US rank
- #20673
Category grades
Schools grade is shown separately in the Schools card above.
Census & demographics
- Census place
- Riverview, MO
- County
- Saint Louis County · 888,823 people
- City population
- 19,690
- Metro
- St. Louis, MO-IL
- Population (ZIP)
- 19,684
- Household income
- $43,422
- Rent vs Own
- Severe rent burden
- 1863.0
Population outlook (St. Louis County) Hauer SSP2
- Today (2025)
- 1,025,227 people
- By 2030
- 1,028,023 · +0.3%
- By 2040
- 1,020,940 · -0.4%
- By 2050
- 1,007,280 · -1.8%
- By 2075
- 987,277 · -3.7%
- By 2100
- 921,984 · -10.1%
Race, ethnicity, and origin ACS 2023
- Neighborhood character
- Predominantly Black (82%)
- Race & ethnicity
- Black 82% White 13% Two or more races 3%
- Common ancestry
- Romanian 1% Lithuanian 1% Italian 1%
- Foreign-born
- 1%
Political lean MEDSL · St. Louis
- 2024 margin
- Strong D (+23.4) · D 60.8% · R 37.4% · Other 1.7%
- 2008→2024 swing
- +3.5pp toward D · 2008: 19.9pp · 2024: 23.4pp
- All cycles
- 2024: D+23.4 2020: D+24.0 2016: D+16.2 2012: D+13.7 2008: D+19.9
Not yet ingested
- Civics
- —
Market trends
- HPI YoY
- ▼ -96.70%
- Current HPI
- 130.6765
- Rent YoY
- ▲ 6.59%
- Metro
- St. Louis, MO-IL
- State GDP YoY
- ▲ 1.84%
- F500 in state
- 20
Industry mix (Fortune 500 HQ in MO)
| Industry | F500 HQs | Revenue |
|---|---|---|
| Healthcare | 1 | $163B |
|
||
| Insurance | 1 | $21B |
|
||
| Industrial Technology | 1 | $17B |
|
||
| Retail | 1 | $16B |
|
||
| Industrial Distribution | 1 | $10B |
|
||
| Utilities | 1 | $9B |
|
||
Price history
+32.6% since first listed25 events — show timeline
- 2026-06-12 Listed $75,900 MARIS as Distributed by MLS Grid
- 2026-01-21 Relisted — MARIS as Distributed by MLS Grid
- 2026-01-12 Pending — MARIS as Distributed by MLS Grid
- 2026-01-06 Listed $79,900 MARIS as Distributed by MLS Grid
- 2025-11-17 Rental Removed $1,299 APPFOLIO
- 2025-11-07 Price Changed $1,299 APPFOLIO
- 2025-10-24 Price Changed $1,350 APPFOLIO
- 2025-08-30 Listed for Rent $1,399 APPFOLIO
- 2025-08-20 Listed $99,900 MARIS as Distributed by MLS Grid
- 2022-03-30 Sold (Public Records) $77,000 Public Records
- 2022-03-07 Sold (Public Records) $45,000 Public Records
- 2019-06-20 Sold (Public Records) $15,000 Public Records
- 2019-06-18 Sold (MLS) — MARIS as Distributed by MLS Grid
- 2019-06-10 Pending — MARIS as Distributed by MLS Grid
- 2019-05-16 Price Changed $18,900 MARIS as Distributed by MLS Grid
- 2019-05-03 Price Changed $12,000 MARIS as Distributed by MLS Grid
- 2019-04-14 Price Changed $19,900 MARIS as Distributed by MLS Grid
- 2019-03-21 Relisted — MARIS as Distributed by MLS Grid
- 2019-03-14 Contingent — MARIS as Distributed by MLS Grid
- 2019-03-09 Listed $22,000 MARIS as Distributed by MLS Grid
- 2019-02-28 Sold (MLS) — MARIS as Distributed by MLS Grid
- 2019-02-14 Pending — MARIS as Distributed by MLS Grid
- 2019-01-08 Listed $33,000 MARIS as Distributed by MLS Grid
- 2002-02-11 Sold (Public Records) $57,250 Public Records
- 1980-07-01 Sold (Public Records) — Public Records
Property tax history
+1.4%/yrLatest (2022): $1,207 · +1.0% YoY. Source: county tax records.
Cash-flow waterfall
monthlySold comps — $/sqft
last 12 mo · ≤1 miLoading sold comps…