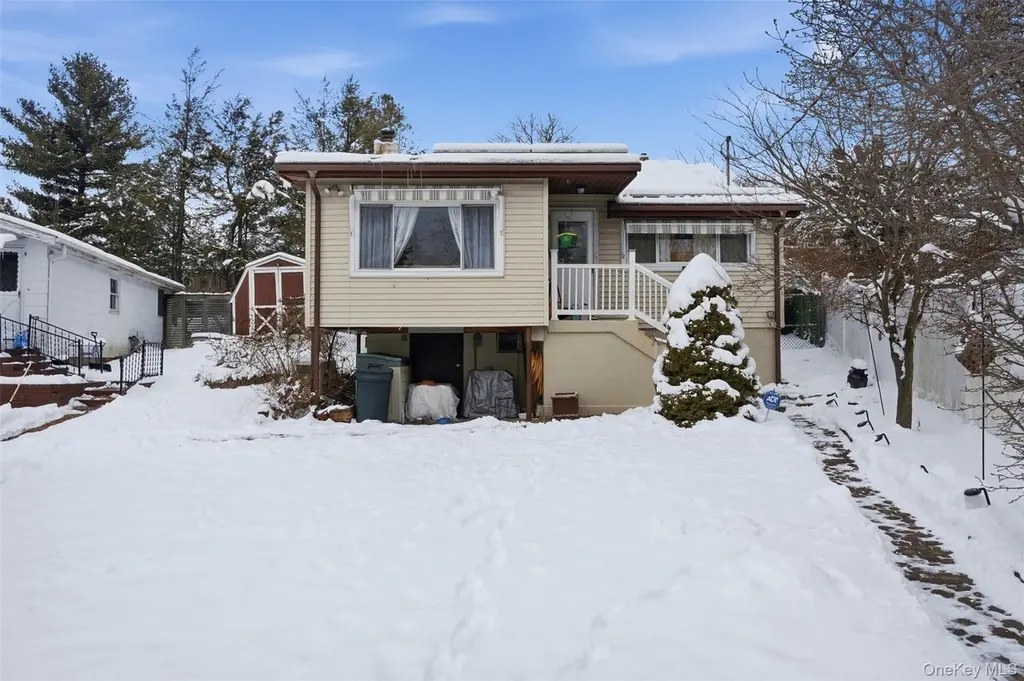
26 St Georges Ave · Walton Park, NY
Flood risk 1/10 · Minimal
- FEMA flood zone
- X (unshaded)
- Chance of flooding over 30 yrs
- 0.0%
- Est. flood insurance / yr
- $473 – $860
Fire risk 3/10 · Minor
- Est. fire insurance / yr
- $691 – $1,283
Heat risk 4/10 · Minor
- Hot days now (above 96°F)
- 7 days/yr
- Hot days in 30 yrs
- 16 days/yr
Wind risk 4/10 · Minor
- Chance of severe wind over 30 yrs
- 18.0%
Air-quality risk 2/10 · Minimal
- Unhealthy air days now
- 2 days/yr
- Unhealthy air days in 30 yrs
- 2 days/yr
Risk factors via First Street. Map © Google.
Why this score? — see what drove the D grade
The composite is a weighted blend of 9 inputs, each scored 0–100. Each bar is that input's sub-score; the figure is the points it added to the 100-point composite (weight × sub-score).
- ARV discount +15.0/15.0
- Cash flow +7.5/30.0
- Schools +5.0/10.0
- Livability +3.1/5.0
- 1% rule +3.0/10.0
- Rent growth +2.9/5.0
- Condition / age +2.5/5.0
- DSCR +1.6/10.0
- Appreciation +0.0/10.0
$349,900
🖨 Deal sheet 📄 Offer letter ✓ Due diligence
Listing remarks MLS
Welcome to 26 St. Georges Avenue, a cozy and inviting 2-bedroom, 1-bath ranch-style home nestled in a quaint Monroe neighborhood. This well-laid-out home offers comfortable single-level living and is perfect for those seeking simplicity and convenience. Enjoy being just minutes from beautiful local lakes, ideal for outdoor recreation and relaxation. The surrounding neighborhood offers a peaceful, community-oriented feel while still being close to shopping, dining, and major roadways.
Key facts
- Close to dining
- Single-level living
- Close to shopping
Tags
Neighborhood map
What this means for you Summary
Snapshot
- This is a 2-bed/1.0-bath single-family listed at $350k.
Deal economics
- At list price, monthly cash flow is $-443 ($-5k/yr) — negative.
- To cash-flow at today's rent, offer at most $272k (22.3% below list).
- To meet the 1% rule (rent ≥ 1% of price), the offer needs to be $278k (20.4% below list).
- Recommended offer: $272k (22.3% below list) — sets the bar for cash-flow.
- Cap rate 4.8% vs local median 3.3% in Walton Park — top-decile yield for the area; either an underpriced asset or a hidden risk that comps aren't pricing in. Stress-test before assuming the spread holds.
Location & tenants
- Location reads 62/100 on livability (#830 in NY) — a middle-class / working-renter tenant base. Strengths: employment A+, housing A+, crime A; Watch: schools D+, amenities F, commute F.
- Monroe-Woodbury Central School District (suburban): math 50% / reading 56% proficiency, ranked #250 of 590 in NY (top 42%) — acceptable for families but not a draw, mixed tenant base, ~2y average lease; only 15% free/reduced lunch — higher-income household profile.
- Market conditions: Rents rising (+1.5%/yr); 316 active listings in the ZIP; 5 comparable units currently listed for rent nearby; rentals at typical pace (median 24d on market — plan ~3-4 weeks tenant-placement turnaround); solid renter incomes; 1,746 units permitted in Orange County in 2024 (1,265 in 5+ unit buildings).
- This rent runs 42% of the median local income ($79k/yr) — at the standard rent-burdened threshold; future hikes will face affordability resistance.
Forward outlook
- Local home prices are declining (-3.0%/yr); year-one equity from $2k of loan paydown is wiped out by about $10k of value loss. Plan a longer hold.
Negotiation context
- It's been on market 149 days — a 12% lower offer ($308k) is reasonable based on typical stale-listing flexibility.
- Current owner paid $73k; list at $350k implies a 379% gain — meaningful room to come down on a strong offer.
Risks & watch-outs
- Watch-outs: built in 1950 — expect roof / HVAC / electrical / plumbing capex.
Questions for the listing agent
- What do current leases actually rent for vs. the listed asking? Can we see a recent rent roll and the last 12 months of T-12 income?
- It's been on market 149 days. Have you received any prior offers? Is the seller open to a 22% concession, seller financing, or rate buy-down credit?
- Built in 1950 — when were the roof, HVAC, electrical panel, plumbing, and water heater last replaced?
- Why hasn't it sold? Are there any deal-killer items the seller is aware of (foundation, flood, title, zoning, code violations)?
- Is there a deadline driving the sale (1031 exchange, divorce, estate, relocation)? That informs how much negotiation room exists.
- Schools are D-rated, which usually means shorter tenancies and higher turnover. Who's the typical renter profile here, and what's been the actual vacancy rate?
- The area grade is low — what's the realistic commute time and amenity access for the typical tenant pool here? Any planned neighborhood developments (good or bad) we should know about?
- What's the average days-on-market for RENTAL listings here right now (not sales)? A rising rental-DOM trend means longer vacancies and softer asking-rent achievability than the comps imply.
- What's the recent tenant-quality profile in this submarket — average credit score on applications, eviction rate, late-payment / NSF rate, and stable-employment percentage? A property-management company in the area should have these aggregated.
- How much new for-sale + rental construction is in the pipeline within 1–3 miles? Heavy new supply typically softens prices + rents 12–24 months out; constrained supply supports both.
Investment metrics
- 1% rule
- 0.80% ✗
- Cap rate
- 4.77%
- Cash-on-cash
- -5.42%
- DSCR
- 0.76
- GRM
- 10.5
CMA / ARV
- ARV (median comp)
- $461,985
- List price
- $349,900
- Delta
- -24.26%
- Verdict
- UNDERPRICED
- Comps
- 20 within 1.0 mi
Show comp detail 6 sales within ~0.75 mi
| Address | Dist | Beds/Ba | Sqft | Sold | Price | $/sf | Match |
|---|---|---|---|---|---|---|---|
| 20 St Georges Ave | 0.03mi | 3/2.0 (+1) | 1,472 (+6%) | 4mo | $400,000 | $272 | 76 |
| 108 Highland Ave | 0.19mi | 3/1.5 (+1) | 1,426 (+3%) | 20mo | $525,000 | $368 | 63 |
| 19 Taurus Ave | 0.22mi | 3/1.5 (+1) | 1,288 (-7%) | 11mo | $389,000 | $302 | 61 |
| 21 Sparrow St | 0.40mi | 3/1.0 (+1) | 1,342 (-3%) | 15mo | $440,000 | $328 | 58 |
| 86 Cromwell Hill Rd | 0.65mi | 3/1.0 (+1) | 1,421 (+2%) | 22mo | $360,000 | $253 | 43 |
| 92 Osseo Park Rd | 0.43mi | 3/2.5 (+1) | 1,464 (+6%) | 22mo | $528,000 | $361 | 41 |
Match score weights: distance 35% · size 25% · config 20% · recency 20%. Top-matched comps best support the ARV.
Projected returns pro-forma
-3.0% appreciation · 1.5% rent growth · sell at horizon
- IRR
- -27.4%
- Equity multiple
- 0.09×
- Total profit
- $-88,853
- Equity at exit
- $52,171
- IRR
- -32.3%
- Equity multiple
- -0.32×
- Total profit
- $-129,431
- Equity at exit
- $30,253
Cash invested: $97,972 (down + closing). Projections, not guarantees.
Landlord ↔ Tenant lean methodology
- Overall (STATE)
- 15 Strongly Tenant-Friendly
- State New York
- 15 Strongly Tenant-Friendly · D+10
- County
- — inherits STATE
- City
- — inherits STATE
ZIP-level market 10950
- Rents YoY
- 1.5%
- Active inventory
- 316
- Price-to-rent
- 10.5×
Monthly cashflow live
- Estimated rent
- $2,784 high interval (Pro) →
- Mortgage (P&I)
- −$1,835
- Tax from tax record
- −$662 /mo · $7,939/yr
- Insurance
- −$146
- HOA
- −$0
- Vacancy / Maint / Mgmt
- −$585
- Net cashflow
- $-443
Break-even live
UW: 25.0% down · 7.5% · 30yr · 1.5% tax · 5.0% vac · 8.0% maint · 8.0% mgmt
Financing live
Cash to close
- Down payment
- $87,475
- Closing costs
- $10,497
- Reserves months
- —
- Total cash needed
- —
Loan-product check · same deal, 3 products live
Conventional
25% down · 7.5% · 30yr
- Down + closing
- —
- Monthly P&I
- —
- Monthly cashflow
- —
- DSCR
- —
- Eligible?
- —
Personal DTI + credit; lowest rate.
DSCR
20% down · 8.5% · 30yr
- Down + closing
- —
- Monthly P&I
- —
- Monthly cashflow
- —
- DSCR
- —
- Eligible?
- —
No personal income docs; deal must DSCR.
Hard money
10% down · 12.0% · 12mo
- Down + closing
- —
- Monthly P&I
- —
- Monthly cashflow
- —
- DSCR
- —
- Eligible?
- —
Short-term bridge; refi at stabilization.
Rent comps 5 comps
| Address | Beds | Baths | Sqft | Rent | $/sqft | DOM | Units | Dist |
|---|---|---|---|---|---|---|---|---|
| 8 Lake Ave Monroe, NY | 2.0 | 1.5 | 1196 | $2,800 | $2.34 | 13d | 1 | 0.28mi |
| 27 Chester St Monroe, NY | 3.0 | 1.5 | 975 | $2,450 | $2.51 | 13d | 1 | 0.28mi |
| 24 Cromwell Hill Rd Monroe, NY | 1.0 | 1.0 | 900 | $1,750 | $1.94 | 23d | 1 | 0.42mi |
| 98 Ludlam Rd Monroe, NY | 3.0 | 2.0 | 1848 | $3,350 | $1.81 | 43d | 1 | 1.04mi |
| 408 Bull Mill Rd Unit 2 Chester, NY | 3.0 | 2.0 | 1800 | $3,600 | $2.00 | 23d | 1 | 1.21mi |
Listing history 17 events
-
2026-06-18days on market $349,900 Active 149 DOM
-
2026-06-17days on market $349,900 Active 148 DOM
-
2026-06-16days on market $349,900 Active 147 DOM
-
2026-06-15days on market $349,900 Active 146 DOM
-
2026-06-14days on market $349,900 Active 144 DOM
-
2026-06-10days on market $349,900 Active 141 DOM
-
2026-06-09days on market $349,900 Active 140 DOM
-
2026-06-08days on market $349,900 Active 139 DOM
-
2026-06-07days on market $349,900 Active 138 DOM
-
2026-06-05days on market $349,900 Active 135 DOM
-
2026-06-03days on market $349,900 Active 134 DOM
-
2026-06-02days on market $349,900 Active 133 DOM
-
2026-06-01days on market $349,900 Active 132 DOM
-
2026-05-31days on market $349,900 Active 131 DOM
-
2026-05-30days on market $349,900 Active 130 DOM
-
2026-01-20$349,900 Active 488-char remark
Show marketing remark (488 chars)
Welcome to 26 St. Georges Avenue, a cozy and inviting 2-bedroom, 1-bath ranch-style home nestled in a quaint Monroe neighborhood. This well-laid-out home offers comfortable single-level living and is perfect for those seeking simplicity and convenience. Enjoy being just minutes from beautiful local lakes, ideal for outdoor recreation and relaxation. The surrounding neighborhood offers a peaceful, community-oriented feel while still being close to shopping, dining, and major roadways.
-
1985-07-02soldstatus $73,000
ⓘ Source: listings_history table (triggers on properties + properties_extension) + one-shot
backfill from property_details.listing_events for pre-trigger history.
Tax reassessment forecast NY · Partial reset (capped growth)
- Current annual tax
- $7,939 · $662/mo
- Projected year-2 tax
- $7,939 · $662/mo
- Expected delta
- $0/yr ($0/mo · -0.0%)
ⓘ Screening estimate from a state-policy table — verify with the county assessor before closing.
Climate risk First Street
- Flood 1/10 Low FEMA zone X (unshaded) · 0% chance over 30 yrs
- Wildfire 3/10 Moderate
- Heat 4/10 Moderate 7 d/yr ≥96°F today · 16 d/yr by 30 yrs out
- Wind 4/10 Moderate 18% chance of damaging wind over 30 yrs
- Air quality 2/10 Low 2 unhealthy d/yr today · 2 by 30 yrs out
Nearby sold comps map
Loading sold comps map…
Walkable amenities ~0.75 mi
Loading nearby amenities…
Taxation est. · year 1
- Rental income
- $33,413
- − Mortgage interest
- −$19,600
- − Property taxes
- −$7,939
- − Insurance
- −$1,750
- − Repairs & maintenance
- −$2,673
- − Management
- −$2,673
- − Depreciation
- −$10,179
- Taxable loss
- −$11,401
- Est. tax savings @ 24.0%
- +$2,736
- After-tax cash flow
- $-2,576/yr
For passive investors: Depreciation is non-cash, so a rental often shows a tax loss while cash-flowing — sheltering income. Rental losses are passive: they offset passive income freely, and up to $25,000/yr can offset ordinary (W-2) income if you actively participate and your MAGI is under $100k (phasing out to $0 by $150k); unused losses carry forward. On sale, claimed depreciation is recaptured at up to 25%, and gains may owe capital-gains tax (a 1031 exchange can defer both). Figures are a year-1 estimate at your 24.0% rate — not tax advice; consult a CPA.
Schools (NCES district)
- District
- Monroe-Woodbury Central School District
- NCES district ID
- 3619650
- Math proficiency
- 50% ▼ -17.00%
- Reading proficiency
- 56% ▼ -1.00%
- Median HH income
- $104,681
- Composite
- 50.48/100
- National rank
- #1855
- State rank
- #250 of 590 in NY
Livability — Walton Park
- Score
- 62/100
- State rank
- #830
- US rank
- #16105
Category grades
Schools grade is shown separately in the Schools card above.
Census & demographics
- Census place
- Walton Park, NY
- County
- Orange County · 267,004 people
- Metro
- Poughkeepsie-Newburgh-Middletown, NY
- Population (ZIP)
- 68,136
- Household income
- $78,931
- Rent vs Own
- Severe rent burden
- 3149.0
Population outlook (Orange County) Hauer SSP2
- Today (2025)
- 379,830 people
- By 2030
- 378,955 · -0.2%
- By 2040
- 375,444 · -1.2%
- By 2050
- 369,311 · -2.8%
- By 2075
- 354,233 · -6.7%
- By 2100
- 318,150 · -16.2%
Race, ethnicity, and origin ACS 2023
- Neighborhood character
- Predominantly White (81%)
- Race & ethnicity
- White 81% Hispanic / Latino 12% Two or more races 6% Black 3% Asian 1%
- Hispanic origin (detail)
- Puerto Rican 5% Dominican 2%
- Common ancestry
- Romanian 3% Scandinavian 2% Italian 2%
- Foreign-born
- 11% · Canada, Dominican Republic
- Languages at home
- 33% English-only · German/W. Germanic 52% Spanish 9% Russian/Polish/Slavic 1%
Political lean MEDSL · Orange
- 2024 margin
- Lean R (+8.4) · D 45.8% · R 54.2%
- 2008→2024 swing
- -12.5pp toward R · 2008: 4.1pp · 2024: -8.4pp
- All cycles
- 2024: R+8.4 2020: R+0.2 2016: R+6.5 2012: D+5.2 2008: D+4.1
Not yet ingested
- Civics
- —
Market trends
- HPI YoY
- ▼ -309.81%
- Current HPI
- 314.2081
- Rent YoY
- ▲ 1.50%
- Metro
- Poughkeepsie-Newburgh-Middletown, NY
- State GDP YoY
- ▲ 2.60%
- F500 in state
- 92
Industry mix (Fortune 500 HQ in NY)
| Industry | F500 HQs | Revenue |
|---|---|---|
| Financial Services | 10 | $950B |
|
||
| Consumer Goods | 9 | $162B |
|
||
| Insurance | 4 | $225B |
|
||
| Telecommunications | 2 | $144B |
|
||
| Pharmaceuticals | 2 | $112B |
|
||
| Media / Entertainment | 2 | $69B |
|
||
Price history
+379.3% since first listed2 events — show timeline
- 2026-01-20 Listed $349,900 OneKey® MLS as Distributed by MLS Grid
- 1985-07-02 Sold (Public Records) $73,000 Public Records
Property tax history
+3.5%/yrLatest (2025): $7,939 · +1.3% YoY. Source: county tax records.
Cash-flow waterfall
monthlySold comps — $/sqft
last 12 mo · ≤1 miLoading sold comps…