 6-Plex
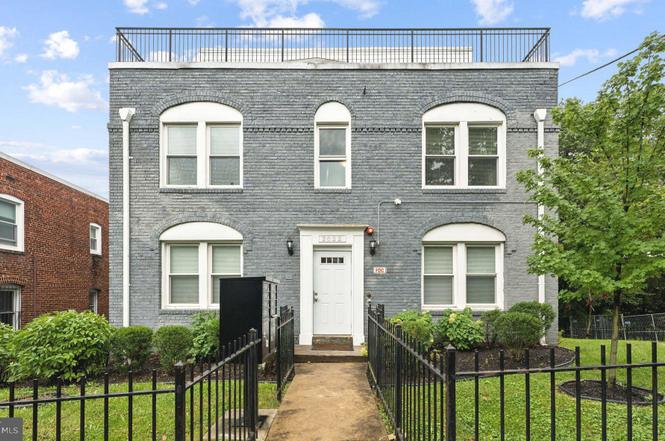
2822 28th St SE · Washington, DC
Flood risk No data
- FEMA flood zone
- —
- Chance of flooding over 30 yrs
- —
- Est. flood insurance / yr
- —
Fire risk No data
- Est. fire insurance / yr
- —
Heat risk No data
- Hot days now (above threshold)
- —
- Hot days in 30 yrs
- —
Wind risk No data
- Chance of severe wind over 30 yrs
- —
Air-quality risk No data
- Unhealthy air days now
- —
- Unhealthy air days in 30 yrs
- —
Risk factors via First Street. Map © Google.
Why this score? — see what drove the C+ grade
The composite is a weighted blend of 9 inputs, each scored 0–100. Each bar is that input's sub-score; the figure is the points it added to the 100-point composite (weight × sub-score).
- Cash flow +25.7/30.0
- DSCR +8.6/10.0
- ARV discount +7.5/15.0
- 1% rule +6.8/10.0
- Livability +3.7/5.0
- Schools +3.6/10.0
- Rent growth +3.5/5.0
- Condition / age +2.5/5.0
- Appreciation +0.0/10.0
$1,500,000
🖨 Deal sheet (PDF) 📄 Offer letter ✓ Due diligence
Multi-family units
County records classify this as Multi-Family (5+ Unit). Listing-text estimate: 6 units. confirmed
5+ unit building — per-unit beds/baths from public records are typically unavailable; the breakdown below (if shown) is an estimate from the listing text.
Listing remarks
Introducing an exceptional 6-Unit investment opportunity in Washington, DC! Welcome to 2822 28th Street, SE a charming completely renovated vacant multifamily, located in the sought-after area of Washington, DC. This well-maintained building, constructed in 1943, boasts a total of an estimated 4,856 square feet and sits on a land area of 4,481 square feet with 10 bedrooms and 6 bathrooms offering the savvy investor a lucrative opportunity with a projected cap rate of 8.11% within a market cap rate of 5%. This property presents a compelling opportunity for a new or seasoned investors seeking a stable return. The units are projected to yield an annual total income of $169,800. This property i
Key facts
- Completely renovated
- Built 1943
Tags
Property features AI
Exterior
- Home design: Multi-family property; 3-story building
- Construction: 6-unit building
- Exterior features: Deck
Interior
- Bedrooms: 10 bedrooms
- Bathrooms: 6 bathrooms
- Heating & cooling: Air conditioning
- Interior features: Washer/dryer hookup
Neighborhood map
What this means for you Summary
Snapshot
- This is a 6 × 10-bed/6.0-bath units multifamily listed at $1.50M.
Deal economics
- At list price, monthly cash flow is $4k ($43k/yr) — positive. Per door: $602/mo.
- The deal already cash-flows at list — no discount required.
- Meets the 1% rule at list price ($18k rent vs $1.50M).
- Cap rate 9.2% vs local median 2.5% in Washington — top-decile yield for the area; either an underpriced asset or a hidden risk that comps aren't pricing in. Stress-test before assuming the spread holds.
Location & tenants
- Location reads 73/100 on livability (#1 in DC) — a middle-class / working-renter tenant base. Strengths: amenities A+, commute A+, employment A+; Watch: crime F, cost of living F.
- District Of Columbia Public Schools (urban): math 33% / reading 40% proficiency, ranked #8 of 32 in DC (top 25%) — families likely to look elsewhere, expect single-tenant / working-renter base with shorter leases; 65% free/reduced lunch — lower-income household profile, screen leases tightly.
- Market conditions: Rents rising (+3.9%/yr); 296 active listings in the ZIP; 1,737 units permitted in District of Columbia in 2024 (1,506 in 5+ unit buildings).
- At $17,694/mo this rent would consume 393% of the median local household income ($54k/yr) (locally 5148% of renters already pay >50% of income on rent) — very limited rent-growth headroom before tenants either downsize or default.
Forward outlook
- Local home prices are declining (-3.0%/yr); year-one equity from $10k of loan paydown is wiped out by about $45k of value loss. Plan a longer hold.
- District of Columbia County population projected at +50% by 2050 — long-run rental-demand tailwind backs the buy-and-hold thesis.
- At projected returns (-3.0% appreciation + 3.9% rent growth), your $420k cash investment doubles in ~10 years — after that, you're playing with house money.
Negotiation context
- Only 10 days on market — expect competitive offers; lowballing is unlikely to land.
Risks & watch-outs
- Watch-outs: built in 1943 — expect roof / HVAC / electrical / plumbing capex.
Questions for the listing agent
- Can we see the unit-by-unit rent roll, current vacancy, and any below-market leases? What's the average tenancy length?
- What capital expenditures (roof, boiler, parking lot, exteriors) have been made in the last 5 years, and what's planned in the next 2?
- Built in 1943 — when were the roof, HVAC, electrical panel, plumbing, and water heater last replaced?
- Is there a deadline driving the sale (1031 exchange, divorce, estate, relocation)? That informs how much negotiation room exists.
- Crime grade is F in this area — have there been break-ins, vandalism, or insurance claims at this property in the last 3 years? What carrier currently insures it and at what premium?
- What's the average days-on-market for RENTAL listings here right now (not sales)? A rising rental-DOM trend means longer vacancies and softer asking-rent achievability than the comps imply.
- What's the recent tenant-quality profile in this submarket — average credit score on applications, eviction rate, late-payment / NSF rate, and stable-employment percentage? A property-management company in the area should have these aggregated.
- How much new apartment / multifamily construction is in the pipeline within 1–3 miles? Heavy new supply (>2% of stock underway) typically softens rents 12–24 months out; light construction supports rent growth.
Investment metrics
- 1% rule
- 1.18% ✓
- Cap rate
- 9.18%
- Cash-on-cash
- 10.32%
- DSCR
- 1.46
- GRM
- 7.1
CMA / ARV
No comps found within radius.
Projected returns pro-forma
-3.0% appreciation · 3.86% rent growth · sell at horizon
- IRR
- 0.2%
- Equity multiple
- 1.01×
- Total profit
- $2,700
- Equity at exit
- $223,655
- IRR
- 10.7%
- Equity multiple
- 1.87×
- Total profit
- $364,151
- Equity at exit
- $129,693
Cash invested: $420,000 (down + closing). Projections, not guarantees.
Landlord ↔ Tenant lean methodology
- Overall (CITY)
- 0 Strongly Tenant-Friendly
- State District of Columbia
- 12 Strongly Tenant-Friendly · D+43
- County
- — inherits STATE
- City Washington
- 0 Strongly Tenant-Friendly · D+43
ZIP-level market 20020
- Rents YoY
- 3.9%
- Active inventory
- 296
- Price-to-rent
- 42.4×
Monthly cashflow live
- Estimated rent
- $17,694 medium interval (Pro) →
- Mortgage (P&I)
- −$7,866
- Tax est. 1.5%
- −$1,875 /mo · $22,500/yr
- Insurance
- −$625
- HOA
- −$0
- Vacancy / Maint / Mgmt
- −$3,716
- Net cashflow
- $3,612
Break-even live
Sensitivity live
| Price | -10% $4,649 | -5% $4,130 | +0% $3,612 | +5% $3,094 | +10% $2,575 |
|---|---|---|---|---|---|
| Rent | -10% $2,214 | -5% $2,913 | +0% $3,612 | +5% $4,311 | +10% $5,010 |
| Rate | -1.0pp $4,367 | -0.5pp $3,994 | base $3,612 | +0.5pp $3,223 | +1.0pp $2,828 |
6-unit breakdown (identical units grouped — click to expand)
| Units | Beds | Baths | Est. rent |
|---|---|---|---|
| 6× units | 10 | 6 | $17,694 |
| #1 | 10 | 6 | $2,949 |
| #2 | 10 | 6 | $2,949 |
| #3 | 10 | 6 | $2,949 |
| #4 | 10 | 6 | $2,949 |
| #5 | 10 | 6 | $2,949 |
| #6 | 10 | 6 | $2,949 |
| Total (6 units) | $17,694 | ||
UW: 25.0% down · 7.5% · 30yr · 1.5% tax · 5.0% vac · 8.0% maint · 8.0% mgmt
Financing live
Cash to close
- Down payment
- $375,000
- Closing costs
- $45,000
- Reserves months
- —
- Total cash needed
- —
Loan-product check · same deal, 3 products live
Conventional
25% down · 7.5% · 30yr
- Down + closing
- —
- Monthly P&I
- —
- Monthly cashflow
- —
- DSCR
- —
- Eligible?
- —
Personal DTI + credit; lowest rate.
DSCR
20% down · 8.5% · 30yr
- Down + closing
- —
- Monthly P&I
- —
- Monthly cashflow
- —
- DSCR
- —
- Eligible?
- —
No personal income docs; deal must DSCR.
Hard money
10% down · 12.0% · 12mo
- Down + closing
- —
- Monthly P&I
- —
- Monthly cashflow
- —
- DSCR
- —
- Eligible?
- —
Short-term bridge; refi at stabilization.
Listing history 14 events
-
2026-06-21days on market $1,500,000 Coming Soon 10 DOM
-
2026-06-18days on market $1,500,000 Coming Soon 7 DOM
-
2026-06-17days on market $1,500,000 Coming Soon 6 DOM
-
2026-06-16days on market $1,500,000 Coming Soon 5 DOM
-
2026-06-15days on market $1,500,000 Coming Soon 4 DOM
-
2026-06-13days on market $1,500,000 Coming Soon 2 DOM
-
2026-06-09days on market $1,500,000 Coming Soon 76 DOM
-
2026-06-08days on market $1,500,000 Coming Soon 75 DOM
-
2026-06-07days on market $1,500,000 Coming Soon 74 DOM
-
2026-06-04days on market $1,500,000 Coming Soon 71 DOM
-
2026-06-03days on market $1,500,000 Coming Soon 70 DOM
-
2026-06-02days on market $1,500,000 Coming Soon 69 DOM
-
2026-06-01days on market $1,500,000 Coming Soon 68 DOM
-
2026-05-31days on market $1,500,000 Coming Soon 67 DOM
ⓘ Source: listings_history table (triggers on properties + properties_extension) + one-shot
backfill from property_details.listing_events for pre-trigger history.
Nearby sold comps map
Loading sold comps map…
Walkable amenities ~0.75 mi
Loading nearby amenities…
Taxation est. · year 1
- Rental income
- $212,328
- − Mortgage interest
- −$84,023
- − Property taxes
- −$22,500
- − Insurance
- −$7,500
- − Repairs & maintenance
- −$16,986
- − Management
- −$16,986
- − Depreciation
- −$43,636
- Taxable income
- $20,696
- Est. tax owed @ 24.0%
- −$4,967
- After-tax cash flow
- $38,378/yr
For passive investors: Depreciation is non-cash, so a rental often shows a tax loss while cash-flowing — sheltering income. Rental losses are passive: they offset passive income freely, and up to $25,000/yr can offset ordinary (W-2) income if you actively participate and your MAGI is under $100k (phasing out to $0 by $150k); unused losses carry forward. On sale, claimed depreciation is recaptured at up to 25%, and gains may owe capital-gains tax (a 1031 exchange can defer both). Figures are a year-1 estimate at your 24.0% rate — not tax advice; consult a CPA.
Schools (NCES district)
- District
- District Of Columbia Public Schools
- NCES district ID
- 1100030
- Math proficiency
- 33% ▲ 3.00%
- Reading proficiency
- 40% ▲ 5.00%
- Median HH income
- $67,671
- Composite
- 35.84/100
- National rank
- #9606
- State rank
- #8 of 32 in DC
Livability — Washington
- Score
- 73/100
- State rank
- #1
- US rank
- #5327
Category grades
Schools grade is shown separately in the Schools card above.
Census & demographics
- Census place
- Washington, DC
- County
- District of Columbia · 671,873 people
- City population
- 671,873
- Metro
- Washington-Arlington-Alexandria, DC-VA-MD-WV
- Population (ZIP)
- 53,005
- Household income
- $54,032
- Rent vs Own
- Severe rent burden
- 5148.0
Population outlook (District of Columbia County) Hauer SSP2
- Today (2025)
- 821,926 people
- By 2030
- 899,517 · +9.4%
- By 2040
- 1,061,162 · +29.1%
- By 2050
- 1,231,493 · +49.8%
- By 2075
- 1,603,312 · +95.1%
- By 2100
- 1,847,141 · +124.7%
Race, ethnicity, and origin ACS 2023
- Neighborhood character
- Predominantly Black (90%)
- Race & ethnicity
- Black 90% Two or more races 3% Hispanic / Latino 3% White 3%
- Common ancestry
- Lithuanian 1%
- Foreign-born
- 3% · Canada
- Languages at home
- 95% English-only · Spanish 2% French/Haitian/Cajun 1%
Political lean MEDSL · District of Columbia
- 2024 margin
- Solid D (+86.1) · D 91.2% · R 5.1% · Other 3.8%
- 2008→2024 swing
- +0.1pp no change · 2008: 85.9pp · 2024: 86.1pp
- All cycles
- 2024: D+86.1 2020: D+86.8 2016: D+88.7 2012: D+84.2 2008: D+85.9
Not yet ingested
- Civics
- —
Market trends
- HPI YoY
- ▼ -415.44%
- Current HPI
- 306.5068
- Rent YoY
- ▲ 3.86%
- Metro
- Washington-Arlington-Alexandria, DC-VA-MD-WV
- State GDP YoY
- ▲ 1.33%
- F500 in state
- 6
Industry mix (Fortune 500 HQ in DC)
| Industry | F500 HQs | Revenue |
|---|---|---|
| Financial Services | 1 | $153B |
|
||
| Life Sciences / Industrials | 1 | $25B |
|
||
| Industrial Machinery | 1 | $8B |
|
||
Cash-flow waterfall
monthlySold comps — $/sqft
last 12 mo · ≤1 miLoading sold comps…