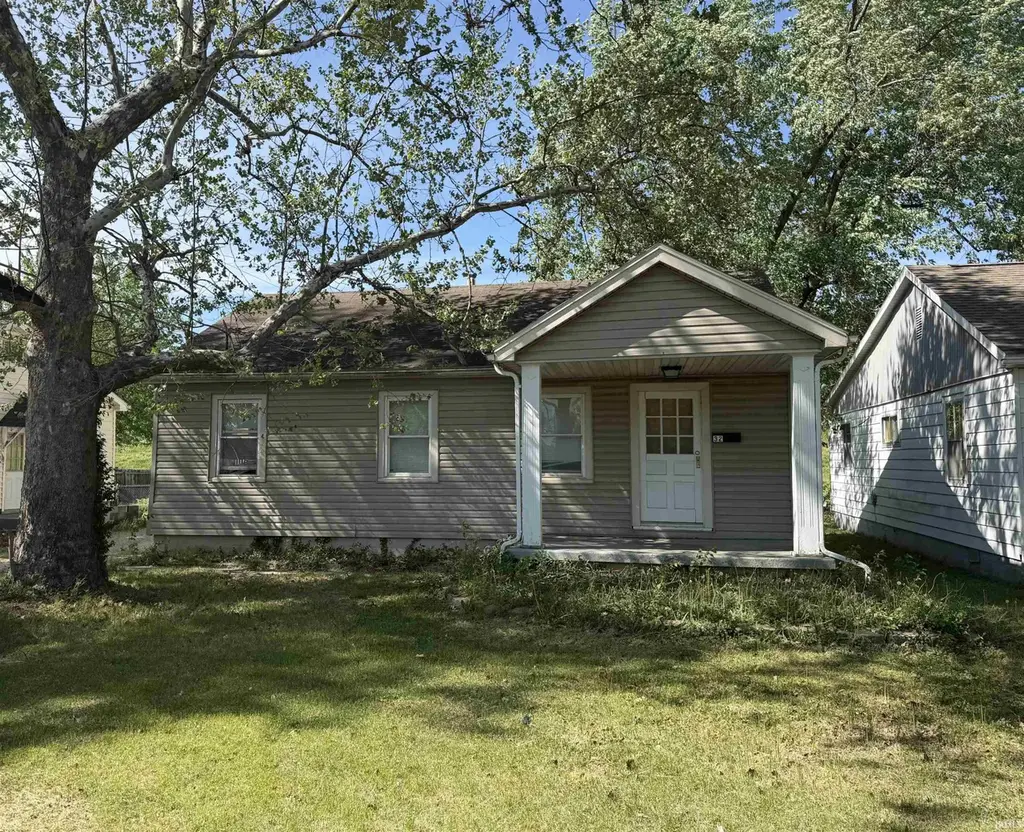
32 Tulip Ave · Evansville, IN
Flood risk 4/10 · Minor
- FEMA flood zone
- X
- Chance of flooding over 30 yrs
- 0.22%
- Est. flood insurance / yr
- $473 – $860
Fire risk 1/10 · Minimal
- Est. fire insurance / yr
- $717 – $1,331
Heat risk 5/10 · Moderate
- Hot days now (above 106°F)
- 7 days/yr
- Hot days in 30 yrs
- 19 days/yr
Wind risk 2/10 · Minimal
- Chance of severe wind over 30 yrs
- 3.0%
Air-quality risk 4/10 · Minor
- Unhealthy air days now
- 3 days/yr
- Unhealthy air days in 30 yrs
- 5 days/yr
Risk factors via First Street. Map © Google.
Why this score? — see what drove the D+ grade
The composite is a weighted blend of 9 inputs, each scored 0–100. Each bar is that input's sub-score; the figure is the points it added to the 100-point composite (weight × sub-score).
- ARV discount +15.0/15.0
- Cash flow +13.8/30.0
- DSCR +4.2/10.0
- Rent growth +4.2/5.0
- Schools +3.3/10.0
- Livability +3.2/5.0
- 1% rule +3.0/10.0
- Condition / age +2.5/5.0
- Appreciation +0.0/10.0
$109,900
🖨 Deal sheet 📄 Offer letter ✓ Due diligence
Listing remarks
This 2 bed, 1 bath home offers a covered front porch and spacious backyard. This floor plan includes a spacious living room, perfect for gathering. The living room leads to the kitchen, which includes an abundance of cabinetry. There are 2 bedrooms with access to the full bath. The large backyard is perfect for relaxing and outdoor enjoyment. This great home offers off street parking in a great location, close to shopping and dining. Home is currently tenant occupied, no longer vacant.
Key facts
- Covered front porch
- Spacious backyard
- Off street parking
Tags
Property features AI
Finance
- Other: Property listed by ERA FIRST ADVANTAGE REALTY, INC
Exterior
- Parking: Gravel parking
- Utilities: Public water; Public sewer
- Home design: Single-family residence (site-built); One-story
- Construction: Aluminum and vinyl siding; Built with conventional construction
- Exterior features: Lot dimensions approximately 50 x 130; 0.15 acre lot; Gravel parking
Interior
- Kitchen: Includes refrigerator and electric range
- Bedrooms: Total of 4 rooms (bedrooms included)
- Bathrooms: 1 full bathroom (main level)
- Heating & cooling: Natural gas forced-air heating; No cooling system
- Interior features: Refrigerator; Electric range
- Laundry & utility: Laundry located on the lower level; Full unfinished basement
Neighborhood map
What this means for you Summary
Snapshot
- This is a 2-bed/1.0-bath single-family listed at $110k.
Deal economics
- At list price, monthly cash flow is $11 ($132/yr) — positive.
- The deal already cash-flows at list — no discount required.
- To meet the 1% rule (rent ≥ 1% of price), the offer needs to be $88k (19.7% below list).
- Recommended offer: $88k (19.7% below list) — sets the bar for 1% rule.
- Cap rate 6.4% vs local median 4.6% in Evansville — top-decile yield for the area; either an underpriced asset or a hidden risk that comps aren't pricing in. Stress-test before assuming the spread holds.
Location & tenants
- Location reads 63/100 on livability (#416 in IN) — a middle-class / working-renter tenant base. Strengths: cost of living A+, housing A+, health & safety A+; Watch: crime F, commute F, employment D-.
- Evansville Vanderburgh School Corporation (urban): math 36% / reading 43% proficiency, ranked #153 of 301 in IN (top 51%) — families likely to look elsewhere, expect single-tenant / working-renter base with shorter leases.
- Zoned schools: Evans School (math 9% / reading 7%, grade F, #945 of 994 statewide, top 95%, 499 students, 85% FRL); North Junior High School (math 44% / reading 57%, grade C, #43 of 330 statewide, top 14%, 929 students, 42% FRL); North High School (math 57% / reading 74%, grade B, #29 of 369 statewide, top 8%, 1,674 students, 35% FRL) — zoned schools at 54% FRL track the district average.
- Market conditions: Rents rising fast (+6.7%/yr); 229 active listings in the ZIP; 22 comparable units currently listed for rent nearby; rentals at typical pace (median 21d on market — plan ~3-4 weeks tenant-placement turnaround); 508 units permitted in Vanderburgh County in 2024 (32 in 5+ unit buildings).
- This rent is only 16% of the median local income ($66k/yr) — well below the 30% rent-burden line; pricing power to push rent on renewal without tenant pushback.
Forward outlook
- Local home prices are declining (-3.0%/yr); year-one equity from $760 of loan paydown is wiped out by about $3k of value loss. Plan a longer hold.
Negotiation context
- It's been on market 62 days — a 6% lower offer ($103k) is reasonable based on typical stale-listing flexibility.
Risks & watch-outs
- Watch-outs: built in 1944 — expect roof / HVAC / electrical / plumbing capex.
- Climate carrying-cost: extreme-heat days projected 7→19/yr by 2055 (HVAC capex compounding) — expect insurance premiums to compound above CPI over the hold.
Questions for the listing agent
- It's been on market 62 days. Have you received any prior offers? Is the seller open to a 20% concession, seller financing, or rate buy-down credit?
- Built in 1944 — when were the roof, HVAC, electrical panel, plumbing, and water heater last replaced?
- Why hasn't it sold? Are there any deal-killer items the seller is aware of (foundation, flood, title, zoning, code violations)?
- Is there a deadline driving the sale (1031 exchange, divorce, estate, relocation)? That informs how much negotiation room exists.
- Schools are D-rated, which usually means shorter tenancies and higher turnover. Who's the typical renter profile here, and what's been the actual vacancy rate?
- Crime grade is F in this area — have there been break-ins, vandalism, or insurance claims at this property in the last 3 years? What carrier currently insures it and at what premium?
- The area grade is low — what's the realistic commute time and amenity access for the typical tenant pool here? Any planned neighborhood developments (good or bad) we should know about?
- What's the average days-on-market for RENTAL listings here right now (not sales)? A rising rental-DOM trend means longer vacancies and softer asking-rent achievability than the comps imply.
- What's the recent tenant-quality profile in this submarket — average credit score on applications, eviction rate, late-payment / NSF rate, and stable-employment percentage? A property-management company in the area should have these aggregated.
- How much new for-sale + rental construction is in the pipeline within 1–3 miles? Heavy new supply typically softens prices + rents 12–24 months out; constrained supply supports both.
Investment metrics
- 1% rule
- 0.80% ✗
- Cap rate
- 6.41%
- Cash-on-cash
- 0.43%
- DSCR
- 1.02
- GRM
- 10.4
CMA / ARV
- ARV (on-the-fly)
- $135,184
- Comps found
- 12
Show comp detail 12 sales within ~0.75 mi
| Address | Dist | Beds/Ba | Sqft | Sold | Price | $/sf | Match |
|---|---|---|---|---|---|---|---|
| 2519 N Heidelbach Ave | 0.25mi | 2/1.0 | 951 (-0%) | 6mo | $77,500 | $81 | 83 |
| 213 Van Dusen Ave | 0.18mi | 2/1.0 | 876 (-8%) | 4mo | $126,700 | $145 | 75 |
| 2501 N Lafayette Ave | 0.31mi | 2/1.0 | 888 (-7%) | 3mo | $115,000 | $130 | 72 |
| 3119 Kensington Ave | 0.39mi | 3/1.0 (+1) | 925 (-3%) | 6mo | $131,500 | $142 | 67 |
| 404 Wedeking Ave | 0.55mi | 2/1.0 | 931 (-2%) | 5mo | $170,000 | $183 | 67 |
| 2724 Edgar St | 0.56mi | 2/1.0 | 936 (-2%) | 5mo | $133,000 | $142 | 66 |
| 11 E Olmstead Ave | 0.10mi | 3/2.0 (+1) | 1,062 (+12%) | 6mo | $132,000 | $124 | 62 |
| 220 Wedeking Ave | 0.53mi | 2/1.0 | 907 (-5%) | 8mo | $135,000 | $149 | 61 |
| 728 E Parkland Ave | 0.56mi | 3/1.0 (+1) | 1,022 (+7%) | 2mo | $145,000 | $142 | 55 |
| 516 Wedeking Ave | 0.61mi | 2/1.5 | 896 (-6%) | 7mo | $120,000 | $134 | 54 |
| 424 Richardt Ave | 0.52mi | 2/1.0 | 816 (-14%) | 0mo | $123,000 | $151 | 52 |
| 719 Wedeking Ave | 0.74mi | 3/1.0 (+1) | 1,026 (+8%) | 4mo | $184,900 | $180 | 45 |
Match score weights: distance 35% · size 25% · config 20% · recency 20%. Top-matched comps best support the ARV.
Projected returns pro-forma
-3.0% appreciation · 6.72% rent growth · sell at horizon
- IRR
- -11.9%
- Equity multiple
- 0.55×
- Total profit
- $-13,716
- Equity at exit
- $16,386
- IRR
- 1.6%
- Equity multiple
- 1.13×
- Total profit
- $4,002
- Equity at exit
- $9,502
Cash invested: $30,772 (down + closing). Projections, not guarantees.
Landlord ↔ Tenant lean methodology
- Overall (STATE)
- 90 Strongly Landlord-Friendly
- State Indiana
- 90 Strongly Landlord-Friendly · R+11
- County
- — inherits STATE
- City
- — inherits STATE
ZIP-level market 47711
- Home prices YoY
- -32.3%
- Rents YoY
- 6.7%
- Active inventory
- 229
- Price-to-rent
- 10.4×
Monthly cashflow live
- Estimated rent
- $882 high interval (Pro) →
- Mortgage (P&I)
- −$576
- Tax from tax record
- −$64 /mo · $766/yr
- Insurance
- −$46
- HOA
- −$0
- Vacancy / Maint / Mgmt
- −$185
- Net cashflow
- $11
Break-even live
UW: 25.0% down · 7.5% · 30yr · 1.5% tax · 5.0% vac · 8.0% maint · 8.0% mgmt
Financing live
Cash to close
- Down payment
- $27,475
- Closing costs
- $3,297
- Reserves months
- —
- Total cash needed
- —
Loan-product check · same deal, 3 products live
Conventional
25% down · 7.5% · 30yr
- Down + closing
- —
- Monthly P&I
- —
- Monthly cashflow
- —
- DSCR
- —
- Eligible?
- —
Personal DTI + credit; lowest rate.
DSCR
20% down · 8.5% · 30yr
- Down + closing
- —
- Monthly P&I
- —
- Monthly cashflow
- —
- DSCR
- —
- Eligible?
- —
No personal income docs; deal must DSCR.
Hard money
10% down · 12.0% · 12mo
- Down + closing
- —
- Monthly P&I
- —
- Monthly cashflow
- —
- DSCR
- —
- Eligible?
- —
Short-term bridge; refi at stabilization.
Rent comps 22 comps
| Address | Beds | Baths | Sqft | Rent | $/sqft | DOM | Units | Dist |
|---|---|---|---|---|---|---|---|---|
| 500 Richardt Ave Evansville, IN | 1.0 | 1.0 | 550 | $700 | $1.27 | 20d | 1 | 0.52mi |
| 2501 N Evans Ave Unit A Evansville, IN | 2.0 | 1.0 | 856 | $900 | $1.05 | 20d | 1 | 0.63mi |
| 820 Negley Ave Unit B Evansville, IN | 1.0 | 1.0 | 575 | $695 | $1.21 | 20d | 1 | 0.65mi |
| 702 Fairway Dr Evansville, IN | 1.0–2.0 | 1.0 | 800 | $640 | $0.80 | 20d | 2 | 0.68mi |
| 941 Stanley Ave Unit A Evansville, IN | 1.0 | 1.0 | 850 | $800 | $0.94 | 20d | 1 | 0.80mi |
| 2511 N Kentucky Ave Unit 23 Evansville, IN | 1.0 | 1.0 | 584 | $650 | $1.11 | 20d | 1 | 0.86mi |
| 407 N Park Dr Unit NA Evansville, IN | 3.0 | 1.0 | 1029 | $1,600 | $1.55 | 13d | 1 | 0.96mi |
| 109 E Eichel Ave Unit A Evansville, IN | 1.0 | 1.0 | 675 | $745 | $1.10 | 20d | 1 | 0.96mi |
| 905 Vanderburgh Ave Evansville, IN | 3.0 | 1.0 | 988 | $1,200 | $1.21 | 13d | 1 | 0.97mi |
| 1008 Allens Ln Evansville, IN | 2.0 | 1.0 | 1081 | $750 | $0.69 | 20d | 1 | 0.98mi |
| 1151 Diamond Pl Evansville, IN | 1.0 | 1.0 | 700 | $780 | $1.11 | 20d | 1 | 0.99mi |
| 1111 Stanley Ave Evansville, IN | 2.0 | 1.0 | 670 | $1,000 | $1.49 | 20d | 1 | 0.99mi |
| 32 W Tennessee St Evansville, IN | 2.0 | 1.0 | 864 | $925 | $1.07 | 13d | 1 | 1.04mi |
| 1219 Joan Ave Unit 1219 Evansville, IN | 2.0 | 1.0 | 725 | $845 | $1.17 | 13d | 1 | 1.11mi |
| 1210 Vista Ct Unit 3901 Evansville, IN | 1.0 | 1.0 | 567 | $750 | $1.32 | 20d | 1 | 1.21mi |
| 1210 Vista Ct Unit 3915 Evansville, IN | 2.0 | 1.5 | 814 | $1,050 | $1.29 | 20d | 1 | 1.21mi |
| 1210 Vista Ct Unit 3959 Evansville, IN | 2.0 | 1.0 | 814 | $1,025 | $1.26 | 20d | 1 | 1.21mi |
| 1210 Vista Ct Unit 3951 Evansville, IN | 1.0 | 1.0 | 567 | $795 | $1.40 | 20d | 1 | 1.21mi |
| 1018 Baker Ave Unit B Evansville, IN | 1.0 | 1.0 | 800 | $625 | $0.78 | 20d | 1 | 1.23mi |
| 1125 Wellington Dr Evansville, IN | 1.0–2.0 | 1.0–1.5 | 975 | $1,340 | $1.37 | 13d | 15 | 1.39mi |
| 3900 N Fulton Ave Evansville, IN | 2.0 | 1.0 | 620 | $1,015 | $1.64 | 13d | 6 | 1.41mi |
| 610 N Main St Evansville, IN | 2.0 | 1.0 | 751 | $675 | $0.90 | 20d | 1 | 1.50mi |
Listing history 16 events
-
2026-06-18days on market $109,900 Active 62 DOM
-
2026-06-17days on market $109,900 Active 61 DOM
-
2026-06-16days on market $109,900 Active 60 DOM
-
2026-06-15days on market $109,900 Active 59 DOM
-
2026-06-14days on market $109,900 Active 57 DOM
-
2026-06-13days on market $109,900 Active 56 DOM
-
2026-06-10days on market $109,900 Active 54 DOM
-
2026-06-09days on market $109,900 Active 53 DOM
-
2026-06-08days on market $109,900 Active 52 DOM
-
2026-06-07pricedays on market $109,900 Active 51 DOM
-
2026-06-02days on market $119,900 Active 46 DOM
-
2026-06-01days on market $119,900 Active 45 DOM
-
2026-05-31days on market $119,900 Active 44 DOM
-
2026-05-30days on market $119,900 Active 43 DOM
-
2026-05-19price $119,900
-
2026-04-17$132,500 Active
ⓘ Source: listings_history table (triggers on properties + properties_extension) + one-shot
backfill from property_details.listing_events for pre-trigger history.
Tax reassessment forecast IN · Partial reset (capped growth)
- Current annual tax
- $766 · $64/mo
- Projected year-2 tax
- $850 · $71/mo
- Expected delta
- +$84/yr (+$7/mo · 11.0%)
ⓘ Screening estimate from a state-policy table — verify with the county assessor before closing.
Climate risk First Street
- Flood 4/10 Moderate FEMA zone X · 22% chance over 30 yrs
- Wildfire 1/10 Low
- Heat 5/10 Major 7 d/yr ≥106°F today · 19 d/yr by 30 yrs out
- Wind 2/10 Low 3% chance of damaging wind over 30 yrs
- Air quality 4/10 Moderate 3 unhealthy d/yr today · 5 by 30 yrs out
Nearby sold comps map
Loading sold comps map…
Walkable amenities ~0.75 mi
Loading nearby amenities…
Taxation est. · year 1
- Rental income
- $10,586
- − Mortgage interest
- −$6,156
- − Property taxes
- −$766
- − Insurance
- −$550
- − Repairs & maintenance
- −$847
- − Management
- −$847
- − Depreciation
- −$3,197
- Taxable loss
- −$1,776
- Est. tax savings @ 24.0%
- +$426
- After-tax cash flow
- $558/yr
For passive investors: Depreciation is non-cash, so a rental often shows a tax loss while cash-flowing — sheltering income. Rental losses are passive: they offset passive income freely, and up to $25,000/yr can offset ordinary (W-2) income if you actively participate and your MAGI is under $100k (phasing out to $0 by $150k); unused losses carry forward. On sale, claimed depreciation is recaptured at up to 25%, and gains may owe capital-gains tax (a 1031 exchange can defer both). Figures are a year-1 estimate at your 24.0% rate — not tax advice; consult a CPA.
Schools (NCES district)
- District
- Evansville Vanderburgh School Corporation
- NCES district ID
- 1803450
- Math proficiency
- 36% ▼ -7.00%
- Reading proficiency
- 43% ▼ -3.00%
- Median HH income
- $43,270
- Composite
- 33.41/100
- National rank
- #5471
- State rank
- #153 of 301 in IN
Livability — Evansville
- Score
- 63/100
- State rank
- #416
- US rank
- #15047
Category grades
Schools grade is shown separately in the Schools card above.
Census & demographics
- Census place
- Evansville, IN
- County
- Vanderburgh County · 146,793 people
- City population
- 146,793
- Metro
- Evansville, IN-KY
- Population (ZIP)
- 30,944
- Household income
- $66,320
- Rent vs Own
- Severe rent burden
- 659.0
Population outlook (Vanderburgh County) Hauer SSP2
- Today (2025)
- 187,038 people
- By 2030
- 188,907 · +1.0%
- By 2040
- 190,272 · +1.7%
- By 2050
- 188,871 · +1.0%
- By 2075
- 180,751 · -3.4%
- By 2100
- 163,015 · -12.8%
Race, ethnicity, and origin ACS 2023
- Neighborhood character
- Predominantly White (85%)
- Race & ethnicity
- White 85% Black 8% Two or more races 5% Hispanic / Latino 2%
- Common ancestry
- Lithuanian 2% Romanian 2% Slovak 1%
- Foreign-born
- 2% · Canada
- Languages at home
- 97% English-only · Spanish 2%
Political lean MEDSL · Vanderburgh
- 2024 margin
- R (+12.7) · D 43.0% · R 55.6% · Other 1.4%
- 2008→2024 swing
- -15.1pp toward R · 2008: 2.5pp · 2024: -12.7pp
- All cycles
- 2024: R+12.7 2020: R+9.6 2016: R+16.9 2012: R+10.8 2008: D+2.5
Not yet ingested
- Civics
- —
Market trends
- HPI YoY
- ▼ -97.98%
- Current HPI
- 205.62
- Rent YoY
- ▲ 6.72%
- Metro
- Evansville, IN-KY
- State GDP YoY
- ▲ 2.90%
- F500 in state
- 18
Industry mix (Fortune 500 HQ in IN)
| Industry | F500 HQs | Revenue |
|---|---|---|
| Industrial Machinery | 2 | $37B |
|
||
| Healthcare | 1 | $177B |
|
||
| Pharmaceuticals | 1 | $45B |
|
||
| Metals / Steel | 1 | $18B |
|
||
| Agriculture | 1 | $17B |
|
||
| Packaging | 1 | $12B |
|
||
Price history
-9.5% since first listed2 events — show timeline
- 2026-05-19 Price Changed $119,900 IRMLS
- 2026-04-17 Listed $132,500 IRMLS
Property tax history
-7.4%/yrLatest (2024): $766 · +8.9% YoY. Source: county tax records.
Cash-flow waterfall
monthlySold comps — $/sqft
last 12 mo · ≤1 miLoading sold comps…