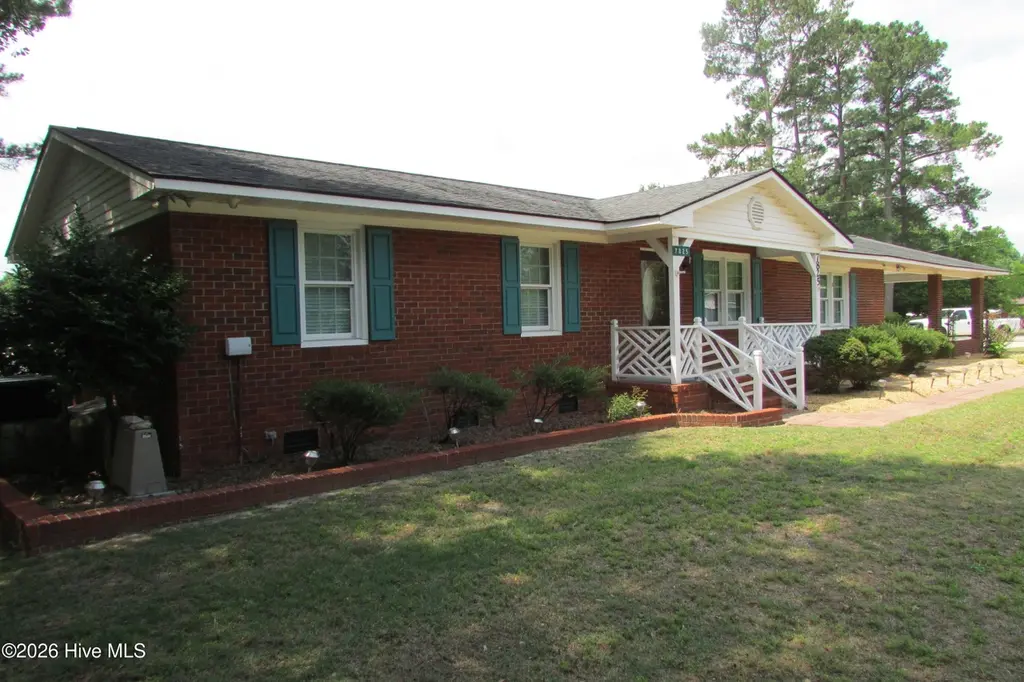
7825 Snow Hill Dr · Roseboro, NC
Flood risk 1/10 · Minimal
- FEMA flood zone
- X (unshaded)
- Chance of flooding over 30 yrs
- 0.0%
- Est. flood insurance / yr
- $507 – $1,088
Fire risk 5/10 · Moderate
- Est. fire insurance / yr
- $906 – $1,684
Heat risk 7/10 · Major
- Hot days now (above 106°F)
- 7 days/yr
- Hot days in 30 yrs
- 16 days/yr
Wind risk 8/10 · Major
- Chance of severe wind over 30 yrs
- 80.0%
Air-quality risk 1/10 · Minimal
- Unhealthy air days now
- 0 days/yr
- Unhealthy air days in 30 yrs
- 0 days/yr
Risk factors via First Street. Map © Google.
Why this score? — see what drove the C- grade
The composite is a weighted blend of 9 inputs, each scored 0–100. Each bar is that input's sub-score; the figure is the points it added to the 100-point composite (weight × sub-score).
- Cash flow +14.5/30.0
- ARV discount +11.4/15.0
- Appreciation +9.1/10.0
- DSCR +4.4/10.0
- 1% rule +3.4/10.0
- Schools +3.4/10.0
- Livability +3.1/5.0
- Rent growth +2.5/5.0
- Condition / age +2.5/5.0
$225,000
🖨 Deal sheet (PDF) 📄 Offer letter ✓ Due diligence
Listing remarks
Property features a family room addition, attached 2-car carport, primary walk-in closet, accessible ramp, irrigation system with separate meter, fenced area, and two storage buildings. HVAC replaced in 2023; water heater and septic system updated in 2022. Owned and maintained by the same family for more than 50 years. Located outside city limits.
Key facts
- Hvac replaced
- Fenced area
- Irrigation system
Tags
Property features AI
Exterior
- Parking: Attached parking (paved); Carport with 2 spaces
- Utilities: Public water; Water connected; Septic tank sewer
- Home design: Single-family residence; One story; Entry level: 1
- Construction: Brick and frame construction; Shingle roof
- Exterior features: Chain link partial fencing; No patio or porch; Has a view
Interior
- Kitchen: Electric oven; Electric range; Dishwasher; Microwave; Electric water heater
- Bedrooms: Total rooms: 7
- Bathrooms: 2 full bathrooms; 1 half bathroom
- Heating & cooling: Heat pump heating; Electric heating; Central air conditioning
- Interior features: Walk-in closets; Kitchen island; Ceiling fans; Window coverings; Accessible approach with ramp; Accessible full bath; Crawl space basement
- Laundry & utility: Dedicated laundry room
Neighborhood map
What this means for you Summary
Snapshot
- This is a 3-bed/2.5-bath single-family listed at $225k.
Deal economics
- At list price, monthly cash flow is $50 ($594/yr) — positive.
- The deal already cash-flows at list — no discount required.
- To meet the 1% rule (rent ≥ 1% of price), the offer needs to be $189k (16.0% below list).
- Recommended offer: $189k (16.0% below list) — sets the bar for 1% rule.
Location & tenants
- Location reads 62/100 on livability (#445 in NC) — a middle-class / working-renter tenant base. Strengths: cost of living A+, crime A, housing A-; Watch: amenities F, commute F, employment F.
- Sampson County Schools (rural): math 40% / reading 41% proficiency, ranked #114 of 178 in NC (top 64%) — families likely to look elsewhere, expect single-tenant / working-renter base with shorter leases; 74% free/reduced lunch — lower-income household profile, screen leases tightly.
- Zoned schools: Salemburg Elementary (math 33% / reading 31%, grade F, #908 of 1,410 statewide, top 67%, 462 students, 99% FRL); Roseboro-Salemburg Middle (math 24% / reading 32%, grade F, #360 of 475 statewide, top 77%, 406 students, 99% FRL); Lakewood High (math 72% / reading 42%, grade C, #248 of 535 statewide, top 48%, 479 students, 99% FRL) — zoned schools average 99% FRL vs 74% district-wide (26 pts higher); higher-poverty schools than district average — tighter screening recommended.
- Market conditions: 42 active listings in the ZIP; 189 units permitted in Sampson County in 2024 (0 in 5+ unit buildings).
Forward outlook
- In year one you build about $20k of equity ($2k loan paydown + $19k appreciation (8.3% local appreciation)).
- Sampson County population projected to shrink 5% by 2050 — rents likely to lag national; underwrite the cash flow, not the appreciation.
- At projected returns (8.3% appreciation + 3.0% rent growth), your $63k cash investment doubles in ~3 years — after that, you're playing with house money.
- By year 2, paydown + projected appreciation supports a ~$32k cash-out refi (75% LTV) — recoverable capital for the next deal without selling this one.
Negotiation context
- It's been on market 22 days — a 2% lower offer ($222k) is reasonable based on typical stale-listing flexibility.
- 5 sale attempts with the ask held roughly flat each time — persistent listings suggest the price (not the market) is what's stuck; bring a comps-based counter.
Risks & watch-outs
- Climate carrying-cost: severe wind risk, 80% chance of damaging wind over 30y; moderate wildfire risk; extreme-heat days projected 7→16/yr by 2055 (HVAC capex compounding) — expect insurance premiums to compound above CPI over the hold.
Questions for the listing agent
- Built in 1972 — when were the roof, HVAC, electrical panel, plumbing, and water heater last replaced?
- Is there a deadline driving the sale (1031 exchange, divorce, estate, relocation)? That informs how much negotiation room exists.
- Schools are D-rated, which usually means shorter tenancies and higher turnover. Who's the typical renter profile here, and what's been the actual vacancy rate?
- What's the average days-on-market for RENTAL listings here right now (not sales)? A rising rental-DOM trend means longer vacancies and softer asking-rent achievability than the comps imply.
- What's the recent tenant-quality profile in this submarket — average credit score on applications, eviction rate, late-payment / NSF rate, and stable-employment percentage? A property-management company in the area should have these aggregated.
- How much new for-sale + rental construction is in the pipeline within 1–3 miles? Heavy new supply typically softens prices + rents 12–24 months out; constrained supply supports both.
Investment metrics
- 1% rule
- 0.84% ✗
- Cap rate
- 6.56%
- Cash-on-cash
- 0.94%
- DSCR
- 1.04
- GRM
- 9.9
CMA / ARV
- ARV (on-the-fly)
- $246,266
- Comps found
- 1
Show comp detail 1 sale within ~0.75 mi
| Address | Dist | Beds/Ba | Sqft | Sold | Price | $/sf | Match |
|---|---|---|---|---|---|---|---|
| 211 Chesters Rd | 0.68mi | 4/2.0 (+1) | 1,966 (-6%) | 2mo | $232,000 | $118 | 50 |
Match score weights: distance 35% · size 25% · config 20% · recency 20%. Top-matched comps best support the ARV.
Projected returns pro-forma
8.27% appreciation · 3.0% rent growth · sell at horizon
- IRR
- 21.3%
- Equity multiple
- 2.58×
- Total profit
- $99,696
- Equity at exit
- $175,082
- IRR
- 19.5%
- Equity multiple
- 5.56×
- Total profit
- $287,044
- Equity at exit
- $351,564
Cash invested: $63,000 (down + closing). Projections, not guarantees.
Landlord ↔ Tenant lean methodology
- Overall (STATE)
- 85 Strongly Landlord-Friendly
- State North Carolina
- 85 Strongly Landlord-Friendly · R+3
- County
- — inherits STATE
- City
- — inherits STATE
ZIP-level market 28382
- Home prices YoY
- 3.0%
- Active inventory
- 42
- Price-to-rent
- 9.9×
Monthly cashflow live
- Estimated rent
- $1,889 medium interval (Pro) →
- Mortgage (P&I)
- −$1,180
- Tax from tax record
- −$169 /mo · $2,033/yr
- Insurance
- −$94
- HOA
- −$0
- Lot rent
- −$0
- Vacancy / Maint / Mgmt
- −$397
- Net cashflow
- $50
Break-even live
Sensitivity live
| Price | -10% $177 | -5% $113 | +0% $50 | +5% $-14 | +10% $-78 |
|---|---|---|---|---|---|
| Rent | -10% $-100 | -5% $-25 | +0% $50 | +5% $124 | +10% $199 |
| Rate | -1.0pp $163 | -0.5pp $107 | base $50 | +0.5pp $-9 | +1.0pp $-68 |
UW: 25.0% down · 7.5% · 30yr · 1.5% tax · 5.0% vac · 8.0% maint · 8.0% mgmt
Financing live
Cash to close
- Down payment
- $56,250
- Closing costs
- $6,750
- Reserves months
- —
- Total cash needed
- —
Loan-product check · same deal, 3 products live
Conventional
25% down · 7.5% · 30yr
- Down + closing
- —
- Monthly P&I
- —
- Monthly cashflow
- —
- DSCR
- —
- Eligible?
- —
Personal DTI + credit; lowest rate.
DSCR
20% down · 8.5% · 30yr
- Down + closing
- —
- Monthly P&I
- —
- Monthly cashflow
- —
- DSCR
- —
- Eligible?
- —
No personal income docs; deal must DSCR.
Hard money
10% down · 12.0% · 12mo
- Down + closing
- —
- Monthly P&I
- —
- Monthly cashflow
- —
- DSCR
- —
- Eligible?
- —
Short-term bridge; refi at stabilization.
Listing history 17 events
-
2026-06-22days on market $225,000 Active 22 DOM
-
2026-06-18days on market $225,000 Active 19 DOM
-
2026-06-17days on market $225,000 Active 18 DOM
-
2026-06-16days on market $225,000 Active 17 DOM
-
2026-06-15days on market $225,000 Active 16 DOM
-
2026-06-14days on market $225,000 Active 14 DOM
-
2026-06-13days on market $225,000 Active 13 DOM
-
2026-06-10days on market $225,000 Active 11 DOM
-
2026-06-09days on market $225,000 Active 10 DOM
-
2026-06-08days on market $225,000 Active 9 DOM
-
2026-06-07days on market $225,000 Active 8 DOM
-
2026-06-05days on market $225,000 Active 5 DOM
-
2026-06-03days on market $225,000 Active 4 DOM
-
2026-06-02days on market $225,000 Active 3 DOM
-
2026-06-01days on market $225,000 Active 2 DOM
-
2026-05-31remarks 349-char remark
-
2026-05-31$225,000 Active 1 DOM
ⓘ Source: listings_history table (triggers on properties + properties_extension) + one-shot
backfill from property_details.listing_events for pre-trigger history.
Tax reassessment forecast NC · Resets to sale price
- Current annual tax
- $2,033 · $169/mo
- Projected year-2 tax
- $2,033 · $169/mo
- Expected delta
- $0/yr ($0/mo · 0.0%)
ⓘ Screening estimate from a state-policy table — verify with the county assessor before closing.
Climate risk First Street
- Flood 1/10 Low FEMA zone X (unshaded) · 0% chance over 30 yrs
- Wildfire 5/10 Major
- Heat 7/10 Severe 7 d/yr ≥106°F today · 16 d/yr by 30 yrs out
- Wind 8/10 Severe 80% chance of damaging wind over 30 yrs
- Air quality 1/10 Low 0 unhealthy d/yr today · 0 by 30 yrs out
Nearby sold comps map
Loading sold comps map…
Walkable amenities ~0.75 mi
Loading nearby amenities…
Taxation est. · year 1
- Rental income
- $22,672
- − Mortgage interest
- −$12,603
- − Property taxes
- −$2,033
- − Insurance
- −$1,125
- − Repairs & maintenance
- −$1,814
- − Management
- −$1,814
- − Depreciation
- −$6,545
- Taxable loss
- −$3,262
- Est. tax savings @ 24.0%
- +$783
- After-tax cash flow
- $1,377/yr
For passive investors: Depreciation is non-cash, so a rental often shows a tax loss while cash-flowing — sheltering income. Rental losses are passive: they offset passive income freely, and up to $25,000/yr can offset ordinary (W-2) income if you actively participate and your MAGI is under $100k (phasing out to $0 by $150k); unused losses carry forward. On sale, claimed depreciation is recaptured at up to 25%, and gains may owe capital-gains tax (a 1031 exchange can defer both). Figures are a year-1 estimate at your 24.0% rate — not tax advice; consult a CPA.
Schools (NCES district)
- District
- Sampson County Schools
- NCES district ID
- 3704140
- Math proficiency
- 40% ▼ -6.00%
- Reading proficiency
- 41% ▼ -6.00%
- Median HH income
- $37,391
- Composite
- 33.71/100
- National rank
- #5379
- State rank
- #114 of 178 in NC
Livability — Roseboro
- Score
- 62/100
- State rank
- #445
- US rank
- #16397
Category grades
Schools grade is shown separately in the Schools card above.
Census & demographics
- Population (ZIP)
- 6,659
Population outlook (Sampson County) Hauer SSP2
- Today (2025)
- 63,499 people
- By 2030
- 62,970 · -0.8%
- By 2040
- 61,609 · -3.0%
- By 2050
- 60,462 · -4.8%
- By 2075
- 60,108 · -5.3%
- By 2100
- 62,120 · -2.2%
Race, ethnicity, and origin ACS 2023
- Neighborhood character
- Diverse neighborhood (Simpson 0.58)
- Race & ethnicity
- White 60% Black 22% Hispanic / Latino 14% Two or more races 11%
- Hispanic origin (detail)
- Mexican 2%
- Common ancestry
- Slovak 2% Romanian 1% Serbian 1%
- Foreign-born
- 9% · Canada
- Languages at home
- 87% English-only · Spanish 12% Other Asian/Pacific 1%
Political lean MEDSL · Sampson
- 2024 margin
- Strong R (+29.8) · D 34.8% · R 64.6%
- 2008→2024 swing
- -21.3pp toward R · 2008: -8.4pp · 2024: -29.8pp
- All cycles
- 2024: R+29.8 2020: R+22.5 2016: R+16.7 2012: R+11.0 2008: R+8.4
Not yet ingested
- Civics
- —
Market trends
- HPI YoY
- ▲ 8.27%
- Current HPI
- 288.151
- Rent YoY
- —
- Metro
- —
- State GDP YoY
- ▲ 3.28%
- F500 in state
- 26
Industry mix (Fortune 500 HQ in NC)
| Industry | F500 HQs | Revenue |
|---|---|---|
| Financial Services | 2 | $213B |
|
||
| Retail | 2 | $95B |
|
||
| Industrial Conglomerate | 1 | $38B |
|
||
| Metals / Steel | 1 | $35B |
|
||
| Utilities | 1 | $30B |
|
||
| Industrial Machinery | 1 | $19B |
|
||
Price history
-24.5% since first listed12 events — show timeline
- 2026-05-30 Listed $225,000 Hive MLS
- 2026-05-13 Listing Removed — Hive MLS
- 2026-02-13 Listed $259,900 Hive MLS
- 2025-12-20 Listing Removed — TMLS
- 2025-12-20 Listing Removed — Hive MLS
- 2025-11-19 Price Changed $260,000 Hive MLS
- 2025-11-19 Price Changed $260,000 TMLS
- 2025-09-02 Listed $265,000 TMLS
- 2025-09-02 Listed $265,000 Hive MLS
- 2025-07-31 Listing Removed — Hive MLS
- 2025-06-11 Price Changed $279,000 Hive MLS
- 2025-02-04 Listed $298,000 Hive MLS
Property tax history
+4.2%/yrLatest (2025): $2,033 · +9.9% YoY. Source: county tax records.
Cash-flow waterfall
monthlySold comps — $/sqft
last 12 mo · ≤1 miLoading sold comps…