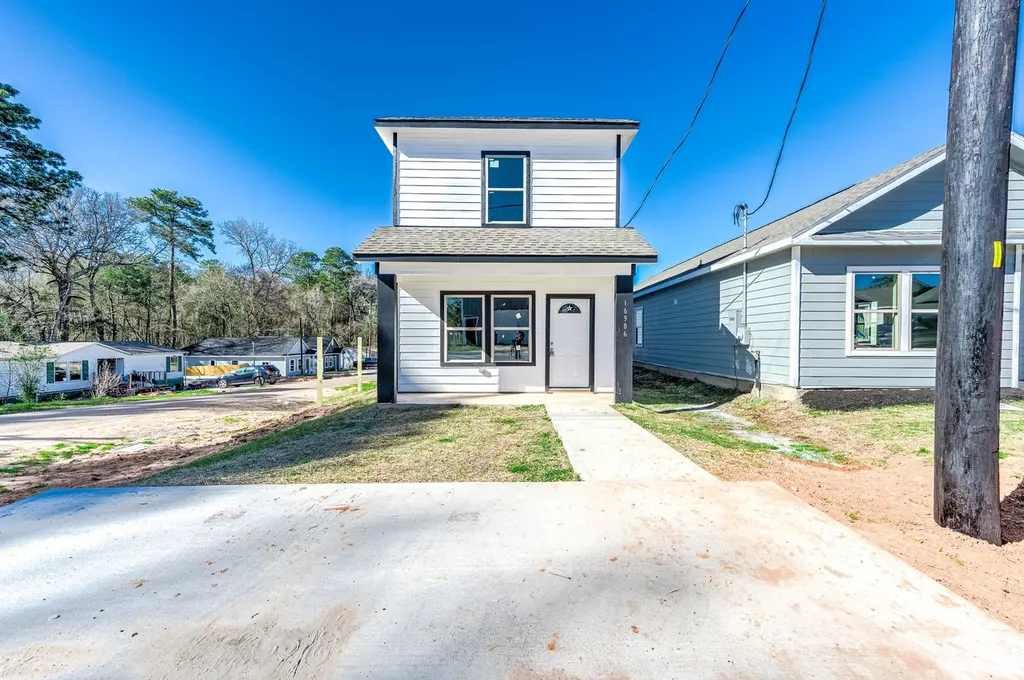
16986 W Hammon · Conroe, TX
Flood risk 1/10 · Minimal
- FEMA flood zone
- X (unshaded)
- Chance of flooding over 30 yrs
- 0.0%
- Est. flood insurance / yr
- $507 – $1,088
Fire risk 5/10 · Moderate
- Est. fire insurance / yr
- $1,222 – $2,270
Heat risk 8/10 · Major
- Hot days now (above 110°F)
- 7 days/yr
- Hot days in 30 yrs
- 22 days/yr
Wind risk 8/10 · Major
- Chance of severe wind over 30 yrs
- 99.0%
Air-quality risk 2/10 · Minimal
- Unhealthy air days now
- 1 days/yr
- Unhealthy air days in 30 yrs
- 1 days/yr
Risk factors via First Street. Map © Google.
Why this score? — see what drove the C- grade
The composite is a weighted blend of 9 inputs, each scored 0–100. Each bar is that input's sub-score; the figure is the points it added to the 100-point composite (weight × sub-score).
- Cash flow +19.3/30.0
- DSCR +6.1/10.0
- Schools +5.4/10.0
- 1% rule +5.3/10.0
- ARV discount +5.1/15.0
- Condition / age +4.0/5.0
- Livability +3.7/5.0
- Rent growth +2.6/5.0
- Appreciation +0.0/10.0
$189,500
🖨 Deal sheet (PDF) 📄 Offer letter ✓ Due diligence
Listing remarks MLS
Beautiful new construction. Great 2 story floor plan with the primary bedroom down! Contemporary style with a very functional floor plan. Very nice selection of stone accents. Flowing main floor has open living kitchen and dining areas is perfect for entertaining. Attention to detail in every corner starting in the kitchen with state of the art appliances, custom cabinetry and a sleek spacious counter top. Large windows throughout allow for plenty of natural lighting that creates an airy and inviting atmosphere! Upstairs you will find 2 bedrooms with ample closet space and a full bath. Great location close to the city of Montgomery with shopping dining and wine tasting. Also close to Lake Conroe and all the attractions and restaurants on the water! Come take a look today!
Key facts
- 2 story floor plan
- New construction
- Stone accents
Tags
Neighborhood map
What this means for you Summary
Snapshot
- This is a 3-bed/2.5-bath single-family listed at $190k. Condition is rated good.
Deal economics
- At list price, monthly cash flow is $207 ($2k/yr) — positive.
- The deal already cash-flows at list — no discount required.
- Meets the 1% rule at list price ($2k rent vs $190k).
- Recommended offer: $178k (6.0% below list) — sets the bar for market timing.
- Cap rate 7.6% vs local median 3.1% in Conroe — top-decile yield for the area; either an underpriced asset or a hidden risk that comps aren't pricing in. Stress-test before assuming the spread holds.
Location & tenants
- Location reads 74/100 on livability (#169 in TX, #4,447 nationally) — a middle-class / working-renter tenant base. Strengths: cost of living A+, housing A+, amenities B; Watch: schools D+, commute F, health & safety F.
- Montgomery ISD (rural): math 63% / reading 57% proficiency, ranked #49 of 826 in TX (top 6%) — acceptable for families but not a draw, mixed tenant base, ~2y average lease.
- Market conditions: Rents flat; 2300 active listings in the ZIP; 14 comparable units currently listed for rent nearby; rentals lingering (median 45d on market — plan ~5-8 weeks vacancy on turnover, expect pricing pressure); 79% of comp listings sitting > 30 days — soft ceiling on asking rent; high-income renter base; 13,259 units permitted in Montgomery County in 2024 (1,402 in 5+ unit buildings).
Forward outlook
- Local home prices are declining (-3.0%/yr); year-one equity from $1k of loan paydown is wiped out by about $6k of value loss. Plan a longer hold.
- Montgomery County population projected at +65% by 2050 — long-run rental-demand tailwind backs the buy-and-hold thesis.
Negotiation context
- It's been on market 90 days — a 6% lower offer ($178k) is reasonable based on typical stale-listing flexibility.
- 7 sale attempts since 2y ago with the ask held roughly flat each time — persistent listings suggest the price (not the market) is what's stuck; bring a comps-based counter.
Risks & watch-outs
- Climate carrying-cost: severe wind risk, 99% chance of damaging wind over 30y; moderate wildfire risk; extreme-heat days projected 7→22/yr by 2055 (HVAC capex compounding) — expect insurance premiums to compound above CPI over the hold.
Questions for the listing agent
- It's been on market 90 days. Have you received any prior offers? Is the seller open to a 6% concession, seller financing, or rate buy-down credit?
- What does the HOA fee cover, when was the last increase, and are there any pending special assessments or reserve-fund shortfalls?
- Why hasn't it sold? Are there any deal-killer items the seller is aware of (foundation, flood, title, zoning, code violations)?
- Is there a deadline driving the sale (1031 exchange, divorce, estate, relocation)? That informs how much negotiation room exists.
- Schools are D-rated, which usually means shorter tenancies and higher turnover. Who's the typical renter profile here, and what's been the actual vacancy rate?
- What's the average days-on-market for RENTAL listings here right now (not sales)? A rising rental-DOM trend means longer vacancies and softer asking-rent achievability than the comps imply.
- What's the recent tenant-quality profile in this submarket — average credit score on applications, eviction rate, late-payment / NSF rate, and stable-employment percentage? A property-management company in the area should have these aggregated.
- How much new for-sale + rental construction is in the pipeline within 1–3 miles? Heavy new supply typically softens prices + rents 12–24 months out; constrained supply supports both.
Investment metrics
- 1% rule
- 1.03% ✓
- Cap rate
- 7.60%
- Cash-on-cash
- 4.68%
- DSCR
- 1.21
- GRM
- 8.1
CMA / ARV
- ARV (median comp)
- $179,880
- List price
- $189,500
- Delta
- 5.35%
- Verdict
- FAIR
- Comps
- 20 within 1.0 mi
Show comp detail 12 sales within ~0.75 mi
| Address | Dist | Beds/Ba | Sqft | Sold | Price | $/sf | Match |
|---|---|---|---|---|---|---|---|
| 16884 Kempwood | 0.18mi | 3/2.5 | 1,360 (-6%) | 3mo | $164,900 | $121 | 79 |
| 16774 Meadowcroft | 0.30mi | 3/3.0 | 1,423 (-2%) | 2mo | $209,900 | $148 | 79 |
| 16770 Meadowcroft St | 0.30mi | 3/3.0 | 1,423 (-2%) | 6mo | $214,900 | $151 | 76 |
| 16916 Kempwood | 0.15mi | 3/2.0 | 1,400 (-3%) | 15mo | $189,999 | $136 | 73 |
| 16710 E Forrestal | 0.29mi | 3/2.5 | 1,360 (-6%) | 4mo | $169,000 | $124 | 73 |
| 914 Timberglen Ct | 0.38mi | 3/3.0 | 1,423 (-2%) | 12mo | $215,900 | $152 | 68 |
| 1557 Chapparal Rd | 0.25mi | 3/1.0 | 1,500 (+3%) | 15mo | $235,000 | $157 | 64 |
| 16778 Meadowcroft St | 0.31mi | 4/2.5 (+1) | 1,565 (+8%) | 7mo | $232,900 | $149 | 62 |
| 16362 Eastchase St | 0.49mi | 3/2.5 | 1,360 (-6%) | 8mo | $175,000 | $129 | 61 |
| 16366 Eastchase St | 0.47mi | 3/2.5 | 1,360 (-6%) | 11mo | $182,000 | $134 | 59 |
| 1607 E Pine Lake Cir E | 0.14mi | 2/1.0 (-1) | 1,284 (-11%) | 11mo | $178,888 | $139 | 54 |
| 16689 E Hammon | 0.30mi | 4/2.5 (+1) | 1,286 (-11%) | 13mo | $175,000 | $136 | 51 |
Match score weights: distance 35% · size 25% · config 20% · recency 20%. Top-matched comps best support the ARV.
Projected returns pro-forma
-3.0% appreciation · 0.4% rent growth · sell at horizon
- IRR
- -12.0%
- Equity multiple
- 0.58×
- Total profit
- $-22,469
- Equity at exit
- $28,255
- IRR
- -7.4%
- Equity multiple
- 0.59×
- Total profit
- $-21,856
- Equity at exit
- $16,384
Cash invested: $53,060 (down + closing). Projections, not guarantees.
Landlord ↔ Tenant lean methodology
- Overall (STATE)
- 87 Strongly Landlord-Friendly
- State Texas
- 87 Strongly Landlord-Friendly · R+5
- County
- — inherits STATE
- City
- — inherits STATE
ZIP-level market 77316
- Home prices YoY
- -10.7%
- Rents YoY
- 0.4%
- Active inventory
- 2300
- Price-to-rent
- 8.1×
Monthly cashflow live
- Estimated rent
- $1,960 high interval (Pro) →
- Mortgage (P&I)
- −$994
- Tax est. 1.5%
- −$237 /mo · $2,842/yr
- Insurance
- −$79
- HOA
- −$32
- Vacancy / Maint / Mgmt
- −$412
- Net cashflow
- $207
Break-even live
Sensitivity live
| Price | -10% $338 | -5% $273 | +0% $207 | +5% $142 | +10% $76 |
|---|---|---|---|---|---|
| Rent | -10% $52 | -5% $130 | +0% $207 | +5% $284 | +10% $362 |
| Rate | -1.0pp $302 | -0.5pp $255 | base $207 | +0.5pp $158 | +1.0pp $108 |
UW: 25.0% down · 7.5% · 30yr · 1.5% tax · 5.0% vac · 8.0% maint · 8.0% mgmt
Financing live
Cash to close
- Down payment
- $47,375
- Closing costs
- $5,685
- Reserves months
- —
- Total cash needed
- —
Loan-product check · same deal, 3 products live
Conventional
25% down · 7.5% · 30yr
- Down + closing
- —
- Monthly P&I
- —
- Monthly cashflow
- —
- DSCR
- —
- Eligible?
- —
Personal DTI + credit; lowest rate.
DSCR
20% down · 8.5% · 30yr
- Down + closing
- —
- Monthly P&I
- —
- Monthly cashflow
- —
- DSCR
- —
- Eligible?
- —
No personal income docs; deal must DSCR.
Hard money
10% down · 12.0% · 12mo
- Down + closing
- —
- Monthly P&I
- —
- Monthly cashflow
- —
- DSCR
- —
- Eligible?
- —
Short-term bridge; refi at stabilization.
Rent comps 14 comps
| Address | Beds | Baths | Sqft | Rent | $/sqft | DOM | Units | Dist |
|---|---|---|---|---|---|---|---|---|
| 16913 Glenheath Montgomery, TX | 4.0 | 2.5 | 1700 | $1,571 | $0.92 | 44d | 1 | 0.07mi |
| 16967 W Ivanhoe Montgomery, TX | 3.0 | 2.0 | 1012 | $1,350 | $1.33 | 13d | 1 | 0.08mi |
| 16984 W Juneau Montgomery, TX | 3.0 | 3.0 | 1530 | $2,900 | $1.90 | 44d | 1 | 0.09mi |
| 16928 Kempwood Montgomery, TX | 3.0 | 2.0 | 1100 | $1,450 | $1.32 | 44d | 1 | 0.14mi |
| 16915 Balmoral Montgomery, TX | 3.0 | 2.0 | 1200 | $1,200 | $1.00 | 44d | 1 | 0.14mi |
| 1050 S Pine Lake Rd Montgomery, TX | 2.0 | 2.0 | 1052 | $1,845 | $1.75 | 25d | 1 | 0.48mi |
| 275 Pine Terrace Dr Unit 5106C Montgomery, TX | 3.0 | 2.5 | 1773 | $2,820 | $1.59 | 44d | 1 | 0.78mi |
| 15 April Vlg Montgomery, TX | 2.0 | 2.0 | 1218 | $1,650 | $1.35 | 44d | 1 | 0.83mi |
| 298 Capetown Way Unit A Montgomery, TX | 2.0 | 1.5 | 1100 | $1,400 | $1.27 | 44d | 1 | 0.92mi |
| 130 April Point Dr N Montgomery, TX | 3.0 | 3.0 | 1680 | $2,250 | $1.34 | 44d | 1 | 1.05mi |
| 135 April Point Dr N Montgomery, TX | 3.0 | 3.0 | 1624 | $1,900 | $1.17 | 44d | 1 | 1.06mi |
| 124 April Point Dr N Montgomery, TX | 4.0 | 3.0 | 1624 | $2,900 | $1.79 | 44d | 1 | 1.07mi |
| 124 April Point Dr S #124 Montgomery, TX | 2.0 | 1.0 | 1300 | $1,490 | $1.15 | 21d | 1 | 1.23mi |
| 702 Crystal River Rd Montgomery, TX | 4.0 | 2.5 | 1820 | $4,000 | $2.20 | 44d | 1 | 1.45mi |
HOA detail
- Monthly dues
- $32 · $384/yr
- Likely covers
- water
Listing history 29 events
-
2026-06-21days on market $189,500 Active 90 DOM
-
2026-06-18days on market $189,500 Active 87 DOM
-
2026-06-17days on market $189,500 Active 86 DOM
-
2026-06-16days on market $189,500 Active 85 DOM
-
2026-06-15days on market $189,500 Active 84 DOM
-
2026-06-13days on market $189,500 Active 82 DOM
-
2026-06-13days on market $189,500 Active 81 DOM
-
2026-06-09days on market $189,500 Active 78 DOM
-
2026-06-08days on market $189,500 Active 77 DOM
-
2026-06-07days on market $189,500 Active 76 DOM
-
2026-06-04days on market $189,500 Active 73 DOM
-
2026-06-03days on market $189,500 Active 72 DOM
-
2026-06-02days on market $189,500 Active 71 DOM
-
2026-06-01days on market $189,500 Active 70 DOM
-
2026-05-31days on market $189,500 Active 69 DOM
-
2026-03-23$189,500 Active 782-char remark
Show marketing remark (782 chars)
Beautiful new construction. Great 2 story floor plan with the primary bedroom down! Contemporary style with a very functional floor plan. Very nice selection of stone accents. Flowing main floor has open living kitchen and dining areas is perfect for entertaining. Attention to detail in every corner starting in the kitchen with state of the art appliances, custom cabinetry and a sleek spacious counter top. Large windows throughout allow for plenty of natural lighting that creates an airy and inviting atmosphere! Upstairs you will find 2 bedrooms with ample closet space and a full bath. Great location close to the city of Montgomery with shopping dining and wine tasting. Also close to Lake Conroe and all the attractions and restaurants on the water! Come take a look today!
-
2026-03-19historical
-
2025-10-13historical
-
2025-10-13$196,000 Active
-
2025-09-03price $196,000
-
2025-07-27$199,500 Active
-
2025-07-27historical
-
2025-03-01$207,770 Active
-
2025-02-28historical
-
2024-11-13$207,770 Active
-
2024-10-27historical
-
2024-06-20$211,000 Active
-
2024-06-19historical
-
2024-02-28$211,000 Active
ⓘ Source: listings_history table (triggers on properties + properties_extension) + one-shot
backfill from property_details.listing_events for pre-trigger history.
Climate risk First Street
- Flood 1/10 Low FEMA zone X (unshaded) · 0% chance over 30 yrs
- Wildfire 5/10 Major
- Heat 8/10 Severe 7 d/yr ≥110°F today · 22 d/yr by 30 yrs out
- Wind 8/10 Severe 99% chance of damaging wind over 30 yrs
- Air quality 2/10 Low 1 unhealthy d/yr today · 1 by 30 yrs out
Nearby sold comps map
Loading sold comps map…
Walkable amenities ~0.75 mi
Loading nearby amenities…
Taxation est. · year 1
- Rental income
- $23,524
- − Mortgage interest
- −$10,615
- − Property taxes
- −$2,842
- − Insurance
- −$948
- − Repairs & maintenance
- −$1,882
- − Management
- −$1,882
- − HOA
- −$384
- − Depreciation
- −$5,513
- Taxable loss
- −$542
- Est. tax savings @ 24.0%
- +$130
- After-tax cash flow
- $2,615/yr
For passive investors: Depreciation is non-cash, so a rental often shows a tax loss while cash-flowing — sheltering income. Rental losses are passive: they offset passive income freely, and up to $25,000/yr can offset ordinary (W-2) income if you actively participate and your MAGI is under $100k (phasing out to $0 by $150k); unused losses carry forward. On sale, claimed depreciation is recaptured at up to 25%, and gains may owe capital-gains tax (a 1031 exchange can defer both). Figures are a year-1 estimate at your 24.0% rate — not tax advice; consult a CPA.
Condition & rehab AI · 6 photos
This new construction home is in excellent condition with a good condition score of 80. It features a modern kitchen, two bathrooms, and a well-maintained exterior. The home is move-in ready and would benefit from some minor updates to increase its value.
Value-add opportunities
- Both Paint interior walls — Fresh paint can enhance the home's curb appeal and interior aesthetics.
- Both Install smart home devices — Smart home devices can increase convenience and add value for both buyers and renters.
- Both Add outdoor lighting — Outdoor lighting can improve safety and enhance the home's curb appeal at night.
Renovation cost estimate screening
Value-add ROI direction
- Both Paint interior walls — Fresh paint can enhance the home's curb appeal and interior aesthetics. ↑
- Both Install smart home devices — Smart home devices can increase convenience and add value for both buyers and renters. ↑
- Both Add outdoor lighting — Outdoor lighting can improve safety and enhance the home's curb appeal at night. ↑
ⓘ Cost ranges are severity-bucket heuristics (US national rule-of-thumb). Get contractor quotes + a written scope before underwriting a rehab budget.
Schools (NCES district)
- District
- Montgomery ISD
- NCES district ID
- 4831260
- Math proficiency
- 63% ▼ -3.00%
- Reading proficiency
- 57% ▼ -3.00%
- Median HH income
- $75,596
- Composite
- 53.55/100
- National rank
- #1445
- State rank
- #49 of 826 in TX
Livability — Conroe
- Score
- 74/100
- State rank
- #169
- US rank
- #4447
Category grades
Schools grade is shown separately in the Schools card above.
Census & demographics
- County
- Montgomery County · 663,713 people
- City population
- 205,417
- Metro
- Houston-The Woodlands-Sugar Land, TX
- Population (ZIP)
- 34,694
- Household income
- $124,055
- Rent vs Own
- Severe rent burden
- 273.0
Population outlook (Montgomery County) Hauer SSP2
- Today (2025)
- 713,896 people
- By 2030
- 805,263 · +12.8%
- By 2040
- 992,708 · +39.1%
- By 2050
- 1,179,590 · +65.2%
- By 2075
- 1,628,084 · +128.1%
- By 2100
- 1,937,880 · +171.5%
Race, ethnicity, and origin ACS 2023
- Neighborhood character
- Predominantly White (80%)
- Race & ethnicity
- White 80% Hispanic / Latino 14% Two or more races 11% Black 1% Asian 1%
- Hispanic origin (detail)
- Mexican 9%
- Common ancestry
- Lithuanian 6% Slovak 3% Romanian 3%
- Foreign-born
- 6% · Canada
- Languages at home
- 90% English-only · Spanish 8%
Political lean MEDSL · Montgomery
- 2024 margin
- Solid R (+45.5) · D 26.8% · R 72.3%
- 2008→2024 swing
- +7.2pp toward D · 2008: -52.7pp · 2024: -45.5pp
- All cycles
- 2024: R+45.5 2020: R+43.8 2016: R+51.4 2012: R+60.7 2008: R+52.7
Not yet ingested
- Civics
- —
Market trends
- HPI YoY
- ▼ -31.44%
- Current HPI
- 262.6973
- Rent YoY
- ▲ 0.40%
- Metro
- Houston-The Woodlands-Sugar Land, TX
- State GDP YoY
- ▲ 3.95%
- F500 in state
- 110
Industry mix (Fortune 500 HQ in TX)
| Industry | F500 HQs | Revenue |
|---|---|---|
| Energy | 16 | $1,198B |
|
||
| Technology | 5 | $198B |
|
||
| Engineering / Construction | 4 | $72B |
|
||
| Energy Services | 3 | $60B |
|
||
| Utilities | 3 | $41B |
|
||
| Healthcare | 2 | $330B |
|
||
Price history
-10.2% since first listed14 events — show timeline
- 2026-03-23 Listed $189,500 HARMLS
- 2026-03-19 Listing Removed — HARMLS
- 2025-10-13 Listing Removed — HARMLS
- 2025-10-13 Listed $196,000 HARMLS
- 2025-09-03 Price Changed $196,000 HARMLS
- 2025-07-27 Listing Removed — HARMLS
- 2025-07-27 Listed $199,500 HARMLS
- 2025-03-01 Listed $207,770 HARMLS
- 2025-02-28 Listing Removed — HARMLS
- 2024-11-13 Listed $207,770 HARMLS
- 2024-10-27 Listing Removed — HARMLS
- 2024-06-20 Listed $211,000 HARMLS
- 2024-06-19 Listing Removed — HARMLS
- 2024-02-28 Listed $211,000 HARMLS
Cash-flow waterfall
monthlySold comps — $/sqft
last 12 mo · ≤1 miLoading sold comps…