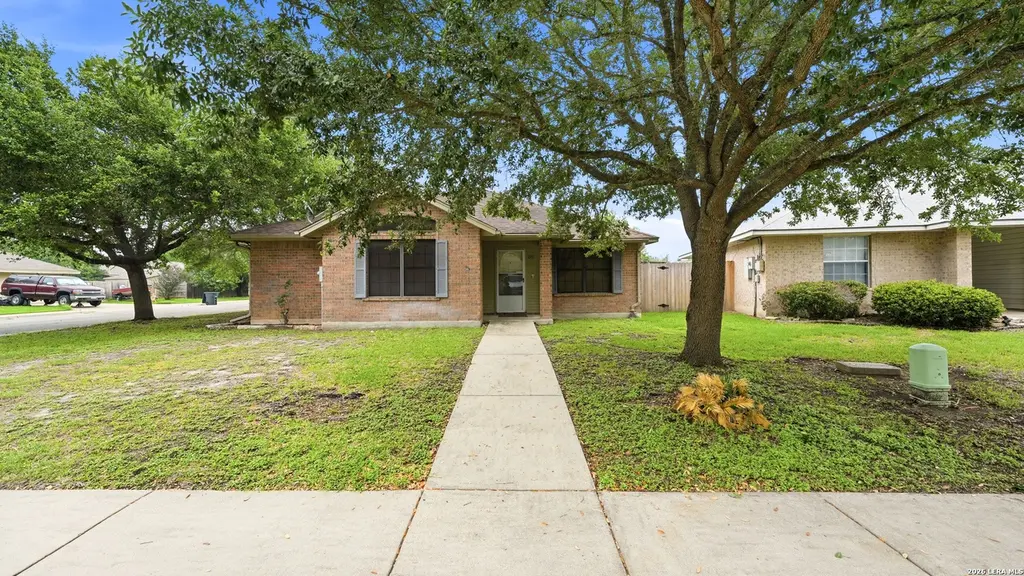
1571 Kimberly Dawn Dr · New Braunfels, TX
Flood risk 6/10 · Moderate
- FEMA flood zone
- X (unshaded)
- Chance of flooding over 30 yrs
- 0.7%
- Est. flood insurance / yr
- $507 – $1,088
Fire risk 4/10 · Minor
- Est. fire insurance / yr
- $1,222 – $2,270
Heat risk 8/10 · Major
- Hot days now (above 108°F)
- 7 days/yr
- Hot days in 30 yrs
- 23 days/yr
Wind risk 8/10 · Major
- Chance of severe wind over 30 yrs
- 80.0%
Air-quality risk 1/10 · Minimal
- Unhealthy air days now
- 0 days/yr
- Unhealthy air days in 30 yrs
- 0 days/yr
Risk factors via First Street. Map © Google.
Why this score? — see what drove the D grade
The composite is a weighted blend of 9 inputs, each scored 0–100. Each bar is that input's sub-score; the figure is the points it added to the 100-point composite (weight × sub-score).
- ARV discount +15.0/15.0
- Cash flow +8.1/30.0
- Schools +4.4/10.0
- Livability +4.2/5.0
- 1% rule +2.9/10.0
- Condition / age +2.5/5.0
- DSCR +2.1/10.0
- Rent growth +2.0/5.0
- Appreciation +0.0/10.0
$235,000
🖨 Deal sheet (PDF) 📄 Offer letter ✓ Due diligence
Listing remarks
This corner lot home is nestled in a quiet community with no HOA! Home features 3 bedrooms and 2 full baths. Primary bedroom has walk in closest and dual vanity in the bathroom. Secondary bathroom is Jack and Jill style with 2 vanities. Amongst the mature trees there is a low maintenance yard with a 12x16 shed and ample parking with side entry garage. Located within minutes to I-35, shopping and schools. A quick walk and you can be at Kraft Park and the County Line Memorial Walking trail. This home is a must see!
Key facts
- Side entry garage
- 12x16 shed
- Low maintenance yard
Tags
Property features AI
Finance
- HOA & community: Subdivision: Rolling Valley (ROLLING VALLEY 9)
Exterior
- Parking: 2-car garage
- Utilities: City water and sewer
- Home design: Pre-owned single-family home; Approximately 25 years old
- Construction: Composition roof; Slab foundation
- Exterior features: Brick and cement fiber exterior
Interior
- Kitchen: Kitchen (12 x 11); Refrigerator; Dishwasher
- Bedrooms: Master bedroom (16 x 12) with full bath; Bedroom 2 (12 x 11); Bedroom 3 (14 x 12)
- Flooring: Carpeting; Linoleum flooring
- Bathrooms: Two full bathrooms; Master bath (10 x 8) with shower-only layout
- Heating & cooling: Central heating (electric); Central air conditioning
- Interior features: Ceiling fans throughout; All window coverings remain; One living area
- Laundry & utility: Washer and dryer included; Electric hot water heater
Neighborhood map
What this means for you Summary
Snapshot
- This is a 3-bed/2.0-bath single-family listed at $235k.
Deal economics
- At list price, monthly cash flow is $-234 ($-3k/yr) — negative.
- To cash-flow at today's rent, offer at most $194k (17.6% below list).
- To meet the 1% rule (rent ≥ 1% of price), the offer needs to be $185k (21.5% below list).
- Recommended offer: $185k (21.5% below list) — sets the bar for 1% rule.
- Cap rate 5.1% vs local median 3.3% in New Braunfels — top-decile yield for the area; either an underpriced asset or a hidden risk that comps aren't pricing in. Stress-test before assuming the spread holds.
Location & tenants
- Location reads 83/100 on livability (#9 in TX, #925 nationally) — a professional / high-income tenant draw. Strengths: amenities A+, housing A+, health & safety A+; Watch: commute F.
- New Braunfels ISD (urban): math 47% / reading 53% proficiency, ranked #157 of 826 in TX (top 19%) — acceptable for families but not a draw, mixed tenant base, ~2y average lease.
- Zoned schools: Walnut Springs El (math 42% / reading 42%, grade F, #1,335 of 4,322 statewide, top 33%, 312 students, 45% FRL); New Braunfels Middle (math 44% / reading 46%, grade D, #479 of 1,662 statewide, top 29%, 1,301 students, 44% FRL); New Braunfels H S (math 53% / reading 10%, grade F, #1,073 of 1,632 statewide, top 66%, 1,926 students, 32% FRL) — zoned schools at 41% FRL track the district average.
- Market conditions: Rents soft (-2.0%/yr); 1931 active listings in the ZIP; 40 comparable units currently listed for rent nearby; rentals at typical pace (median 19d on market — plan ~3-4 weeks tenant-placement turnaround); solid renter incomes; 3,420 units permitted in Comal County in 2024 (1,164 in 5+ unit buildings).
Forward outlook
- Local home prices are declining (-3.0%/yr); year-one equity from $2k of loan paydown is wiped out by about $7k of value loss. Plan a longer hold.
- Comal County population projected at +70% by 2050 — long-run rental-demand tailwind backs the buy-and-hold thesis.
Negotiation context
- It's been on market 50 days — a 3% lower offer ($228k) is reasonable based on typical stale-listing flexibility.
- 6 sale attempts since 5y ago; this cycle's ask has dropped $15k (6%) from the opening price — seller is motivated, your offer sets the floor, not the list.
Risks & watch-outs
- Climate carrying-cost: major flood risk; severe wind risk, 80% chance of damaging wind over 30y; extreme-heat days projected 7→23/yr by 2055 (HVAC capex compounding) — expect insurance premiums to compound above CPI over the hold.
Questions for the listing agent
- What do current leases actually rent for vs. the listed asking? Can we see a recent rent roll and the last 12 months of T-12 income?
- It's been on market 50 days. Have you received any prior offers? Is the seller open to a 21% concession, seller financing, or rate buy-down credit?
- Is there a deadline driving the sale (1031 exchange, divorce, estate, relocation)? That informs how much negotiation room exists.
- Schools are B-rated — typically a magnet for longer-tenancy family renters. What's the average tenant stay here, and is there a school-zone premium baked into asking?
- The area grade is low — what's the realistic commute time and amenity access for the typical tenant pool here? Any planned neighborhood developments (good or bad) we should know about?
- What's the average days-on-market for RENTAL listings here right now (not sales)? A rising rental-DOM trend means longer vacancies and softer asking-rent achievability than the comps imply.
- What's the recent tenant-quality profile in this submarket — average credit score on applications, eviction rate, late-payment / NSF rate, and stable-employment percentage? A property-management company in the area should have these aggregated.
- How much new for-sale + rental construction is in the pipeline within 1–3 miles? Heavy new supply typically softens prices + rents 12–24 months out; constrained supply supports both.
Investment metrics
- 1% rule
- 0.79% ✗
- Cap rate
- 5.10%
- Cash-on-cash
- -4.27%
- DSCR
- 0.81
- GRM
- 10.6
CMA / ARV
- ARV (median comp)
- $281,965
- List price
- $235,000
- Delta
- -16.66%
- Verdict
- UNDERPRICED
- Comps
- 20 within 1.0 mi
Show comp detail 12 sales within ~0.75 mi
| Address | Dist | Beds/Ba | Sqft | Sold | Price | $/sf | Match |
|---|---|---|---|---|---|---|---|
| 2026 Dripping Spgs | 0.34mi | 3/2.0 | 1,774 (+5%) | 1mo | $355,000 | $200 | 75 |
| 1183 Legacy | 0.42mi | 3/2.0 | 1,630 (-3%) | 0mo | $325,000 | $199 | 74 |
| 1436 Devin Dr | 0.20mi | 3/2.0 | 1,845 (+9%) | 1mo | $349,000 | $189 | 74 |
| 1691 Dustin Cade | 0.20mi | 3/2.0 | 1,498 (-11%) | 2mo | $239,900 | $160 | 70 |
| 1116 Camellia | 0.63mi | 3/2.0 | 1,679 (-0%) | 2mo | $375,000 | $223 | 68 |
| 1982 Palace Dr | 0.45mi | 3/2.0 | 1,802 (+7%) | 3mo | $355,000 | $197 | 65 |
| 1812 Park Pl | 0.51mi | 3/2.0 | 1,550 (-8%) | 2mo | $345,000 | $223 | 61 |
| 1922 Shield | 0.62mi | 3/2.0 | 1,831 (+8%) | 3mo | $435,000 | $238 | 55 |
| 1505 Marigold Dr | 0.63mi | 3/2.0 | 1,516 (-10%) | 1mo | $374,791 | $247 | 53 |
| 2128 Stonecrest | 0.61mi | 3/2.0 | 1,874 (+11%) | 3mo | $260,000 | $139 | 50 |
| 2120 Stonecrest | 0.59mi | 3/2.0 | 1,462 (-13%) | 2mo | $285,000 | $195 | 48 |
| 1764 Lower Forty | 0.64mi | 4/2.0 (+1) | 1,837 (+9%) | 4mo | $315,000 | $171 | 48 |
Match score weights: distance 35% · size 25% · config 20% · recency 20%. Top-matched comps best support the ARV.
Projected returns pro-forma
-3.0% appreciation · 0.0% rent growth · sell at horizon
- IRR
- -27.0%
- Equity multiple
- 0.11×
- Total profit
- $-58,322
- Equity at exit
- $35,039
- IRR
- -41.0%
- Equity multiple
- -0.38×
- Total profit
- $-90,595
- Equity at exit
- $20,319
Cash invested: $65,800 (down + closing). Projections, not guarantees.
Landlord ↔ Tenant lean methodology
- Overall (STATE)
- 87 Strongly Landlord-Friendly
- State Texas
- 87 Strongly Landlord-Friendly · R+5
- County
- — inherits STATE
- City
- — inherits STATE
ZIP-level market 78130
- Rents YoY
- -2.0%
- Active inventory
- 1931
- Price-to-rent
- 10.6×
Monthly cashflow live
- Estimated rent
- $1,846 high interval (Pro) →
- Mortgage (P&I)
- −$1,232
- Tax from tax record
- −$362 /mo · $4,341/yr
- Insurance
- −$98
- HOA
- −$0
- Vacancy / Maint / Mgmt
- −$388
- Net cashflow
- $-234
Break-even live
Sensitivity live
| Price | -10% $-101 | -5% $-167 | +0% $-234 | +5% $-301 | +10% $-367 |
|---|---|---|---|---|---|
| Rent | -10% $-380 | -5% $-307 | +0% $-234 | +5% $-161 | +10% $-88 |
| Rate | -1.0pp $-116 | -0.5pp $-174 | base $-234 | +0.5pp $-295 | +1.0pp $-357 |
UW: 25.0% down · 7.5% · 30yr · 1.5% tax · 5.0% vac · 8.0% maint · 8.0% mgmt
Financing live
Cash to close
- Down payment
- $58,750
- Closing costs
- $7,050
- Reserves months
- —
- Total cash needed
- —
Loan-product check · same deal, 3 products live
Conventional
25% down · 7.5% · 30yr
- Down + closing
- —
- Monthly P&I
- —
- Monthly cashflow
- —
- DSCR
- —
- Eligible?
- —
Personal DTI + credit; lowest rate.
DSCR
20% down · 8.5% · 30yr
- Down + closing
- —
- Monthly P&I
- —
- Monthly cashflow
- —
- DSCR
- —
- Eligible?
- —
No personal income docs; deal must DSCR.
Hard money
10% down · 12.0% · 12mo
- Down + closing
- —
- Monthly P&I
- —
- Monthly cashflow
- —
- DSCR
- —
- Eligible?
- —
Short-term bridge; refi at stabilization.
Rent comps 40 comps
| Address | Beds | Baths | Sqft | Rent | $/sqft | DOM | Units | Dist |
|---|---|---|---|---|---|---|---|---|
| 1360 W County Line Rd Unit 3212 New Braunfels, TX | 3.0 | 2.0 | 1150 | $1,545 | $1.34 | 0d | 1 | 0.13mi |
| 1666 Lantana Cir New Braunfels, TX | 3.0 | 2.0 | 1502 | $1,745 | $1.16 | 45d | 1 | 0.14mi |
| 1642 W County Line Rd New Braunfels, TX | 2.0 | 2.0 | 1238 | $1,495 | $1.21 | 6d | 1 | 0.16mi |
| 2014 Rueben Rd New Braunfels, TX | 3.0 | 2.5 | 1380 | $1,595 | $1.16 | 45d | 1 | 0.24mi |
| 2028 Rueben Rd New Braunfels, TX | 3.0 | 2.5 | 1380 | $1,595 | $1.16 | 5d | 1 | 0.27mi |
| 2207 Allison Dr New Braunfels, TX | 4.0 | 2.0 | 1850 | $1,745 | $0.94 | 14d | 1 | 0.30mi |
| 1632 Sunnycrest Cir New Braunfels, TX | 3.0 | 2.0 | 1371 | $1,625 | $1.19 | 19d | 1 | 0.35mi |
| 1611 Sunnycrest Cir New Braunfels, TX | 3.0 | 2.0 | 1779 | $1,995 | $1.12 | 6d | 1 | 0.40mi |
| 1898 Baron Dr New Braunfels, TX | 3.0 | 2.0 | 1593 | $1,950 | $1.22 | 45d | 1 | 0.40mi |
| 1619 Sunspur Dr New Braunfels, TX | 3.0 | 2.0 | 1210 | $1,750 | $1.45 | 6d | 1 | 0.50mi |
| 2010 N Ranch Estates Blvd New Braunfels, TX | 3.0 | 2.0 | 1169 | $1,649 | $1.41 | 45d | 1 | 0.57mi |
| 1213 Camellia Ln New Braunfels, TX | 4.0 | 2.0 | 1701 | $2,400 | $1.41 | 26d | 1 | 0.57mi |
| 1302 S Mesquite Ave New Braunfels, TX | 3.0 | 2.0 | 1426 | $1,775 | $1.24 | 26d | 1 | 0.57mi |
| 1648 Sunfire Cir New Braunfels, TX | 3.0 | 2.0 | 1299 | $1,850 | $1.42 | 45d | 1 | 0.59mi |
| 2062 N Ranch Estates Blvd New Braunfels, TX | 3.0 | 2.0 | 1346 | $1,775 | $1.32 | 26d | 1 | 0.62mi |
| 2169 Hazelwood New Braunfels, TX | 4.0 | 2.5 | 2216 | $2,300 | $1.04 | 6d | 1 | 0.68mi |
| 2172 Bentwood Dr New Braunfels, TX | 3.0 | 2.0 | 1542 | $1,800 | $1.17 | 45d | 1 | 0.68mi |
| 1614 Sun Canyon Blvd New Braunfels, TX | 3.0 | 2.5 | 2152 | $2,200 | $1.02 | 26d | 1 | 0.70mi |
| 2018 Reserve Way New Braunfels, TX | 4.0 | 2.0 | 2023 | $2,795 | $1.38 | 18d | 1 | 0.78mi |
| 1920 Bonelli Eagle New Braunfels, TX | 4.0 | 3.0 | 2142 | $2,045 | $0.95 | 13d | 1 | 0.79mi |
| 1911 Kallijo Ln New Braunfels, TX | 3.0 | 2.0 | 1552 | $1,800 | $1.16 | 18d | 1 | 0.81mi |
| 2271 Garden Sun Pl New Braunfels, TX | 4.0 | 2.0 | 2055 | $2,200 | $1.07 | 14d | 1 | 0.86mi |
| 1908 Tanger Ter New Braunfels, TX | 3.0 | 3.0 | 1762 | $1,900 | $1.08 | 17d | 1 | 0.87mi |
| 1908 Tanger Ter New Braunfels, TX | 3.0 | 3.0 | 1762 | $1,900 | $1.08 | 14d | 1 | 0.87mi |
| 1908 Tanger Ter New Braunfels, TX | 3.0 | 3.0 | 1762 | $1,900 | $1.08 | 26d | 1 | 0.87mi |
| 2218 Trumans Hl New Braunfels, TX | 4.0 | 2.0 | 2034 | $2,195 | $1.08 | 17d | 1 | 0.87mi |
| 2064 Dove Crossing Dr New Braunfels, TX | 4.0 | 2.0 | 1968 | $1,850 | $0.94 | 5d | 1 | 0.96mi |
| 1935 Hilltop Summit Rd Unit 2NB-2 New Braunfels, TX | 2.0 | 2.0 | 1060 | $1,329 | $1.25 | 4d | 1 | 1.03mi |
| 1337 Lauren St New Braunfels, TX | 3.0 | 2.0 | 1798 | $2,245 | $1.25 | 18d | 1 | 1.04mi |
| 618 Gode Ln New Braunfels, TX | 3.0 | 2.0 | 1255 | $1,395 | $1.11 | 45d | 1 | 1.04mi |
| 2040 Warwick Pl New Braunfels, TX | 3.0 | 2.0 | 2036 | $2,100 | $1.03 | 26d | 1 | 1.05mi |
| 2960 Nicholas Cv New Braunfels, TX | 3.0 | 2.0 | 2000 | $2,000 | $1.00 | 0d | 1 | 1.05mi |
| 419 Aaron Ln New Braunfels, TX | 4.0 | 2.0 | 1940 | $1,750 | $0.90 | 26d | 1 | 1.07mi |
| 2119 Hidden Mdw New Braunfels, TX | 3.0 | 2.0 | 1640 | $1,895 | $1.16 | 6d | 1 | 1.08mi |
| 1972 Bluethroat New Braunfels, TX | 3.0 | 2.0 | 1560 | $1,795 | $1.15 | 45d | 1 | 1.11mi |
| 2964 Vista Pkwy New Braunfels, TX | 2.0 | 2.0 | 1395 | $2,250 | $1.61 | 12d | 1 | 1.11mi |
| 2441 Fayette Dr New Braunfels, TX | 3.0 | 2.0 | 1220 | $1,650 | $1.35 | 19d | 1 | 1.12mi |
| 1915 Chiffchaff New Braunfels, TX | 3.0 | 2.0 | 1217 | $1,650 | $1.36 | 26d | 1 | 1.12mi |
| 1973 Bluethroat New Braunfels, TX | 3.0 | 2.0 | 1458 | $1,750 | $1.20 | 18d | 1 | 1.13mi |
| 410 S Water Ln New Braunfels, TX | 4.0 | 2.0 | 1963 | $1,900 | $0.97 | 45d | 1 | 1.14mi |
Listing history 38 events
-
2026-06-21statusdays on market $235,000 Active 50 DOM
-
2026-06-18days on market $235,000 Price Change 47 DOM
-
2026-06-17days on market $235,000 Price Change 46 DOM
-
2026-06-16days on market $235,000 Price Change 45 DOM
-
2026-06-15days on market $235,000 Price Change 44 DOM
-
2026-06-13days on market $235,000 Price Change 42 DOM
-
2026-06-10pricestatus $235,000 Price Change 38 DOM
-
2026-06-09days on market $250,000 Active 38 DOM
-
2026-06-08days on market $250,000 Active 37 DOM
-
2026-06-07days on market $250,000 Active 36 DOM
-
2026-06-04days on market $250,000 Active 33 DOM
-
2026-06-03days on market $250,000 Active 32 DOM
-
2026-06-02days on market $250,000 Active 31 DOM
-
2026-06-01days on market $250,000 Active 30 DOM
-
2026-05-31days on market $250,000 Active 29 DOM
-
2026-05-02$250,000 New 523-char remark
-
2026-04-17historical
-
2026-04-17historical
-
2026-02-20price $275,000
-
2026-02-19price $275,000
-
2025-09-23price $285,000
-
2025-09-23price $285,000
-
2025-07-12price $300,000
-
2025-07-12price $300,000
-
2025-06-21$310,000 New
-
2025-06-20$310,000 Active
-
2025-06-06historical
-
2025-06-06historical
-
2025-05-14price $325,000
-
2025-05-13price $325,000
-
2025-01-15$350,000 New
-
2024-12-16$350,000 Active
-
2021-04-09soldstatus Sold
-
2021-04-09soldstatus
-
2021-03-31status Pending
-
2021-03-18$239,995 New
-
2021-03-02soldstatus
-
2002-02-27soldstatus
ⓘ Source: listings_history table (triggers on properties + properties_extension) + one-shot
backfill from property_details.listing_events for pre-trigger history.
Tax reassessment forecast TX · Resets to sale price
- Current annual tax
- $4,341 · $362/mo
- Projected year-2 tax
- $4,341 · $362/mo
- Expected delta
- $0/yr ($0/mo · 0.0%)
ⓘ Screening estimate from a state-policy table — verify with the county assessor before closing.
Climate risk First Street
- Flood 6/10 Major FEMA zone X (unshaded) · 70% chance over 30 yrs
- Wildfire 4/10 Moderate
- Heat 8/10 Severe 7 d/yr ≥108°F today · 23 d/yr by 30 yrs out
- Wind 8/10 Severe 80% chance of damaging wind over 30 yrs
- Air quality 1/10 Low 0 unhealthy d/yr today · 0 by 30 yrs out
Nearby sold comps map
Loading sold comps map…
Walkable amenities ~0.75 mi
Loading nearby amenities…
Taxation est. · year 1
- Rental income
- $22,147
- − Mortgage interest
- −$13,164
- − Property taxes
- −$4,341
- − Insurance
- −$1,175
- − Repairs & maintenance
- −$1,772
- − Management
- −$1,772
- − Depreciation
- −$6,836
- Taxable loss
- −$6,912
- Est. tax savings @ 24.0%
- +$1,659
- After-tax cash flow
- $-1,149/yr
For passive investors: Depreciation is non-cash, so a rental often shows a tax loss while cash-flowing — sheltering income. Rental losses are passive: they offset passive income freely, and up to $25,000/yr can offset ordinary (W-2) income if you actively participate and your MAGI is under $100k (phasing out to $0 by $150k); unused losses carry forward. On sale, claimed depreciation is recaptured at up to 25%, and gains may owe capital-gains tax (a 1031 exchange can defer both). Figures are a year-1 estimate at your 24.0% rate — not tax advice; consult a CPA.
Schools (NCES district)
- District
- New Braunfels ISD
- NCES district ID
- 4832370
- Math proficiency
- 47% ▼ -10.00%
- Reading proficiency
- 53% ▼ -2.00%
- Median HH income
- $60,945
- Composite
- 43.81/100
- National rank
- #2931
- State rank
- #157 of 826 in TX
Livability — New Braunfels
- Score
- 83/100
- State rank
- #9
- US rank
- #925
Category grades
Schools grade is shown separately in the Schools card above.
Census & demographics
- Census place
- New Braunfels, TX
- County
- Comal County · 206,262 people
- City population
- 144,962
- Metro
- San Antonio-New Braunfels, TX
- Population (ZIP)
- 104,009
- Household income
- $83,064
- Rent vs Own
- Severe rent burden
- 2912.0
Population outlook (Comal County) Hauer SSP2
- Today (2025)
- 175,637 people
- By 2030
- 199,911 · +13.8%
- By 2040
- 249,436 · +42.0%
- By 2050
- 299,430 · +70.5%
- By 2075
- 423,857 · +141.3%
- By 2100
- 512,048 · +191.5%
Race, ethnicity, and origin ACS 2023
- Neighborhood character
- Majority White (58%)
- Race & ethnicity
- White 58% Hispanic / Latino 37% Two or more races 19% Black 2%
- Hispanic origin (detail)
- Mexican 32%
- Common ancestry
- Romanian 2% Lithuanian 2% Slovak 2%
- Foreign-born
- 7% · Canada
- Languages at home
- 78% English-only · Spanish 20% German/W. Germanic 1%
Political lean MEDSL · Comal
- 2024 margin
- Solid R (+45.5) · D 26.8% · R 72.2%
- 2008→2024 swing
- +1.9pp toward D · 2008: -47.4pp · 2024: -45.5pp
- All cycles
- 2024: R+45.5 2020: R+42.7 2016: R+50.1 2012: R+54.1 2008: R+47.4
Not yet ingested
- Civics
- —
Market trends
- HPI YoY
- ▼ -190.61%
- Current HPI
- 173.7128
- Rent YoY
- ▼ -1.97%
- Metro
- San Antonio-New Braunfels, TX
- State GDP YoY
- ▲ 3.95%
- F500 in state
- 110
Industry mix (Fortune 500 HQ in TX)
| Industry | F500 HQs | Revenue |
|---|---|---|
| Energy | 16 | $1,198B |
|
||
| Technology | 5 | $198B |
|
||
| Engineering / Construction | 4 | $72B |
|
||
| Energy Services | 3 | $60B |
|
||
| Utilities | 3 | $41B |
|
||
| Healthcare | 2 | $330B |
|
||
Price history
-2.1% since first listed24 events — show timeline
- 2026-06-10 Price Changed $235,000 LERA
- 2026-05-02 Listed $250,000 LERA
- 2026-04-17 Listing Removed — LERA
- 2026-04-17 Listing Removed — CTXMLS
- 2026-02-20 Price Changed $275,000 LERA
- 2026-02-19 Price Changed $275,000 CTXMLS
- 2025-09-23 Price Changed $285,000 LERA
- 2025-09-23 Price Changed $285,000 CTXMLS
- 2025-07-12 Price Changed $300,000 LERA
- 2025-07-12 Price Changed $300,000 CTXMLS
- 2025-06-21 Listed $310,000 LERA
- 2025-06-20 Listed $310,000 CTXMLS
- 2025-06-06 Listing Removed — LERA
- 2025-06-06 Listing Removed — CTXMLS
- 2025-05-14 Price Changed $325,000 LERA
- 2025-05-13 Price Changed $325,000 CTXMLS
- 2025-01-15 Listed $350,000 LERA
- 2024-12-16 Listed $350,000 CTXMLS
- 2021-04-09 Sold (MLS) — LERA
- 2021-04-09 Sold (Public Records) — Public Records
- 2021-03-31 Pending — LERA
- 2021-03-18 Listed $239,995 LERA
- 2021-03-02 Sold (Public Records) — Public Records
- 2002-02-27 Sold (Public Records) — Public Records
Property tax history
+2.1%/yrLatest (2026): $4,341 · -15.4% YoY. Source: county tax records.
Cash-flow waterfall
monthlySold comps — $/sqft
last 12 mo · ≤1 miLoading sold comps…