1081 Tabor Pl · Graniteville, SC
Flood risk No data
- FEMA flood zone
- —
- Chance of flooding over 30 yrs
- —
- Est. flood insurance / yr
- —
Fire risk No data
- Est. fire insurance / yr
- —
Heat risk No data
- Hot days now (above threshold)
- —
- Hot days in 30 yrs
- —
Wind risk No data
- Chance of severe wind over 30 yrs
- —
Air-quality risk No data
- Unhealthy air days now
- —
- Unhealthy air days in 30 yrs
- —
Risk factors via First Street. Map © Google.
Why this score? — see what drove the D grade
The composite is a weighted blend of 9 inputs, each scored 0–100. Each bar is that input's sub-score; the figure is the points it added to the 100-point composite (weight × sub-score).
- ARV discount +12.5/15.0
- Cash flow +10.4/30.0
- Appreciation +5.0/10.0
- Schools +3.2/10.0
- 1% rule +3.1/10.0
- DSCR +3.0/10.0
- Livability +3.0/5.0
- Rent growth +2.5/5.0
- Condition / age +2.0/5.0
$258,610
🖨 Deal sheet (PDF) 📄 Offer letter ✓ Due diligence
Listing remarks MLS
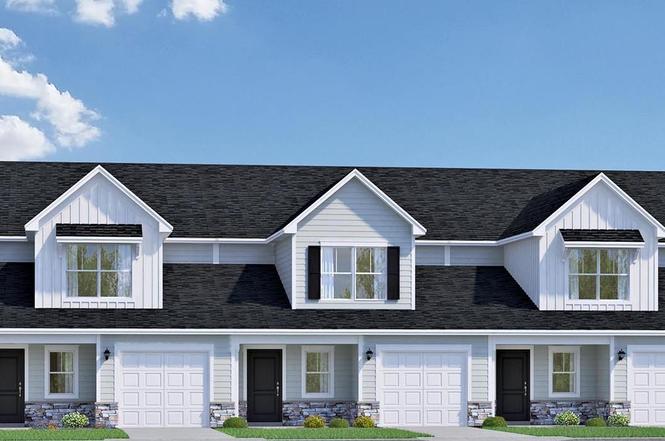
The Harper floor plan combines smart design with modern comfort, creating a home that's both functional and welcoming. The first floor opens with a covered porch and foyer that lead into a bright kitchen with a central island and pantry, flowing into a breakfast area and spacious family room. The owner's suite is also conveniently located on the main level, featuring a private bath, walk-in closet, and direct access to a cozy back porch. Upstairs, a versatile loft anchors the second floor and offers plenty of space for relaxing or entertaining. Three additional bedrooms, each with walk-in closets, share a full bath, making this level ideal for family, guests, or a home office. With thoughtful details like a powder room, laundry area, and attached garage, the Harper balances everyday convenience with style and comfort. .
Key facts
- Covered porch
- Bright kitchen
- Central island
Tags
Property features AI
Finance
- HOA & community: Community has an association
Exterior
- Parking: Attached 1-car garage
- Utilities: Public sewer; Public water
- Home design: Two-story home; Lot numbered 175
- Construction: Slab foundation
- Exterior features: Fiber cement (Hardy Plank) exterior finish; Paved road access; Public water
Interior
- Bedrooms: Primary bedroom on the main level; Additional bedrooms on the second level
- Bathrooms: Two full bathrooms; One partial bathroom; One half bathroom
- Interior features: Central cooling; Gas heating on both levels; Washer/dryer located on the main level
- Laundry & utility: Laundry area on the main level
Neighborhood map
What this means for you Summary
Snapshot
- This is a 4-bed/2.5-bath single-family listed at $259k. Condition is rated fair.
Deal economics
- At list price, monthly cash flow is $-137 ($-2k/yr) — negative.
- To cash-flow at today's rent, offer at most $239k (7.7% below list).
- To meet the 1% rule (rent ≥ 1% of price), the offer needs to be $209k (19.2% below list).
- Recommended offer: $209k (19.2% below list) — sets the bar for 1% rule.
Location & tenants
- Location reads 59/100 on livability (#240 in SC) — a working-class tenant base; expect higher turnover. Strengths: cost of living A+, crime B+; Watch: amenities F, commute F, employment F.
- Aiken 01 (suburban): math 31% / reading 44% proficiency, ranked #36 of 80 in SC (top 45%) — families likely to look elsewhere, expect single-tenant / working-renter base with shorter leases.
- Zoned schools: Byrd Elementary (math 28% / reading 36%, grade F, #369 of 597 statewide, top 64%, 657 students, 37% FRL); Leavelle Mccampbell Middle (math 19% / reading 32%, grade F, #162 of 229 statewide, top 71%, 650 students, 55% FRL); Midland Valley High (math 31% / reading 83%, grade C, #120 of 196 statewide, top 64%, 1,477 students, 62% FRL) — zoned schools at 51% FRL track the district average.
- Market conditions: 9 active listings in the ZIP; 8 comparable units currently listed for rent nearby; rentals at typical pace (median 23d on market — plan ~3-4 weeks tenant-placement turnaround); 2,500 units permitted in Aiken County in 2024 (1,023 in 5+ unit buildings).
Forward outlook
- In year one you build about $10k of equity ($2k loan paydown + $8k appreciation (3.0% local appreciation)).
- Aiken County population projected at +9% by 2050 — modest demand growth; plan on rents tracking national, not racing it.
- By year 4, paydown + projected appreciation supports a ~$32k cash-out refi (75% LTV) — recoverable capital for the next deal without selling this one.
Negotiation context
- It's been on market 118 days — a 9% lower offer ($235k) is reasonable based on typical stale-listing flexibility.
- 5 sale attempts with the ask held roughly flat each time — persistent listings suggest the price (not the market) is what's stuck; bring a comps-based counter.
Questions for the listing agent
- What do current leases actually rent for vs. the listed asking? Can we see a recent rent roll and the last 12 months of T-12 income?
- It's been on market 118 days. Have you received any prior offers? Is the seller open to a 19% concession, seller financing, or rate buy-down credit?
- Have any recent inspections been done? Can we get a copy of the seller's disclosures and any deferred-maintenance estimates?
- Why hasn't it sold? Are there any deal-killer items the seller is aware of (foundation, flood, title, zoning, code violations)?
- Is there a deadline driving the sale (1031 exchange, divorce, estate, relocation)? That informs how much negotiation room exists.
- Schools are F-rated, which usually means shorter tenancies and higher turnover. Who's the typical renter profile here, and what's been the actual vacancy rate?
- The area grade is low — what's the realistic commute time and amenity access for the typical tenant pool here? Any planned neighborhood developments (good or bad) we should know about?
- What's the average days-on-market for RENTAL listings here right now (not sales)? A rising rental-DOM trend means longer vacancies and softer asking-rent achievability than the comps imply.
- What's the recent tenant-quality profile in this submarket — average credit score on applications, eviction rate, late-payment / NSF rate, and stable-employment percentage? A property-management company in the area should have these aggregated.
- How much new for-sale + rental construction is in the pipeline within 1–3 miles? Heavy new supply typically softens prices + rents 12–24 months out; constrained supply supports both.
Investment metrics
- 1% rule
- 0.81% ✗
- Cap rate
- 5.66%
- Cash-on-cash
- -2.27%
- DSCR
- 0.90
- GRM
- 10.3
CMA / ARV
- ARV (on-the-fly)
- $290,632
- Comps found
- 12
Show comp detail 12 sales within ~0.75 mi
| Address | Dist | Beds/Ba | Sqft | Sold | Price | $/sf | Match |
|---|---|---|---|---|---|---|---|
| 598 Whitby Ct | 0.11mi | 4/2.5 | 2,176 (+2%) | 4mo | $294,120 | $135 | 88 |
| 555 Whitby Ct | 0.15mi | 4/2.5 | 2,176 (+2%) | 3mo | $290,230 | $133 | 87 |
| 555 Whitby Ct | 0.15mi | 4/2.5 | 2,176 (+2%) | 3mo | $290,230 | $133 | 87 |
| 597 Whitby Ct | 0.13mi | 4/2.5 | 1,976 (-8%) | 3mo | $275,230 | $139 | 79 |
| 346 Donnington Ct | 0.38mi | 4/2.0 | 2,318 (+8%) | 3mo | $331,900 | $143 | 64 |
| 347 Marstrand Cir | 0.61mi | 4/2.5 | 2,325 (+9%) | 2mo | $286,000 | $123 | 55 |
| 4481 Hartshorn Cir | 0.69mi | 4/2.5 | 2,325 (+9%) | 2mo | $329,550 | $142 | 52 |
| 4349 Hartshorn Cir | 0.70mi | 4/3.0 | 2,455 (+15%) | 2mo | $299,000 | $122 | 39 |
| 4469 Hartshorn Cir | 0.70mi | 4/3.0 | 2,455 (+15%) | 2mo | $335,695 | $137 | 39 |
| 4457 Hartshorn Cir | 0.71mi | 4/3.0 | 2,455 (+15%) | 3mo | $339,770 | $138 | 38 |
| 4445 Hartshorn Cir | 0.71mi | 3/2.5 (-1) | 2,455 (+15%) | 3mo | $332,700 | $136 | 34 |
| 4445 Hartshorn Cir | 0.72mi | 3/2.5 (-1) | 2,455 (+15%) | 3mo | $332,700 | $136 | 34 |
Match score weights: distance 35% · size 25% · config 20% · recency 20%. Top-matched comps best support the ARV.
Projected returns pro-forma
3.0% appreciation · 3.0% rent growth · sell at horizon
- IRR
- 5.4%
- Equity multiple
- 1.31×
- Total profit
- $22,470
- Equity at exit
- $116,282
- IRR
- 8.4%
- Equity multiple
- 2.27×
- Total profit
- $92,287
- Equity at exit
- $179,205
Cash invested: $72,411 (down + closing). Projections, not guarantees.
Landlord ↔ Tenant lean methodology
- Overall (STATE)
- 90 Strongly Landlord-Friendly
- State South Carolina
- 90 Strongly Landlord-Friendly · R+6
- County
- — inherits STATE
- City
- — inherits STATE
ZIP-level market 29801-0000
- Active inventory
- 9
- Price-to-rent
- 10.3×
Monthly cashflow live
- Estimated rent
- $2,089 high interval (Pro) →
- Mortgage (P&I)
- −$1,356
- Tax est. 1.5%
- −$323 /mo · $3,879/yr
- Insurance
- −$108
- HOA
- −$0
- Vacancy / Maint / Mgmt
- −$439
- Net cashflow
- $-137
Break-even live
Sensitivity live
| Price | -10% $42 | -5% $-47 | +0% $-137 | +5% $-226 | +10% $-316 |
|---|---|---|---|---|---|
| Rent | -10% $-302 | -5% $-219 | +0% $-137 | +5% $-54 | +10% $28 |
| Rate | -1.0pp $-7 | -0.5pp $-71 | base $-137 | +0.5pp $-204 | +1.0pp $-272 |
UW: 25.0% down · 7.5% · 30yr · 1.5% tax · 5.0% vac · 8.0% maint · 8.0% mgmt
Financing live
Cash to close
- Down payment
- $64,652
- Closing costs
- $7,758
- Reserves months
- —
- Total cash needed
- —
Loan-product check · same deal, 3 products live
Conventional
25% down · 7.5% · 30yr
- Down + closing
- —
- Monthly P&I
- —
- Monthly cashflow
- —
- DSCR
- —
- Eligible?
- —
Personal DTI + credit; lowest rate.
DSCR
20% down · 8.5% · 30yr
- Down + closing
- —
- Monthly P&I
- —
- Monthly cashflow
- —
- DSCR
- —
- Eligible?
- —
No personal income docs; deal must DSCR.
Hard money
10% down · 12.0% · 12mo
- Down + closing
- —
- Monthly P&I
- —
- Monthly cashflow
- —
- DSCR
- —
- Eligible?
- —
Short-term bridge; refi at stabilization.
Rent comps 8 comps
| Address | Beds | Baths | Sqft | Rent | $/sqft | DOM | Units | Dist |
|---|---|---|---|---|---|---|---|---|
| 721 Grovebury Ct Aiken, SC | 3.0 | 2.5 | 1435 | $1,750 | $1.22 | 15d | 1 | 0.14mi |
| 430 Whitby Ct Aiken, SC | 3.0 | 2.5 | 1749 | $2,050 | $1.17 | 23d | 1 | 0.18mi |
| 433 Whitby Ct Aiken, SC | 5.0 | 3.0 | 2378 | $2,495 | $1.05 | 23d | 1 | 0.20mi |
| 3124 Saint Charles Ave Aiken, SC | 3.0 | 2.0 | 1550 | $2,085 | $1.35 | 23d | 1 | 0.69mi |
| 983 Manitou Cir Aiken, SC | 3.0 | 2.0 | 1551 | $1,980 | $1.28 | 25d | 1 | 0.76mi |
| 266 Mansell Park Aiken, SC | 3.0 | 2.5 | 1807 | $1,950 | $1.08 | 23d | 1 | 0.83mi |
| 293 Mansell Park Aiken, SC | 4.0 | 2.5 | 2386 | $2,250 | $0.94 | 23d | 1 | 0.85mi |
| 860 Delta Ln Unit 860 Aiken, SC | 4.0 | 4.0 | 2336 | $2,100 | $0.90 | 15d | 1 | 1.00mi |
Listing history 25 events
-
2026-06-21days on market $258,610 Active 118 DOM
-
2026-06-18days on market $258,610 Active 115 DOM
-
2026-06-17days on market $258,610 Active 114 DOM
-
2026-06-16days on market $258,610 Active 113 DOM
-
2026-06-15days on market $258,610 Active 112 DOM
-
2026-06-14days on market $258,610 Active 110 DOM
-
2026-06-13days on market $258,610 Active 109 DOM
-
2026-06-10pricedays on market $258,610 Active 107 DOM
-
2026-06-09days on market $268,610 Active 106 DOM
-
2026-06-08days on market $268,610 Active 105 DOM
-
2026-06-07days on market $268,610 Active 104 DOM
-
2026-06-03days on market $268,610 Active 100 DOM
-
2026-06-02days on market $268,610 Active 99 DOM
-
2026-06-01days on market $268,610 Active 98 DOM
-
2026-05-31days on market $268,610 Active 97 DOM
-
2026-05-30days on market $268,610 Active 96 DOM
-
2026-05-13$268,610 Active 831-char remark
Show marketing remark (831 chars)
The Harper floor plan combines smart design with modern comfort, creating a home that's both functional and welcoming. The first floor opens with a covered porch and foyer that lead into a bright kitchen with a central island and pantry, flowing into a breakfast area and spacious family room. The owner's suite is also conveniently located on the main level, featuring a private bath, walk-in closet, and direct access to a cozy back porch. Upstairs, a versatile loft anchors the second floor and offers plenty of space for relaxing or entertaining. Three additional bedrooms, each with walk-in closets, share a full bath, making this level ideal for family, guests, or a home office. With thoughtful details like a powder room, laundry area, and attached garage, the Harper balances everyday convenience with style and comfort. .
-
2026-05-11historical
-
2026-04-26price $268,610
-
2026-04-25price $268,610
-
2026-04-25price $268,610
-
2026-02-23$253,610 Active
-
2026-02-14$253,610 Active
-
2026-02-14$253,610 Active
-
2026-02-14$268,610 Active
ⓘ Source: listings_history table (triggers on properties + properties_extension) + one-shot
backfill from property_details.listing_events for pre-trigger history.
Nearby sold comps map
Loading sold comps map…
Walkable amenities ~0.75 mi
Loading nearby amenities…
Taxation est. · year 1
- Rental income
- $25,069
- − Mortgage interest
- −$14,486
- − Property taxes
- −$3,879
- − Insurance
- −$1,293
- − Repairs & maintenance
- −$2,005
- − Management
- −$2,005
- − Depreciation
- −$7,523
- Taxable loss
- −$6,124
- Est. tax savings @ 24.0%
- +$1,470
- After-tax cash flow
- $-172/yr
For passive investors: Depreciation is non-cash, so a rental often shows a tax loss while cash-flowing — sheltering income. Rental losses are passive: they offset passive income freely, and up to $25,000/yr can offset ordinary (W-2) income if you actively participate and your MAGI is under $100k (phasing out to $0 by $150k); unused losses carry forward. On sale, claimed depreciation is recaptured at up to 25%, and gains may owe capital-gains tax (a 1031 exchange can defer both). Figures are a year-1 estimate at your 24.0% rate — not tax advice; consult a CPA.
Condition & rehab AI · 4 photos
The home is in fair condition with good roof and exterior. Minor repairs and maintenance are needed for landscaping and fencing. Painting the exterior and improving landscaping would significantly increase its value.
Repairs flagged
- Minor landscaping — Some dead grass and sparse vegetation
- Minor fencing — Some sections appear worn
Value-add opportunities
- Both paint exterior — Fresh paint enhances curb appeal and value
- Both landscape — Well-maintained landscaping improves curb appeal and rental appeal
Renovation cost estimate screening
| Repair item | Severity | Est. cost |
|---|---|---|
| landscaping · Some dead grass and sparse vegetation | Minor | $500–3,000 |
| fencing · Some sections appear worn | Minor | $500–3,000 |
| Total estimated repair cost · 2 items | $1,000–6,000 |
Value-add ROI direction
- Both paint exterior — Fresh paint enhances curb appeal and value ↑
- Both landscape — Well-maintained landscaping improves curb appeal and rental appeal ↑
ⓘ Cost ranges are severity-bucket heuristics (US national rule-of-thumb). Get contractor quotes + a written scope before underwriting a rehab budget.
Schools (NCES district)
- District
- Aiken 01
- NCES district ID
- 4500720
- Math proficiency
- 31% ▼ -11.00%
- Reading proficiency
- 44% ▼ -1.00%
- Median HH income
- $45,081
- Composite
- 31.91/100
- National rank
- #5857
- State rank
- #36 of 80 in SC
Livability — Graniteville
- Score
- 59/100
- State rank
- #240
- US rank
- #19924
Category grades
Schools grade is shown separately in the Schools card above.
Census & demographics
No demographic data for this ZIP.
Market trends
- HPI YoY
- —
- Current HPI
- —
- Rent YoY
- —
- Metro
- —
- State GDP YoY
- ▲ 4.51%
- F500 in state
- 2
Industry mix (Fortune 500 HQ in SC)
| Industry | F500 HQs | Revenue |
|---|---|---|
| Packaging | 1 | $7B |
|
||
Price history
+0.0% since first listed9 events — show timeline
- 2026-05-13 Listed $268,610 Zillow
- 2026-05-11 Listing Removed — Hive MLS
- 2026-04-26 Price Changed $268,610 Consolidated MLS
- 2026-04-25 Price Changed $268,610 AMLS
- 2026-04-25 Price Changed $268,610 Hive MLS
- 2026-02-23 Listed $253,610 Consolidated MLS
- 2026-02-14 Listed $253,610 Hive MLS
- 2026-02-14 Listed $253,610 AMLS
- 2026-02-14 Listed $268,610 Hive MLS
Cash-flow waterfall
monthlySold comps — $/sqft
last 12 mo · ≤1 miLoading sold comps…