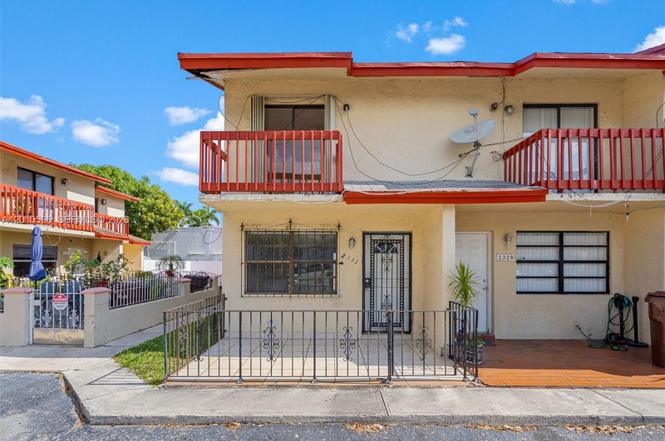
2331 W 66th Pl #201 · Hialeah, FL
Flood risk 9/10 · Severe
- FEMA flood zone
- X (unshaded)
- Chance of flooding over 30 yrs
- 0.99%
- Est. flood insurance / yr
- $507 – $1,088
Fire risk 1/10 · Minimal
- Est. fire insurance / yr
- $947 – $1,759
Heat risk 10/10 · Severe
- Hot days now (above 106°F)
- 7 days/yr
- Hot days in 30 yrs
- 30 days/yr
Wind risk 10/10 · Severe
- Chance of severe wind over 30 yrs
- 99.0%
Air-quality risk 2/10 · Minimal
- Unhealthy air days now
- 1 days/yr
- Unhealthy air days in 30 yrs
- 2 days/yr
Risk factors via First Street. Map © Google.
Why this score? — see what drove the D grade
The composite is a weighted blend of 9 inputs, each scored 0–100. Each bar is that input's sub-score; the figure is the points it added to the 100-point composite (weight × sub-score).
- Cash flow +14.5/30.0
- ARV discount +7.5/15.0
- DSCR +4.4/10.0
- 1% rule +4.3/10.0
- Schools +4.2/10.0
- Livability +3.7/5.0
- Rent growth +2.5/5.0
- Condition / age +2.5/5.0
- Appreciation +0.0/10.0
$249,000
🖨 Deal sheet (PDF) 📄 Offer letter ✓ Due diligence
Listing remarks
2-bedroom, 1.5-bathroom townhome in Westland Village, Hialeah. This unit offers 825 sq. ft. of living space, featuring an in-unit washer and dryer, a porch, and a covered patio. Includes two assigned parking spaces. Conveniently located near shopping, schools, and major highways. Priced to sell. Easy to show.
Key facts
- Covered patio
- $45 HOA
- 2 parking spots
Tags
Property features AI
Finance
- Other: Pets allowed with no restrictions
- HOA & community: Monthly association fee of $45 covering common areas
Exterior
- Parking: Assigned parking; Two or more spaces
- Utilities: Cable available
- Home design: 2 stories; Entry on level 1; Resale property
- Construction: Block construction
- Exterior features: Patio; Attached property
Interior
- Kitchen: Electric range
- Bedrooms: Upper-level primary bedroom
- Flooring: Tile
- Bathrooms: 1 full bathroom; 1 half bathroom
- Heating & cooling: Central heating (electric); Central air conditioning (electric)
- Interior features: Family/dining room; First-floor entry; Upper-level primary bedroom
- Laundry & utility: Washer; Dryer
Neighborhood map
What this means for you Summary
Snapshot
- This is a 2-bed/1.0-bath condo listed at $249k.
Deal economics
- At list price, monthly cash flow is $-11 ($-132/yr) — negative.
- To cash-flow at today's rent, offer at most $247k (0.6% below list).
- To meet the 1% rule (rent ≥ 1% of price), the offer needs to be $231k (7.4% below list).
- Recommended offer: $231k (7.4% below list) — sets the bar for 1% rule.
- Cap rate 6.6% vs local median 3.5% in Hialeah — top-decile yield for the area; either an underpriced asset or a hidden risk that comps aren't pricing in. Stress-test before assuming the spread holds.
Location & tenants
- Location reads 74/100 on livability (#288 in FL, #4,774 nationally) — a middle-class / working-renter tenant base. Strengths: commute A+, health & safety A+; Watch: amenities F, employment D-.
- Miami-Dade (suburban): math 45% / reading 54% proficiency, ranked #40 of 73 in FL (top 55%) — families likely to look elsewhere, expect single-tenant / working-renter base with shorter leases; 64% free/reduced lunch — lower-income household profile, screen leases tightly.
- Zoned schools: Ben Sheppard Elementary School (math 48% / reading 54%, grade C-, #1,043 of 2,144 statewide, top 49%, 897 students, 77% FRL); Palm Springs Middle School (math 32% / reading 40%, grade F, #410 of 571 statewide, top 72%, 782 students, 72% FRL); Hialeah Gardens Senior High School (math 24% / reading 56%, grade F, #296 of 667 statewide, top 45%, 2,756 students, 59% FRL).
- Market conditions: Rents flat; 148 active listings in the ZIP; 40 comparable units currently listed for rent nearby; rentals at typical pace (median 20d on market — plan ~3-4 weeks tenant-placement turnaround); 10,051 units permitted in Miami-Dade County in 2024 (7,758 in 5+ unit buildings).
- At $2,305/mo this rent would consume 47% of the median local household income ($58k/yr) (locally 2779% of renters already pay >50% of income on rent) — very limited rent-growth headroom before tenants either downsize or default.
Forward outlook
- Local home prices are declining (-3.0%/yr); year-one equity from $2k of loan paydown is wiped out by about $7k of value loss. Plan a longer hold.
- Miami-Dade County population projected at +28% by 2050 — long-run rental-demand tailwind backs the buy-and-hold thesis.
Negotiation context
- It's been on market 42 days — a 3% lower offer ($242k) is reasonable based on typical stale-listing flexibility.
- Current owner paid $180k; 38% above their basis — modest negotiation headroom, anchor on the comps not their cost.
Risks & watch-outs
- Watch-outs: flood insurance adds $66/mo.
- Climate carrying-cost: severe flood risk; severe wind risk, 99% chance of damaging wind over 30y; extreme-heat days projected 7→30/yr by 2055 (HVAC capex compounding) — expect insurance premiums to compound above CPI over the hold.
Questions for the listing agent
- What do current leases actually rent for vs. the listed asking? Can we see a recent rent roll and the last 12 months of T-12 income?
- It's been on market 42 days. Have you received any prior offers? Is the seller open to a 7% concession, seller financing, or rate buy-down credit?
- What's the actual annual flood-insurance premium (NFIP or private), and is the property in a SFHA with mandatory coverage?
- What does the HOA fee cover, when was the last increase, and are there any pending special assessments or reserve-fund shortfalls?
- Any open or pending special assessments — roof, HVAC, plumbing, elevator, façade? What's the per-unit balance and payoff schedule, and is the seller paying it off at close or rolling it to the buyer?
- Is there a deadline driving the sale (1031 exchange, divorce, estate, relocation)? That informs how much negotiation room exists.
- The area grade is low — what's the realistic commute time and amenity access for the typical tenant pool here? Any planned neighborhood developments (good or bad) we should know about?
- What's the average days-on-market for RENTAL listings here right now (not sales)? A rising rental-DOM trend means longer vacancies and softer asking-rent achievability than the comps imply.
- What's the recent tenant-quality profile in this submarket — average credit score on applications, eviction rate, late-payment / NSF rate, and stable-employment percentage? A property-management company in the area should have these aggregated.
- How much new apartment / multifamily construction is in the pipeline within 1–3 miles? Heavy new supply (>2% of stock underway) typically softens rents 12–24 months out; light construction supports rent growth.
Investment metrics
- 1% rule
- 0.93% ✗
- Cap rate
- 6.56%
- Cash-on-cash
- 0.95%
- DSCR
- 1.04
- GRM
- 9.0
CMA / ARV
No comps found within radius.
Projected returns pro-forma
-3.0% appreciation · 0.17% rent growth · sell at horizon
- IRR
- -20.0%
- Equity multiple
- 0.32×
- Total profit
- $-47,329
- Equity at exit
- $37,127
- IRR
- -21.3%
- Equity multiple
- 0.05×
- Total profit
- $-66,450
- Equity at exit
- $21,529
Cash invested: $69,720 (down + closing). Projections, not guarantees.
Landlord ↔ Tenant lean methodology
- Overall (STATE)
- 87 Strongly Landlord-Friendly
- State Florida
- 87 Strongly Landlord-Friendly · R+3
- County
- — inherits STATE
- City
- — inherits STATE
ZIP-level market 33016
- Home prices YoY
- -34.4%
- Rents YoY
- 0.2%
- Active inventory
- 148
- Price-to-rent
- 9.0×
Monthly cashflow live
- Estimated rent
- $2,305 high interval (Pro) →
- Mortgage (P&I)
- −$1,306
- Tax est. 1.5%
- −$311 /mo · $3,735/yr
- Insurance
- −$104
- Flood insurance flood zone
- −$66 /mo · $798/yr
- HOA
- −$45
- Vacancy / Maint / Mgmt
- −$484
- Net cashflow
- $-11
Break-even live
Sensitivity live
| Price | -10% $161 | -5% $75 | +0% $-11 | +5% $-97 | +10% $-183 |
|---|---|---|---|---|---|
| Rent | -10% $-193 | -5% $-102 | +0% $-11 | +5% $80 | +10% $171 |
| Rate | -1.0pp $114 | -0.5pp $52 | base $-11 | +0.5pp $-76 | +1.0pp $-141 |
UW: 25.0% down · 7.5% · 30yr · 1.5% tax · 5.0% vac · 8.0% maint · 8.0% mgmt
Financing live
Cash to close
- Down payment
- $62,250
- Closing costs
- $7,470
- Reserves months
- —
- Total cash needed
- —
Loan-product check · same deal, 3 products live
Conventional
25% down · 7.5% · 30yr
- Down + closing
- —
- Monthly P&I
- —
- Monthly cashflow
- —
- DSCR
- —
- Eligible?
- —
Personal DTI + credit; lowest rate.
DSCR
20% down · 8.5% · 30yr
- Down + closing
- —
- Monthly P&I
- —
- Monthly cashflow
- —
- DSCR
- —
- Eligible?
- —
No personal income docs; deal must DSCR.
Hard money
10% down · 12.0% · 12mo
- Down + closing
- —
- Monthly P&I
- —
- Monthly cashflow
- —
- DSCR
- —
- Eligible?
- —
Short-term bridge; refi at stabilization.
Rent comps 40 comps
| Address | Beds | Baths | Sqft | Rent | $/sqft | DOM | Units | Dist |
|---|---|---|---|---|---|---|---|---|
| 2377 W 66th Pl #204 Hialeah, FL | 2.0 | 1.5 | 828 | $2,350 | $2.84 | 26d | 1 | 0.07mi |
| 2500 W 67th Pl Unit 21-26 Hialeah, FL | 2.0 | 2.0 | 750 | $2,500 | $3.33 | 13d | 1 | 0.23mi |
| 2500 W 67th Pl Unit 21-26 Hialeah, FL | 2.0 | 2.0 | 750 | $2,500 | $3.33 | 4d | 1 | 0.23mi |
| 2530 W 67th Pl Unit 12-29 Hialeah, FL | 2.0 | 2.0 | 750 | $2,300 | $3.07 | 7d | 1 | 0.25mi |
| 2530 W 67th Pl Unit 12-29 Hialeah, FL | 2.0 | 2.0 | 750 | $2,300 | $3.07 | 14d | 1 | 0.25mi |
| 2401 W 70th St Hialeah, FL | 3.0 | 1.0 | 1000 | $2,800 | $2.80 | 21d | 1 | 0.26mi |
| 6278 W 22nd Ct #21 Hialeah, FL | 2.0 | 1.5 | 778 | $1,900 | $2.44 | 22d | 1 | 0.27mi |
| 2550 W 67th Pl Unit 22-32 Hialeah, FL | 2.0 | 2.0 | 750 | $2,250 | $3.00 | 0d | 1 | 0.28mi |
| 2550 W 67th Pl Unit 22-32 Hialeah, FL | 2.0 | 2.0 | 750 | $2,250 | $3.00 | 26d | 1 | 0.28mi |
| 2570 W 67th Pl Hialeah, FL | 2.0 | 2.0 | 747 | $2,300 | $3.08 | 22d | 1 | 0.30mi |
| 2570 W 67th Pl Unit 21-0 Hialeah, FL | 2.0 | 2.0 | 747 | $2,300 | $3.08 | 26d | 1 | 0.30mi |
| 2313 W 60th St Unit C206 Hialeah, FL | 2.0 | 1.5 | 893 | $2,200 | $2.46 | 24d | 1 | 0.31mi |
| 6215 W 22nd Ct #15 Hialeah, FL | 2.0 | 1.5 | 778 | $2,000 | $2.57 | 12d | 1 | 0.32mi |
| 6215 W 22nd Ct #15 Hialeah, FL | 2.0 | 1.5 | 778 | $2,000 | $2.57 | 9d | 1 | 0.32mi |
| 6715 W 26th Dr Unit 101-6 Hialeah, FL | 2.0 | 2.0 | 769 | $2,200 | $2.86 | 26d | 1 | 0.34mi |
| 6690 W 26th Ct Unit 23-16 Hialeah, FL | 2.0 | 2.0 | 747 | $2,200 | $2.95 | 26d | 1 | 0.35mi |
| 6660 W 26th Ct Unit 23-17 Hialeah, FL | 2.0 | 2.0 | 747 | $1,950 | $2.61 | 24d | 1 | 0.36mi |
| 6660 W 26th Ct Unit 23-17 Hialeah, FL | 2.0 | 2.0 | 747 | $1,950 | $2.61 | 13d | 1 | 0.36mi |
| 6141 W 22nd Ct #202 Hialeah, FL | 2.0 | 1.5 | 900 | $1,950 | $2.17 | 24d | 1 | 0.36mi |
| 6141 W 22nd Ct Hialeah, FL | 2.0 | 1.0 | 900 | $1,950 | $2.17 | 5d | 1 | 0.36mi |
| 6081 W 24th Ave #207 Hialeah, FL | 2.0 | 1.5 | 860 | $2,200 | $2.56 | 26d | 1 | 0.37mi |
| 2319 W 60th St Unit 212D Hialeah, FL | 2.0 | 1.5 | 893 | $2,200 | $2.46 | 3d | 1 | 0.37mi |
| 2319 W 60th St Unit D203 Hialeah, FL | 2.0 | 1.5 | 893 | $2,000 | $2.24 | 26d | 1 | 0.37mi |
| 6515 W 26th Dr Unit 12-38 Hialeah, FL | 2.0 | 2.0 | 750 | $2,500 | $3.33 | 19d | 1 | 0.39mi |
| 6011 W 24th Ave Unit A103 Hialeah, FL | 2.0 | 1.5 | 954 | $2,200 | $2.31 | 15d | 1 | 0.40mi |
| 6011 W 24th Ave Unit A103 Hialeah, FL | 2.0 | 1.5 | 954 | $2,200 | $2.31 | 12d | 1 | 0.40mi |
| 7275 W 24th Ave #240 Hialeah, FL | 2.0 | 2.0 | 830 | $2,100 | $2.53 | 26d | 1 | 0.40mi |
| 7275 W 24th Ave #240 Hialeah, FL | 2.0 | 2.0 | 830 | $2,000 | $2.41 | 9d | 1 | 0.40mi |
| 2212 W 74th St Unit 201-28 Hialeah, FL | 2.0 | 2.0 | 960 | $2,200 | $2.29 | 26d | 1 | 0.41mi |
| 2212 W 74th St Unit 101-28 Hialeah, FL | 2.0 | 2.0 | 960 | $2,400 | $2.50 | 20d | 1 | 0.41mi |
| 2220 W 74th St Unit 201-16 Hialeah, FL | 2.0 | 2.0 | 765 | $2,300 | $3.01 | 26d | 1 | 0.43mi |
| 6385 W 27th Ave Unit 11-3 Hialeah, FL | 2.0 | 2.0 | 750 | $2,300 | $3.07 | 26d | 1 | 0.44mi |
| 2250 W 74th St Hialeah, FL | 3.0 | 2.0 | 1090 | $3,200 | $2.94 | 13d | 1 | 0.46mi |
| 2250 W 74th Pl Hialeah, FL | 3.0 | 2.0 | 1090 | $3,200 | $2.94 | 13d | 1 | 0.48mi |
| 2250 W 74th Pl Unit 8C Hialeah, FL | 3.0 | 2.0 | 1090 | $3,200 | $2.94 | 21d | 1 | 0.48mi |
| 6545 W 27th Ct Unit 24-47 Hialeah, FL | 3.0 | 2.0 | 980 | $2,700 | $2.76 | 9d | 1 | 0.48mi |
| 2735 W 66th St Unit 21-23 Hialeah, FL | 2.0 | 2.0 | 750 | $2,300 | $3.07 | 0d | 1 | 0.49mi |
| 2154 W 60th St #12111 Hialeah, FL | 1.0 | 1.0 | 528 | $1,800 | $3.41 | 0d | 1 | 0.50mi |
| 2232 W 74th Ter Unit 40C Hialeah, FL | 1.0 | 1.0 | 1090 | $1,000 | $0.92 | 9d | 1 | 0.51mi |
| 5644 W 25th Ct #5644 Hialeah, FL | 2.0 | 2.0 | 812 | $2,150 | $2.65 | 19d | 1 | 0.51mi |
HOA detail condo
- Monthly dues
- $45 · $540/yr
- Likely covers
- parking
- Assessments
- None detected in remarks — confirm with the listing agent.
Listing history 15 events
-
2026-06-15status $249,000 Pending 42 DOM
-
2026-06-15days on market $249,000 Active Under Contract 42 DOM
-
2026-06-13days on market $249,000 Active Under Contract 40 DOM
-
2026-06-09days on market $249,000 Active Under Contract 36 DOM
-
2026-06-08days on market $249,000 Active Under Contract 35 DOM
-
2026-06-07days on market $249,000 Active Under Contract 34 DOM
-
2026-06-04days on market $249,000 Active Under Contract 31 DOM
-
2026-06-03days on market $249,000 Active Under Contract 30 DOM
-
2026-06-02days on market $249,000 Active Under Contract 29 DOM
-
2026-06-01days on market $249,000 Active Under Contract 28 DOM
-
2026-05-31days on market $249,000 Active Under Contract 27 DOM
-
2026-05-12historical Active Under Contract
-
2026-05-04$249,000 Active
-
2006-06-01soldstatus $180,000
-
1985-03-01soldstatus $50,000
ⓘ Source: listings_history table (triggers on properties + properties_extension) + one-shot
backfill from property_details.listing_events for pre-trigger history.
Climate risk First Street
- Flood 9/10 Extreme FEMA zone X (unshaded) · 99% chance over 30 yrs
- Wildfire 1/10 Low
- Heat 10/10 Extreme 7 d/yr ≥106°F today · 30 d/yr by 30 yrs out
- Wind 10/10 Extreme 99% chance of damaging wind over 30 yrs
- Air quality 2/10 Low 1 unhealthy d/yr today · 2 by 30 yrs out
Nearby sold comps map
Loading sold comps map…
Walkable amenities ~0.75 mi
Loading nearby amenities…
Taxation est. · year 1
- Rental income
- $27,665
- − Mortgage interest
- −$13,948
- − Property taxes
- −$3,735
- − Insurance
- −$2,042
- − Repairs & maintenance
- −$2,213
- − Management
- −$2,213
- − HOA
- −$540
- − Depreciation
- −$7,244
- Taxable loss
- −$4,271
- Est. tax savings @ 24.0%
- +$1,025
- After-tax cash flow
- $893/yr
For passive investors: Depreciation is non-cash, so a rental often shows a tax loss while cash-flowing — sheltering income. Rental losses are passive: they offset passive income freely, and up to $25,000/yr can offset ordinary (W-2) income if you actively participate and your MAGI is under $100k (phasing out to $0 by $150k); unused losses carry forward. On sale, claimed depreciation is recaptured at up to 25%, and gains may owe capital-gains tax (a 1031 exchange can defer both). Figures are a year-1 estimate at your 24.0% rate — not tax advice; consult a CPA.
Schools (NCES district)
- District
- Miami-Dade
- NCES district ID
- 1200390
- Math proficiency
- 45% ▼ -16.00%
- Reading proficiency
- 54% ▼ -5.00%
- Median HH income
- $43,928
- Composite
- 41.76/100
- National rank
- #3397
- State rank
- #40 of 73 in FL
Livability — Hialeah
- Score
- 74/100
- State rank
- #288
- US rank
- #4774
Category grades
Schools grade is shown separately in the Schools card above.
Census & demographics
- Census place
- Hialeah, FL
- County
- Miami-Dade County · 2,697,751 people
- City population
- 315,776
- Metro
- Miami-Fort Lauderdale-Pompano Beach, FL
- Population (ZIP)
- 45,551
- Household income
- $58,479
- Rent vs Own
- Severe rent burden
- 2779.0
Population outlook (Miami-Dade County) Hauer SSP2
- Today (2025)
- 3,126,439 people
- By 2030
- 3,325,765 · +6.4%
- By 2040
- 3,697,561 · +18.3%
- By 2050
- 4,012,134 · +28.3%
- By 2075
- 4,605,612 · +47.3%
- By 2100
- 4,866,598 · +55.7%
Race, ethnicity, and origin ACS 2023
- Neighborhood character
- Predominantly Hispanic (95%)
- Race & ethnicity
- Hispanic / Latino 95% Two or more races 55% White 3%
- Hispanic origin (detail)
- Puerto Rican 2% Cuban 66% Dominican 3%
- Foreign-born
- 71% · Canada, Jamaica, Dominican Republic
- Languages at home
- 7% English-only · Spanish 92%
Political lean MEDSL · Miami-Dade
- 2024 margin
- R (+11.4) · D 43.9% · R 55.4%
- 2008→2024 swing
- -27.6pp toward R · 2008: 16.1pp · 2024: -11.4pp
- All cycles
- 2024: R+11.4 2020: D+7.3 2016: D+29.6 2012: D+23.7 2008: D+16.1
Not yet ingested
- Civics
- —
Market trends
- HPI YoY
- ▼ -161.68%
- Current HPI
- 308.7622
- Rent YoY
- ▲ 0.17%
- Metro
- Miami-Fort Lauderdale-Pompano Beach, FL
- State GDP YoY
- ▲ 3.28%
- F500 in state
- 36
Industry mix (Fortune 500 HQ in FL)
| Industry | F500 HQs | Revenue |
|---|---|---|
| Industrial Technology | 2 | $29B |
|
||
| Insurance | 2 | $17B |
|
||
| Retail | 1 | $60B |
|
||
| Technology Distribution | 1 | $58B |
|
||
| Homebuilding | 1 | $35B |
|
||
| Technology Manufacturing | 1 | $35B |
|
||
Price history
+398.0% since first listed4 events — show timeline
- 2026-05-12 Contingent — MARMLS
- 2026-05-04 Listed $249,000 MARMLS
- 2006-06-01 Sold (Public Records) $180,000 Public Records
- 1985-03-01 Sold (Public Records) $50,000 Public Records
Property tax history
-2.2%/yrLatest (2025): $168 · +6.2% YoY. Source: county tax records.
Cash-flow waterfall
monthlySold comps — $/sqft
last 12 mo · ≤1 miLoading sold comps…