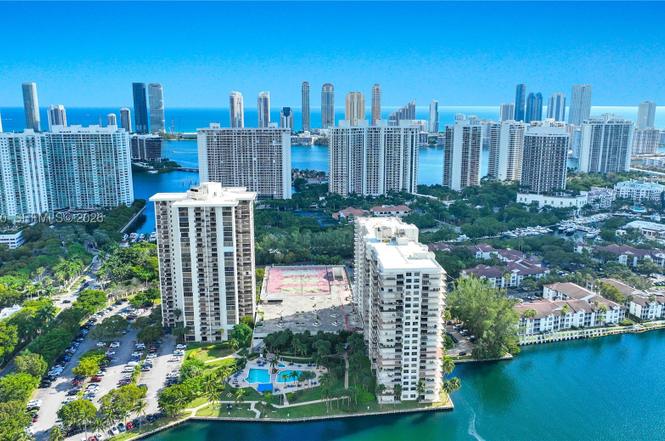
18151 NE 31st Ct #301 · Aventura, FL
Flood risk No data
- FEMA flood zone
- —
- Chance of flooding over 30 yrs
- —
- Est. flood insurance / yr
- —
Fire risk No data
- Est. fire insurance / yr
- —
Heat risk No data
- Hot days now (above threshold)
- —
- Hot days in 30 yrs
- —
Wind risk No data
- Chance of severe wind over 30 yrs
- —
Air-quality risk No data
- Unhealthy air days now
- —
- Unhealthy air days in 30 yrs
- —
Risk factors via First Street. Map © Google.
Why this score? — see what drove the C+ grade
The composite is a weighted blend of 9 inputs, each scored 0–100. Each bar is that input's sub-score; the figure is the points it added to the 100-point composite (weight × sub-score).
- Cash flow +20.6/30.0
- 1% rule +10.0/10.0
- ARV discount +7.5/15.0
- DSCR +6.6/10.0
- Appreciation +5.3/10.0
- Schools +4.2/10.0
- Livability +4.0/5.0
- Rent growth +2.7/5.0
- Condition / age +2.5/5.0
$350,000
🖨 Deal sheet (PDF) 📄 Offer letter ✓ Due diligence
Listing remarks
Bring your imagination to transform this spacious, sun-filled third floor corner unit with southeast exposure. Enjoy relaxing views of foliage and nature just outside the many windows. Huge wraparound balcony with new glass railing. Smooth ceilings throughout, just painted. Eat-in kitchen. Concrete floors ready to be finished. Abundant closets! Extra storage, convenient covered parking space on second floor! Being sold in its as-is condition. New impact windows/sliders & electrical panel to be installed, time to be determined by Association. Please call for special assessment information. Excellent Biscayne Cove Clipper in vibrant Aventura. Highly rated schools Aventura Charter or Wat
Key facts
- New glass railing
- Southeast exposure
- Eat-in kitchen
Tags
Property features AI
Finance
- Financial info: Pets allowed with size limit (maximum 20 lbs)
- HOA & community: Monthly association fee; Association fee covers management, amenities, common areas, cable TV, hot water, structural maintenance, pest control, pool(s), recreation facilities, roof, sewer, security, trash and water; Community of 592 units; Association amenities include billiard room, bike storage, clubhouse, fitness center, laundry, library, barbecue/picnic area, pool, spa/hot tub, storage, transportation service and elevators
Exterior
- Parking: Attached deeded garage; Valet parking available; Designated garage space
- Security: Closed-circuit cameras; Security guard; Fire sprinkler system; Smoke detectors
- Utilities: Cable available; Water and sewer included in association (see HOA details)
- Home design: Condominium / attached property; Southeast facing; Entry on level 3; 1 story unit in a building with multiple stories
- Construction: Block construction; Resale property
- Exterior features: Balcony (open); Exterior lighting; Association heated pool; Seawall; Lakefront
Interior
- Kitchen: Disposal
- Bedrooms: Bedroom on main level
- Flooring: Concrete
- Bathrooms: 2 full bathrooms; 1 half bathroom
- Heating & cooling: Central heating (electric); Central air conditioning (electric); Ceiling fan(s)
- Interior features: Unfurnished; Metal, single-hung and sliding windows; Concrete flooring; Bedroom on main level; Breakfast area; Dual sinks; Garden tub / Roman tub; Combined living and dining room; Main living area on entry level; Tub/shower; Walk-in closet(s); Storage room
- Laundry & utility: Common area laundry
Neighborhood map
What this means for you Summary
Snapshot
- This is a 3-bed/2.0-bath condo listed at $350k.
Deal economics
- At list price, monthly cash flow is $470 ($6k/yr) — positive.
- The deal already cash-flows at list — no discount required.
- Meets the 1% rule at list price ($5k rent vs $350k).
- Recommended offer: $308k (12.0% below list) — sets the bar for market timing.
- Cap rate 7.9% vs local median 2.6% in Aventura — top-decile yield for the area; either an underpriced asset or a hidden risk that comps aren't pricing in. Stress-test before assuming the spread holds.
Location & tenants
- Location reads 80/100 on livability (#127 in FL, #1,834 nationally) — a professional / high-income tenant draw. Strengths: health & safety A+, amenities A, commute A; Watch: crime D+, cost of living F.
- Miami-Dade (suburban): math 45% / reading 54% proficiency, ranked #40 of 73 in FL (top 55%) — families likely to look elsewhere, expect single-tenant / working-renter base with shorter leases; 64% free/reduced lunch — lower-income household profile, screen leases tightly.
- Zoned schools: Aventura Waterways K-8 Center (math 56% / reading 65%, grade B-, #664 of 2,144 statewide, top 32%, 2,168 students, 32% FRL); Highland Oaks Middle School (math 28% / reading 51%, grade F, #373 of 571 statewide, top 66%, 774 students, 50% FRL); Dr. Michael M. Krop Senior High (math 21% / reading 46%, grade F, #400 of 667 statewide, top 61%, 2,235 students, 49% FRL) — zoned schools average 44% FRL vs 64% district-wide (20 pts lower); this property's tenant base skews higher-income than the district average.
- Market conditions: Rents flat; 1879 active listings in the ZIP; 4 comparable units currently listed for rent nearby; rentals leasing fast (median 10d on market — plan ~1-2 weeks tenant-placement turnaround); 10,051 units permitted in Miami-Dade County in 2024 (7,758 in 5+ unit buildings).
- At $5,488/mo this rent would consume 98% of the median local household income ($67k/yr) (locally 3106% of renters already pay >50% of income on rent) — very limited rent-growth headroom before tenants either downsize or default.
Forward outlook
- In year one you build about $4k of equity ($2k loan paydown + $2k appreciation (0.5% local appreciation)).
- Miami-Dade County population projected at +28% by 2050 — long-run rental-demand tailwind backs the buy-and-hold thesis.
- At projected returns (0.5% appreciation + 0.9% rent growth), your $98k cash investment doubles in ~10 years — after that, you're playing with house money.
- By year 7, paydown + projected appreciation supports a ~$31k cash-out refi (75% LTV) — recoverable capital for the next deal without selling this one.
Negotiation context
- It's been on market 154 days — a 12% lower offer ($308k) is reasonable based on typical stale-listing flexibility.
Risks & watch-outs
- Watch-outs: HOA is 26% of rent.
Questions for the listing agent
- It's been on market 154 days. Have you received any prior offers? Is the seller open to a 12% concession, seller financing, or rate buy-down credit?
- What does the HOA fee cover, when was the last increase, and are there any pending special assessments or reserve-fund shortfalls?
- Any open or pending special assessments — roof, HVAC, plumbing, elevator, façade? What's the per-unit balance and payoff schedule, and is the seller paying it off at close or rolling it to the buyer?
- Why hasn't it sold? Are there any deal-killer items the seller is aware of (foundation, flood, title, zoning, code violations)?
- Is there a deadline driving the sale (1031 exchange, divorce, estate, relocation)? That informs how much negotiation room exists.
- Schools are A-rated — typically a magnet for longer-tenancy family renters. What's the average tenant stay here, and is there a school-zone premium baked into asking?
- Crime grade is D in this area — have there been break-ins, vandalism, or insurance claims at this property in the last 3 years? What carrier currently insures it and at what premium?
- What's the average days-on-market for RENTAL listings here right now (not sales)? A rising rental-DOM trend means longer vacancies and softer asking-rent achievability than the comps imply.
- What's the recent tenant-quality profile in this submarket — average credit score on applications, eviction rate, late-payment / NSF rate, and stable-employment percentage? A property-management company in the area should have these aggregated.
- How much new apartment / multifamily construction is in the pipeline within 1–3 miles? Heavy new supply (>2% of stock underway) typically softens rents 12–24 months out; light construction supports rent growth.
Investment metrics
- 1% rule
- 1.57% ✓
- Cap rate
- 7.90%
- Cash-on-cash
- 5.76%
- DSCR
- 1.26
- GRM
- 5.3
CMA / ARV
No comps found within radius.
Projected returns pro-forma
0.53% appreciation · 0.94% rent growth · sell at horizon
- IRR
- 3.9%
- Equity multiple
- 1.19×
- Total profit
- $18,281
- Equity at exit
- $110,948
- IRR
- 6.7%
- Equity multiple
- 1.72×
- Total profit
- $70,569
- Equity at exit
- $141,048
Cash invested: $98,000 (down + closing). Projections, not guarantees.
Landlord ↔ Tenant lean methodology
- Overall (STATE)
- 87 Strongly Landlord-Friendly
- State Florida
- 87 Strongly Landlord-Friendly · R+3
- County
- — inherits STATE
- City
- — inherits STATE
ZIP-level market 33160
- Home prices YoY
- 0.2%
- Rents YoY
- 0.9%
- Active inventory
- 1879
- Price-to-rent
- 5.3×
Monthly cashflow live
- Estimated rent
- $5,488 medium interval (Pro) →
- Mortgage (P&I)
- −$1,835
- Tax from tax record
- −$431 /mo · $5,172/yr
- Insurance
- −$146
- HOA
- −$1,453
- Vacancy / Maint / Mgmt
- −$1,152
- Net cashflow
- $470
Break-even live
Sensitivity live
| Price | -10% $668 | -5% $569 | +0% $470 | +5% $371 | +10% $272 |
|---|---|---|---|---|---|
| Rent | -10% $36 | -5% $253 | +0% $470 | +5% $687 | +10% $904 |
| Rate | -1.0pp $646 | -0.5pp $559 | base $470 | +0.5pp $379 | +1.0pp $287 |
UW: 25.0% down · 7.5% · 30yr · 1.5% tax · 5.0% vac · 8.0% maint · 8.0% mgmt
Financing live
Cash to close
- Down payment
- $87,500
- Closing costs
- $10,500
- Reserves months
- —
- Total cash needed
- —
Loan-product check · same deal, 3 products live
Conventional
25% down · 7.5% · 30yr
- Down + closing
- —
- Monthly P&I
- —
- Monthly cashflow
- —
- DSCR
- —
- Eligible?
- —
Personal DTI + credit; lowest rate.
DSCR
20% down · 8.5% · 30yr
- Down + closing
- —
- Monthly P&I
- —
- Monthly cashflow
- —
- DSCR
- —
- Eligible?
- —
No personal income docs; deal must DSCR.
Hard money
10% down · 12.0% · 12mo
- Down + closing
- —
- Monthly P&I
- —
- Monthly cashflow
- —
- DSCR
- —
- Eligible?
- —
Short-term bridge; refi at stabilization.
Rent comps 4 comps
| Address | Beds | Baths | Sqft | Rent | $/sqft | DOM | Units | Dist |
|---|---|---|---|---|---|---|---|---|
| 17875 Collins Ave Sunny Isles Beach, FL | 3.0 | 3.0–4.0 | 2383 | $22,500 | $9.44 | 0d | 4 | 1.11mi |
| 17141 Collins Ave Sunny Isles Beach, FL | 3.0 | 2.5 | 2042 | $19,000 | $9.30 | 26d | 1 | 1.23mi |
| 17141 Collins Ave #4602 Sunny Isles Beach, FL | 2.0 | 2.5 | 2042 | $25,000 | $12.24 | 9d | 1 | 1.23mi |
| 17141 Collins Ave #4602 Sunny Isles Beach, FL | 2.0 | 2.5 | 2042 | $25,000 | $12.24 | 7d | 1 | 1.23mi |
HOA detail condo
- Monthly dues
- $1,453 · $17,436/yr
- Likely covers
- electric
- ⚠ Special-assessment mentions
-
…New impact windows/sliders & electrical panel to be installed, time to be determined by Association. Please call for special assessment information. Excellent Biscayne Cove Clipper in vibrant Aventura. Highly rated schools Aventura Charter or Wat
Listing history 15 events
-
2026-06-21days on market $350,000 Active 154 DOM
-
2026-06-18days on market $350,000 Active 151 DOM
-
2026-06-17days on market $350,000 Active 150 DOM
-
2026-06-16days on market $350,000 Active 149 DOM
-
2026-06-15days on market $350,000 Active 148 DOM
-
2026-06-13days on market $350,000 Active 146 DOM
-
2026-06-09days on market $350,000 Active 142 DOM
-
2026-06-08days on market $350,000 Active 141 DOM
-
2026-06-07days on market $350,000 Active 140 DOM
-
2026-06-04days on market $350,000 Active 137 DOM
-
2026-06-03days on market $350,000 Active 136 DOM
-
2026-06-02days on market $350,000 Active 135 DOM
-
2026-06-01days on market $350,000 Active 134 DOM
-
2026-05-31days on market $350,000 Active 133 DOM
-
2026-01-15$350,000 Active
ⓘ Source: listings_history table (triggers on properties + properties_extension) + one-shot
backfill from property_details.listing_events for pre-trigger history.
Tax reassessment forecast FL · Resets to sale price
- Current annual tax
- $5,172 · $431/mo
- Projected year-2 tax
- $5,172 · $431/mo
- Expected delta
- $0/yr ($0/mo · 0.0%)
ⓘ Screening estimate from a state-policy table — verify with the county assessor before closing.
Nearby sold comps map
Loading sold comps map…
Walkable amenities ~0.75 mi
Loading nearby amenities…
Taxation est. · year 1
- Rental income
- $65,852
- − Mortgage interest
- −$19,605
- − Property taxes
- −$5,172
- − Insurance
- −$1,750
- − Repairs & maintenance
- −$5,268
- − Management
- −$5,268
- − HOA
- −$17,436
- − Depreciation
- −$10,182
- Taxable income
- $1,171
- Est. tax owed @ 24.0%
- −$281
- After-tax cash flow
- $5,359/yr
For passive investors: Depreciation is non-cash, so a rental often shows a tax loss while cash-flowing — sheltering income. Rental losses are passive: they offset passive income freely, and up to $25,000/yr can offset ordinary (W-2) income if you actively participate and your MAGI is under $100k (phasing out to $0 by $150k); unused losses carry forward. On sale, claimed depreciation is recaptured at up to 25%, and gains may owe capital-gains tax (a 1031 exchange can defer both). Figures are a year-1 estimate at your 24.0% rate — not tax advice; consult a CPA.
Schools (NCES district)
- District
- Miami-Dade
- NCES district ID
- 1200390
- Math proficiency
- 45% ▼ -16.00%
- Reading proficiency
- 54% ▼ -5.00%
- Median HH income
- $43,928
- Composite
- 41.76/100
- National rank
- #3397
- State rank
- #40 of 73 in FL
Livability — Aventura
- Score
- 80/100
- State rank
- #127
- US rank
- #1834
Category grades
Schools grade is shown separately in the Schools card above.
Census & demographics
- Census place
- Aventura, FL
- County
- Miami-Dade County · 2,697,751 people
- City population
- 34,147
- Metro
- Miami-Fort Lauderdale-Pompano Beach, FL
- Population (ZIP)
- 43,718
- Household income
- $67,040
- Rent vs Own
- Severe rent burden
- 3106.0
Population outlook (Miami-Dade County) Hauer SSP2
- Today (2025)
- 3,126,439 people
- By 2030
- 3,325,765 · +6.4%
- By 2040
- 3,697,561 · +18.3%
- By 2050
- 4,012,134 · +28.3%
- By 2075
- 4,605,612 · +47.3%
- By 2100
- 4,866,598 · +55.7%
Race, ethnicity, and origin ACS 2023
- Neighborhood character
- Diverse neighborhood (Simpson 0.59)
- Race & ethnicity
- Hispanic / Latino 46% White 44% Two or more races 27% Black 4% Asian 2%
- Hispanic origin (detail)
- Mexican 1% Puerto Rican 3% Cuban 8% Dominican 1% Salvadoran 4%
- Common ancestry
- Scotch-Irish 8% Hispanic 3% Subsaharan African 3%
- Foreign-born
- 61% · Canada, Jamaica, Dominican Republic
- Languages at home
- 29% English-only · Spanish 45% Russian/Polish/Slavic 12% Other Indo-European 5%
Political lean MEDSL · Miami-Dade
- 2024 margin
- R (+11.4) · D 43.9% · R 55.4%
- 2008→2024 swing
- -27.6pp toward R · 2008: 16.1pp · 2024: -11.4pp
- All cycles
- 2024: R+11.4 2020: D+7.3 2016: D+29.6 2012: D+23.7 2008: D+16.1
Not yet ingested
- Civics
- —
Market trends
- HPI YoY
- ▲ 0.53%
- Current HPI
- 284.9293
- Rent YoY
- ▲ 0.94%
- Metro
- Miami-Fort Lauderdale-Pompano Beach, FL
- State GDP YoY
- ▲ 3.28%
- F500 in state
- 36
Industry mix (Fortune 500 HQ in FL)
| Industry | F500 HQs | Revenue |
|---|---|---|
| Industrial Technology | 2 | $29B |
|
||
| Insurance | 2 | $17B |
|
||
| Retail | 1 | $60B |
|
||
| Technology Distribution | 1 | $58B |
|
||
| Homebuilding | 1 | $35B |
|
||
| Technology Manufacturing | 1 | $35B |
|
||
Price history
1 event — show timeline
- 2026-01-15 Listed $350,000 MARMLS
Property tax history
+3.4%/yrLatest (2025): $5,172 · -0.1% YoY. Source: county tax records.
Cash-flow waterfall
monthlySold comps — $/sqft
last 12 mo · ≤1 miLoading sold comps…