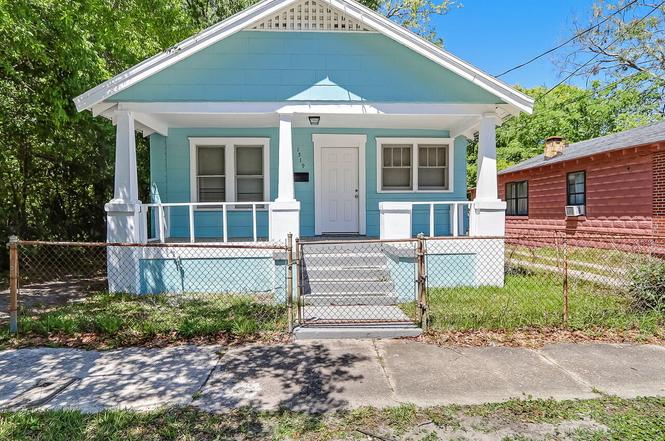
1519 W 6th St · Jacksonville, FL
Flood risk 1/10 · Minimal
- FEMA flood zone
- X (unshaded)
- Chance of flooding over 30 yrs
- 0.0%
- Est. flood insurance / yr
- $507 – $1,088
Fire risk 1/10 · Minimal
- Est. fire insurance / yr
- $947 – $1,759
Heat risk 9/10 · Severe
- Hot days now (above 107°F)
- 7 days/yr
- Hot days in 30 yrs
- 20 days/yr
Wind risk 9/10 · Severe
- Chance of severe wind over 30 yrs
- 99.0%
Air-quality risk 5/10 · Moderate
- Unhealthy air days now
- 7 days/yr
- Unhealthy air days in 30 yrs
- 7 days/yr
Risk factors via First Street. Map © Google.
Why this score? — see what drove the B- grade
The composite is a weighted blend of 9 inputs, each scored 0–100. Each bar is that input's sub-score; the figure is the points it added to the 100-point composite (weight × sub-score).
- Cash flow +26.1/30.0
- ARV discount +10.2/15.0
- DSCR +8.8/10.0
- 1% rule +6.6/10.0
- Livability +4.2/5.0
- Schools +3.9/10.0
- Rent growth +3.0/5.0
- Condition / age +2.5/5.0
- Appreciation +0.0/10.0
$105,000
🖨 Deal sheet (PDF) 📄 Offer letter ✓ Due diligence
Listing remarks MLS
Handyman Special. Great Opportunity to fixup and rent or flip.
Key facts
- Central location
- 4,356 sq ft lot
- Built 1926
Tags
Property features AI
Finance
- HOA & community: Not a senior community
Exterior
- Parking: Off-street parking; On-street parking
- Utilities: Public sewer; Electricity connected; Sewer connected; Water connected
- Home design: Single-family residence; One level (entry level: 1)
- Construction: Frame construction; Shingle roof
- Exterior features: Front porch; Chain link fencing; City street frontage on asphalt road
Interior
- Kitchen: Electric range; Refrigerator
- Bedrooms: 3 bedrooms
- Flooring: Carpet; Vinyl
- Bathrooms: 1 full bathroom
- Heating & cooling: Central heating (electric); Central air conditioning (electric)
- Interior features: Eat-in kitchen; Primary bathroom with tub and shower; Partially furnished
- Laundry & utility: In-unit laundry with washer hookup and electric dryer hookup
Neighborhood map
What this means for you Summary
Snapshot
- This is a 3-bed/1.0-bath single-family listed at $105k.
Deal economics
- At list price, monthly cash flow is $265 ($3k/yr) — positive.
- The deal already cash-flows at list — no discount required.
- Meets the 1% rule at list price ($1k rent vs $105k).
- Recommended offer: $92k (12.0% below list) — sets the bar for market timing.
- Cap rate 9.3% vs local median 4.0% in Jacksonville — top-decile yield for the area; either an underpriced asset or a hidden risk that comps aren't pricing in. Stress-test before assuming the spread holds.
Location & tenants
- Location reads 83/100 on livability (#50 in FL, #911 nationally) — a professional / high-income tenant draw. Strengths: amenities A+, commute A+, housing A+.
- Duval (urban): math 46% / reading 45% proficiency, ranked #48 of 73 in FL (top 66%) — families likely to look elsewhere, expect single-tenant / working-renter base with shorter leases.
- Market conditions: Rents rising (+1.8%/yr); 394 active listings in the ZIP; 40 comparable units currently listed for rent nearby; rentals at typical pace (median 24d on market — plan ~3-4 weeks tenant-placement turnaround); lower-income renter base — watch delinquency; 6,503 units permitted in Duval County in 2024 (1,131 in 5+ unit buildings).
- At $1,219/mo this rent would consume 48% of the median local household income ($31k/yr) (locally 2921% of renters already pay >50% of income on rent) — very limited rent-growth headroom before tenants either downsize or default.
Forward outlook
- Local home prices are declining (-3.0%/yr); year-one equity from $726 of loan paydown is wiped out by about $3k of value loss. Plan a longer hold.
- Duval County population projected at +19% by 2050 — long-run rental-demand tailwind backs the buy-and-hold thesis.
Negotiation context
- It's been on market 177 days — a 12% lower offer ($92k) is reasonable based on typical stale-listing flexibility.
- 11 sale attempts since 23y ago; this cycle's ask is 18% above the opening price — seller raised mid-cycle; expect resistance to lowballs.
Risks & watch-outs
- Watch-outs: built in 1926 — expect roof / HVAC / electrical / plumbing capex.
- Climate carrying-cost: severe wind risk, 99% chance of damaging wind over 30y; extreme-heat days projected 7→20/yr by 2055 (HVAC capex compounding) — expect insurance premiums to compound above CPI over the hold.
Questions for the listing agent
- It's been on market 177 days. Have you received any prior offers? Is the seller open to a 12% concession, seller financing, or rate buy-down credit?
- Built in 1926 — when were the roof, HVAC, electrical panel, plumbing, and water heater last replaced?
- Why hasn't it sold? Are there any deal-killer items the seller is aware of (foundation, flood, title, zoning, code violations)?
- Is there a deadline driving the sale (1031 exchange, divorce, estate, relocation)? That informs how much negotiation room exists.
- Schools are B-rated — typically a magnet for longer-tenancy family renters. What's the average tenant stay here, and is there a school-zone premium baked into asking?
- What's the average days-on-market for RENTAL listings here right now (not sales)? A rising rental-DOM trend means longer vacancies and softer asking-rent achievability than the comps imply.
- What's the recent tenant-quality profile in this submarket — average credit score on applications, eviction rate, late-payment / NSF rate, and stable-employment percentage? A property-management company in the area should have these aggregated.
- How much new for-sale + rental construction is in the pipeline within 1–3 miles? Heavy new supply typically softens prices + rents 12–24 months out; constrained supply supports both.
Investment metrics
- 1% rule
- 1.16% ✓
- Cap rate
- 9.32%
- Cash-on-cash
- 10.82%
- DSCR
- 1.48
- GRM
- 7.2
CMA / ARV
- ARV (on-the-fly)
- $111,725
- Comps found
- 12
Show comp detail 12 sales within ~0.75 mi
| Address | Dist | Beds/Ba | Sqft | Sold | Price | $/sf | Match |
|---|---|---|---|---|---|---|---|
| 1519 8th St W | 0.20mi | 3/1.0 | 996 (-3%) | 0mo | $20,000 | $20 | 86 |
| 1550 W 2nd St | 0.29mi | 3/2.0 | 972 (-5%) | 2mo | $123,500 | $127 | 72 |
| 1116 Fairfax St | 0.49mi | 3/1.0 | 1,000 (-2%) | 2mo | $173,017 | $173 | 71 |
| 1731 W 12th St | 0.53mi | 2/1.0 (-1) | 1,026 (+0%) | 4mo | $40,000 | $39 | 67 |
| 1725 Seminary St | 0.58mi | 3/1.0 | 996 (-3%) | 3mo | $88,000 | $88 | 66 |
| 1314 Rushing St | 0.20mi | 3/2.0 | 1,147 (+12%) | 4mo | $183,000 | $160 | 64 |
| 1480 N Myrtle Ave N | 0.27mi | 2/1.0 (-1) | 916 (-11%) | 2mo | $60,000 | $66 | 63 |
| 1327 7th St W | 0.25mi | 3/2.0 | 1,152 (+12%) | 2mo | $215,017 | $187 | 62 |
| 1783 W 10th St | 0.50mi | 3/2.0 | 1,084 (+6%) | 3mo | $211,020 | $195 | 60 |
| 1526 W 14th St | 0.53mi | 3/1.0 | 916 (-11%) | 3mo | $95,000 | $104 | 56 |
| 1404 W 18th St | 0.72mi | 3/1.0 | 1,120 (+9%) | 2mo | $80,000 | $71 | 49 |
| 2715 Myrtle Ave N | 0.74mi | 2/1.0 (-1) | 900 (-12%) | 3mo | $98,000 | $109 | 38 |
Match score weights: distance 35% · size 25% · config 20% · recency 20%. Top-matched comps best support the ARV.
Projected returns pro-forma
-3.0% appreciation · 1.81% rent growth · sell at horizon
- IRR
- -1.4%
- Equity multiple
- 0.95×
- Total profit
- $-1,579
- Equity at exit
- $15,656
- IRR
- 7.0%
- Equity multiple
- 1.50×
- Total profit
- $14,584
- Equity at exit
- $9,078
Cash invested: $29,400 (down + closing). Projections, not guarantees.
Landlord ↔ Tenant lean methodology
- Overall (STATE)
- 87 Strongly Landlord-Friendly
- State Florida
- 87 Strongly Landlord-Friendly · R+3
- County
- — inherits STATE
- City
- — inherits STATE
ZIP-level market 32209
- Home prices YoY
- -22.1%
- Rents YoY
- 1.8%
- Active inventory
- 394
- Price-to-rent
- 7.2×
Monthly cashflow live
- Estimated rent
- $1,219 high interval (Pro) →
- Mortgage (P&I)
- −$551
- Tax from tax record
- −$103 /mo · $1,241/yr
- Insurance
- −$44
- HOA
- −$0
- Vacancy / Maint / Mgmt
- −$256
- Net cashflow
- $265
Break-even live
Sensitivity live
| Price | -10% $324 | -5% $295 | +0% $265 | +5% $235 | +10% $206 |
|---|---|---|---|---|---|
| Rent | -10% $169 | -5% $217 | +0% $265 | +5% $313 | +10% $361 |
| Rate | -1.0pp $318 | -0.5pp $292 | base $265 | +0.5pp $238 | +1.0pp $210 |
UW: 25.0% down · 7.5% · 30yr · 1.5% tax · 5.0% vac · 8.0% maint · 8.0% mgmt
Financing live
Cash to close
- Down payment
- $26,250
- Closing costs
- $3,150
- Reserves months
- —
- Total cash needed
- —
Loan-product check · same deal, 3 products live
Conventional
25% down · 7.5% · 30yr
- Down + closing
- —
- Monthly P&I
- —
- Monthly cashflow
- —
- DSCR
- —
- Eligible?
- —
Personal DTI + credit; lowest rate.
DSCR
20% down · 8.5% · 30yr
- Down + closing
- —
- Monthly P&I
- —
- Monthly cashflow
- —
- DSCR
- —
- Eligible?
- —
No personal income docs; deal must DSCR.
Hard money
10% down · 12.0% · 12mo
- Down + closing
- —
- Monthly P&I
- —
- Monthly cashflow
- —
- DSCR
- —
- Eligible?
- —
Short-term bridge; refi at stabilization.
Rent comps 40 comps
| Address | Beds | Baths | Sqft | Rent | $/sqft | DOM | Units | Dist |
|---|---|---|---|---|---|---|---|---|
| 1478 W 5th St Jacksonville, FL | 3.0 | 1.0 | 960 | $1,225 | $1.28 | 5d | 1 | 0.07mi |
| 1478 W 5th St Jacksonville, FL | 3.0 | 1.0 | 960 | $1,225 | $1.28 | 24d | 1 | 0.07mi |
| 1460 W 5th St Unit 1 Jacksonville, FL | 2.0 | 1.0 | 700 | $850 | $1.21 | 12d | 1 | 0.09mi |
| 1537 7th St W Unit B Jacksonville, FL | 3.0 | 1.0 | 950 | $1,050 | $1.11 | 24d | 1 | 0.13mi |
| 1537 W 7th St Jacksonville, FL | 3.0 | 1.0 | 950 | $1,050 | $1.11 | 8d | 1 | 0.13mi |
| 1570 Mc Conihe St Unit B Jacksonville, FL | 2.0 | 1.0 | 714 | $875 | $1.23 | 24d | 1 | 0.18mi |
| 1437 Prince St Unit 1437 Jacksonville, FL | 2.0 | 1.0 | 700 | $1,120 | $1.60 | 24d | 1 | 0.18mi |
| 1355 Grothe St Jacksonville, FL | 4.0 | 1.0 | 1312 | $1,350 | $1.03 | 18d | 1 | 0.19mi |
| 1640 W 4th St Unit 1 Jacksonville, FL | 4.0 | 2.0 | 1119 | $1,675 | $1.50 | 20d | 1 | 0.23mi |
| 1538 Ella St Unit 1 Jacksonville, FL | 2.0 | 1.0 | 700 | $1,100 | $1.57 | 24d | 1 | 0.25mi |
| 1464 N Myrtle Ave Jacksonville, FL | 2.0 | 1.0 | 1136 | $1,400 | $1.23 | 24d | 1 | 0.26mi |
| 1666 Myrtle Ave N Unit 1666 Jacksonville, FL | 2.0 | 1.0 | 700 | $925 | $1.32 | 24d | 1 | 0.27mi |
| 1376 Prince St Jacksonville, FL | 2.0 | 1.0 | 800 | $1,050 | $1.31 | 8d | 1 | 0.27mi |
| 1358 Prince St Jacksonville, FL | 3.0 | 2.5 | 1044 | $1,350 | $1.29 | 24d | 1 | 0.30mi |
| 1358 Prince St Jacksonville, FL | 3.0 | 3.5 | 1044 | $1,350 | $1.29 | 22d | 1 | 0.30mi |
| 1710 W 2nd St Unit A Jacksonville, FL | 2.0 | 1.0 | 939 | $800 | $0.85 | 24d | 1 | 0.38mi |
| 1788 W 5th St Jacksonville, FL | 3.0 | 2.0 | 948 | $1,295 | $1.37 | 24d | 1 | 0.38mi |
| 1470 Windle St Jacksonville, FL | 3.0 | 2.0 | 1170 | $1,425 | $1.22 | 15d | 1 | 0.40mi |
| 1783 W 3rd St Jacksonville, FL | 3.0 | 1.0 | 816 | $650 | $0.80 | 24d | 1 | 0.40mi |
| 1230 W 3rd St Jacksonville, FL | 2.0 | 1.0 | 750 | $950 | $1.27 | 24d | 3 | 0.40mi |
| 844 Tyler St Unit 1 Jacksonville, FL | 2.0 | 1.0 | 800 | $900 | $1.12 | 8d | 1 | 0.42mi |
| 1740 W 9th St Jacksonville, FL | 4.0 | 2.0 | 1148 | $1,285 | $1.12 | 21d | 1 | 0.42mi |
| 1448 Union St W Jacksonville, FL | 3.0 | 1.0 | 958 | $1,200 | $1.25 | 24d | 1 | 0.43mi |
| 1539 Union St W Jacksonville, FL | 3.0 | 1.5 | 1000 | $1,144 | $1.14 | 14d | 1 | 0.45mi |
| 1545 Union St W Jacksonville, FL | 3.0 | 2.0 | 1253 | $1,400 | $1.12 | 3d | 1 | 0.46mi |
| 1425 Morgan St Jacksonville, FL | 2.0 | 1.0 | 850 | $650 | $0.76 | 4d | 1 | 0.48mi |
| 1607 Logan St Jacksonville, FL | 4.0 | 2.0 | 1232 | $1,800 | $1.46 | 24d | 1 | 0.51mi |
| 1657 Union St W Unit 1 Jacksonville, FL | 2.0 | 1.0 | 700 | $1,050 | $1.50 | 2d | 1 | 0.52mi |
| 1319 Woods St Jacksonville, FL | 3.0 | 2.0 | 1103 | $1,221 | $1.11 | 24d | 1 | 0.53mi |
| 1866 W 6th St Jacksonville, FL | 3.0 | 1.0 | 1064 | $1,120 | $1.05 | 4d | 1 | 0.57mi |
| 1776 Spires Ave Unit 2 Jacksonville, FL | 2.0 | 1.0 | 800 | $1,125 | $1.41 | 5d | 1 | 0.57mi |
| 1454 Francis St Jacksonville, FL | 3.0 | 2.0 | 1084 | $1,243 | $1.15 | 24d | 1 | 0.59mi |
| 1046 W 8th St Jacksonville, FL | 2.0 | 1.0 | 750 | $900 | $1.20 | 24d | 1 | 0.61mi |
| 1525 W 15th St Jacksonville, FL | 3.0 | 1.0 | 1100 | $1,245 | $1.13 | 24d | 1 | 0.62mi |
| 1934 Ella St Jacksonville, FL | 3.0 | 1.0 | 1045 | $1,095 | $1.05 | 21d | 1 | 0.62mi |
| 1320 Francis St Jacksonville, FL | 2.0 | 2.0 | 1003 | $1,095 | $1.09 | 24d | 1 | 0.63mi |
| 1024 8th St W Jacksonville, FL | 2.0 | 1.0 | 816 | $950 | $1.16 | 24d | 1 | 0.63mi |
| 1911 W 3rd St Jacksonville, FL | 3.0 | 1.0 | 912 | $1,050 | $1.15 | 5d | 1 | 0.63mi |
| 1751 Broadway Ave Jacksonville, FL | 2.0 | 1.0 | 1000 | $1,525 | $1.52 | 5d | 1 | 0.63mi |
| 2306 Fairfax St Unit 3 Jacksonville, FL | 2.0 | 1.0 | 700 | $650 | $0.93 | 24d | 1 | 0.64mi |
Listing history 44 events
-
2026-06-10days on market $105,000 Active 177 DOM
-
2026-06-08days on market $105,000 Active 176 DOM
-
2026-06-08days on market $105,000 Active 175 DOM
-
2026-06-03days on market $105,000 Active 171 DOM
-
2026-06-02days on market $105,000 Active 170 DOM
-
2026-06-01days on market $105,000 Active 169 DOM
-
2026-05-31days on market $105,000 Active 168 DOM
-
2026-05-14price $110,000
-
2026-05-08status Active
-
2026-05-06historical
-
2026-04-15status Active
-
2026-03-24historical
-
2026-03-18price $112,500
-
2026-03-12price $115,000
-
2026-02-09status Active
-
2025-12-01historical
-
2025-12-01price $119,000
-
2025-11-18price $77,000
-
2025-11-13price $78,000
-
2025-11-04price $79,000
-
2025-10-28price $80,000
-
2025-10-09price $85,000
-
2025-10-04status Active
-
2025-10-03historical Active Under Contract
-
2025-09-30price $88,000
-
2025-09-11$89,000 Active
-
2025-08-26soldstatus $1,750,000
-
2025-08-26soldstatus $1,750,000
-
2025-04-29soldstatus $958,345
-
2016-10-27historical
-
2016-03-14$22,000
-
2014-05-14historical 63-char remark
Show marketing remark (63 chars)
Handyman Special. Great Opportunity to fixup and rent or flip.
-
2013-10-16$17,000 63-char remark
Show marketing remark (63 chars)
Handyman Special. Great Opportunity to fixup and rent or flip.
-
2008-07-14historical
-
2007-11-14$60,000
-
2005-08-22historical
-
2005-08-10soldstatus $51,050
-
2005-05-30historical
-
2005-02-27$79,900
-
2005-02-08$49,900
-
2004-03-11historical
-
2004-01-29soldstatus $27,650
-
2003-12-13$29,900
-
1998-01-21soldstatus $14,200
ⓘ Source: listings_history table (triggers on properties + properties_extension) + one-shot
backfill from property_details.listing_events for pre-trigger history.
Tax reassessment forecast FL · Resets to sale price
- Current annual tax
- $1,241 · $103/mo
- Projected year-2 tax
- $1,241 · $103/mo
- Expected delta
- $0/yr ($0/mo · 0.0%)
ⓘ Screening estimate from a state-policy table — verify with the county assessor before closing.
Climate risk First Street
- Flood 1/10 Low FEMA zone X (unshaded) · 0% chance over 30 yrs
- Wildfire 1/10 Low
- Heat 9/10 Extreme 7 d/yr ≥107°F today · 20 d/yr by 30 yrs out
- Wind 9/10 Extreme 99% chance of damaging wind over 30 yrs
- Air quality 5/10 Major 7 unhealthy d/yr today · 7 by 30 yrs out
Nearby sold comps map
Loading sold comps map…
Walkable amenities ~0.75 mi
Loading nearby amenities…
Taxation est. · year 1
- Rental income
- $14,624
- − Mortgage interest
- −$5,882
- − Property taxes
- −$1,241
- − Insurance
- −$525
- − Repairs & maintenance
- −$1,170
- − Management
- −$1,170
- − Depreciation
- −$3,055
- Taxable income
- $1,582
- Est. tax owed @ 24.0%
- −$380
- After-tax cash flow
- $2,800/yr
For passive investors: Depreciation is non-cash, so a rental often shows a tax loss while cash-flowing — sheltering income. Rental losses are passive: they offset passive income freely, and up to $25,000/yr can offset ordinary (W-2) income if you actively participate and your MAGI is under $100k (phasing out to $0 by $150k); unused losses carry forward. On sale, claimed depreciation is recaptured at up to 25%, and gains may owe capital-gains tax (a 1031 exchange can defer both). Figures are a year-1 estimate at your 24.0% rate — not tax advice; consult a CPA.
Schools (NCES district)
- District
- Duval
- NCES district ID
- 1200480
- Math proficiency
- 46% ▼ -11.00%
- Reading proficiency
- 45% ▼ -4.00%
- Median HH income
- $48,987
- Composite
- 38.97/100
- National rank
- #4076
- State rank
- #48 of 73 in FL
Livability — Jacksonville
- Score
- 83/100
- State rank
- #50
- US rank
- #911
Category grades
Schools grade is shown separately in the Schools card above.
Census & demographics
- Census place
- Jacksonville, FL
- County
- Duval County · 1,015,274 people
- City population
- 979,034
- Metro
- Jacksonville, FL
- Population (ZIP)
- 34,657
- Household income
- $30,514
- Rent vs Own
- Severe rent burden
- 2921.0
Population outlook (Duval County) Hauer SSP2
- Today (2025)
- 1,013,010 people
- By 2030
- 1,059,228 · +4.6%
- By 2040
- 1,141,439 · +12.7%
- By 2050
- 1,205,258 · +19.0%
- By 2075
- 1,324,282 · +30.7%
- By 2100
- 1,319,620 · +30.3%
Race, ethnicity, and origin ACS 2023
- Neighborhood character
- Predominantly Black (88%)
- Race & ethnicity
- Black 88% White 5% Hispanic / Latino 5% Two or more races 2%
- Hispanic origin (detail)
- Puerto Rican 3%
- Common ancestry
- Hispanic 1% Romanian 1%
- Foreign-born
- 3% · Canada
- Languages at home
- 95% English-only · Spanish 4% French/Haitian/Cajun 1%
Political lean MEDSL · Duval
- 2024 margin
- Toss-up / Even · D 48.7% · R 50.1% · Other 1.2%
- 2008→2024 swing
- +0.4pp no change · 2008: -1.9pp · 2024: -1.5pp
- All cycles
- 2024: R+1.5 2020: D+3.8 2016: R+1.5 2012: R+3.6 2008: R+1.9
Not yet ingested
- Civics
- —
Market trends
- HPI YoY
- ▼ -53.92%
- Current HPI
- 189.5977
- Rent YoY
- ▲ 1.81%
- Metro
- Jacksonville, FL
- State GDP YoY
- ▲ 3.28%
- F500 in state
- 36
Industry mix (Fortune 500 HQ in FL)
| Industry | F500 HQs | Revenue |
|---|---|---|
| Industrial Technology | 2 | $29B |
|
||
| Insurance | 2 | $17B |
|
||
| Retail | 1 | $60B |
|
||
| Technology Distribution | 1 | $58B |
|
||
| Homebuilding | 1 | $35B |
|
||
| Technology Manufacturing | 1 | $35B |
|
||
Price history
+674.6% since first listed37 events — show timeline
- 2026-05-14 Price Changed $110,000 realMLS
- 2026-05-08 Relisted — realMLS
- 2026-05-06 Listing Removed — realMLS
- 2026-04-15 Relisted — realMLS
- 2026-03-24 Listing Removed — realMLS
- 2026-03-18 Price Changed $112,500 realMLS
- 2026-03-12 Price Changed $115,000 realMLS
- 2026-02-09 Relisted — realMLS
- 2025-12-01 Price Changed $119,000 realMLS
- 2025-12-01 Listing Removed — realMLS
- 2025-11-18 Price Changed $77,000 realMLS
- 2025-11-13 Price Changed $78,000 realMLS
- 2025-11-04 Price Changed $79,000 realMLS
- 2025-10-28 Price Changed $80,000 realMLS
- 2025-10-09 Price Changed $85,000 realMLS
- 2025-10-04 Relisted — realMLS
- 2025-10-03 Contingent — realMLS
- 2025-09-30 Price Changed $88,000 realMLS
- 2025-09-11 Listed $89,000 realMLS
- 2025-08-26 Sold (Public Records) $1,750,000 Public Records
- 2025-08-26 Sold (Public Records) $1,750,000 Public Records
- 2025-04-29 Sold (Public Records) $958,345 Public Records
- 2016-10-27 Listing Removed — Stellar MLS as Distributed by MLS Grid
- 2016-03-14 Listed $22,000 Stellar MLS as Distributed by MLS Grid
- 2014-05-14 Listing Removed — realMLS
- 2013-10-16 Listed $17,000 realMLS
- 2008-07-14 Listing Removed — realMLS
- 2007-11-14 Listed $60,000 realMLS
- 2005-08-22 Listing Removed — realMLS
- 2005-08-10 Sold (MLS) $51,050 realMLS
- 2005-05-30 Listing Removed — realMLS
- 2005-02-27 Listed $79,900 realMLS
- 2005-02-08 Listed $49,900 realMLS
- 2004-03-11 Listing Removed — realMLS
- 2004-01-29 Sold (MLS) $27,650 realMLS
- 2003-12-13 Listed $29,900 realMLS
- 1998-01-21 Sold (Public Records) $14,200 Public Records
Property tax history
+10.2%/yrLatest (2025): $1,241 · +29.5% YoY. Source: county tax records.
Cash-flow waterfall
monthlySold comps — $/sqft
last 12 mo · ≤1 miLoading sold comps…