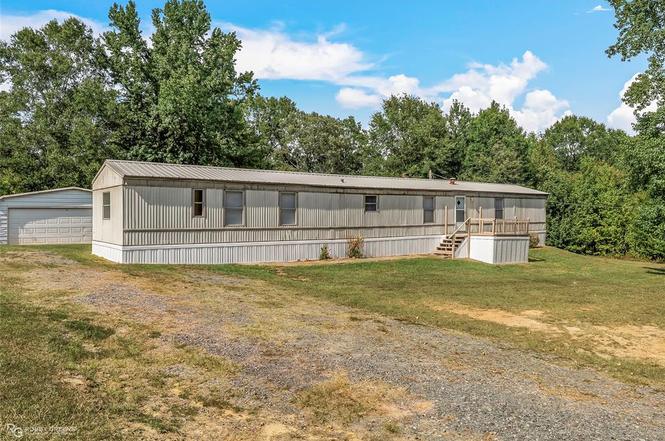
214 Springs Rd · Frierson, LA
Flood risk 1/10 · Minimal
- FEMA flood zone
- X (unshaded)
- Chance of flooding over 30 yrs
- 0.0%
- Est. flood insurance / yr
- $507 – $1,088
Fire risk 4/10 · Minor
- Est. fire insurance / yr
- $1,269 – $2,357
Heat risk 7/10 · Major
- Hot days now (above 110°F)
- 7 days/yr
- Hot days in 30 yrs
- 22 days/yr
Wind risk 6/10 · Moderate
- Chance of severe wind over 30 yrs
- 74.0%
Air-quality risk 2/10 · Minimal
- Unhealthy air days now
- 1 days/yr
- Unhealthy air days in 30 yrs
- 1 days/yr
Risk factors via First Street. Map © Google.
Why this score? — see what drove the B grade
The composite is a weighted blend of 9 inputs, each scored 0–100. Each bar is that input's sub-score; the figure is the points it added to the 100-point composite (weight × sub-score).
- Cash flow +30.0/30.0
- 1% rule +10.0/10.0
- DSCR +10.0/10.0
- ARV discount +7.6/15.0
- Appreciation +5.0/10.0
- Schools +3.5/10.0
- Rent growth +2.5/5.0
- Condition / age +2.5/5.0
- Livability +2.1/5.0
$59,000
🖨 Deal sheet (PDF) 📄 Offer letter ✓ Due diligence
Listing remarks
Three bed two bath home located in NORTH DESOTO SCHOOL district, NEW PAINT, NEW FLOORS, NEW METAL ROOF, NEW SKIRTING, NEW EVERYTHING ON THE SEPTIC SYSTEM AND IT HAS BEEN PUMPED RECENTLY. This is a good one close to Shreveport for work or shopping but still in Desoto parish and in that GREAT SCHOOL DISTRICT !!
Key facts
- New floors
- New paint
- New skirting
Tags
Property features AI
Finance
- Other: Lot roughly 0.6 acre (.5 to <1 acre); Will not subdivide
- Financial info: Listing terms include Cash, Conventional, FHA
- HOA & community: No homeowners association
Exterior
- Parking: 2 covered parking spaces; 2-car garage with single doors; Garage includes storage; Garage dimensions approximately 25' wide by 20' deep
- Security: Smoke detector(s)
- Utilities: City water; Electricity connected; Natural gas available; Septic
- Home design: Residential mobile home; One story; Not attached to another property; Subdivision: Ellerbe Spgs
- Construction: Built in 1999; Vinyl siding; Metal roof; Pillar/post/pier foundation
- Exterior features: Front porch; Rear porch
Interior
- Kitchen: Dishwasher; Gas range; Refrigerator
- Bedrooms: 3 bedrooms (all on the main level); Primary bedroom on main level
- Flooring: Carpet; Laminate
- Bathrooms: 2 full bathrooms (both on the main level)
- Heating & cooling: Central heating (natural gas); Central electric air conditioning
- Interior features: 8 total rooms; One-level layout; Living area includes 1 living room and 1 dining area; Wood-burning fireplace; Other interior features
- Laundry & utility: Separate utility room; Laundry in utility room
Neighborhood map
What this means for you Summary
Snapshot
- This is a 3-bed/2.0-bath manufactured listed at $59k.
Deal economics
- At list price, monthly cash flow is $1k ($12k/yr) — positive.
- The deal already cash-flows at list — no discount required.
- Meets the 1% rule at list price ($2k rent vs $59k).
- Recommended offer: $52k (12.0% below list) — sets the bar for market timing.
Location & tenants
- Location reads 43/100 on livability (#458 in LA) — a working-class tenant base; expect higher turnover. Strengths: cost of living A+, crime A; Watch: amenities F, commute F, employment F.
- Desoto Parish (rural): math 35% / reading 48% proficiency, ranked #21 of 98 in LA (top 21%) — families likely to look elsewhere, expect single-tenant / working-renter base with shorter leases.
- Zoned schools: North Desoto Upper Elementary School (math 32% / reading 49%, grade F, #218 of 646 statewide, top 34%, 808 students, 34% FRL); North Desoto Middle School 6-8 (math 57% / reading 68%, grade B+, #12 of 218 statewide, top 5%, 600 students, 38% FRL); North Desoto High School (math 62% / reading 61%, grade B-, #18 of 265 statewide, top 6%, 836 students, 36% FRL) — zoned schools average 36% FRL vs 59% district-wide (23 pts lower); this property's tenant base skews higher-income than the district average.
- Zoned-school proficiency averages 55% at this address vs 42% district-wide (+13 pts) — the actual schools serving this property are materially stronger than the Desoto Parish average implies; a family-tenant draw the district grade alone would hide.
- Market conditions: 19 active listings in the ZIP; 113 units permitted in De Soto Parish in 2024 (0 in 5+ unit buildings).
Forward outlook
- In year one you build about $2k of equity ($408 loan paydown + $2k appreciation (3.0% local appreciation)).
- De Soto County population projected at +8% by 2050 — modest demand growth; plan on rents tracking national, not racing it.
- At projected returns (3.0% appreciation + 3.0% rent growth), your $17k cash investment doubles in ~2 years — after that, you're playing with house money.
Negotiation context
- It's been on market 297 days — a 12% lower offer ($52k) is reasonable based on typical stale-listing flexibility.
Risks & watch-outs
- Climate carrying-cost: major wind risk, 74% chance of damaging wind over 30y; extreme-heat days projected 7→22/yr by 2055 (HVAC capex compounding) — expect insurance premiums to compound above CPI over the hold.
Questions for the listing agent
- It's been on market 297 days. Have you received any prior offers? Is the seller open to a 12% concession, seller financing, or rate buy-down credit?
- Why hasn't it sold? Are there any deal-killer items the seller is aware of (foundation, flood, title, zoning, code violations)?
- Is there a deadline driving the sale (1031 exchange, divorce, estate, relocation)? That informs how much negotiation room exists.
- What's the average days-on-market for RENTAL listings here right now (not sales)? A rising rental-DOM trend means longer vacancies and softer asking-rent achievability than the comps imply.
- What's the recent tenant-quality profile in this submarket — average credit score on applications, eviction rate, late-payment / NSF rate, and stable-employment percentage? A property-management company in the area should have these aggregated.
- How much new for-sale + rental construction is in the pipeline within 1–3 miles? Heavy new supply typically softens prices + rents 12–24 months out; constrained supply supports both.
Investment metrics
- 1% rule
- 2.91% ✓
- Cap rate
- 26.77%
- Cash-on-cash
- 73.15%
- DSCR
- 4.25
- GRM
- 2.9
CMA / ARV
- ARV (on-the-fly)
- $59,168
- Comps found
- 4
Show comp detail 4 sales within ~0.75 mi
| Address | Dist | Beds/Ba | Sqft | Sold | Price | $/sf | Match |
|---|---|---|---|---|---|---|---|
| 214 Springs Rd | 0.00mi | 3/2.0 | 1,376 (0%) | 0mo | $59,000 | $43 | 100 |
| 243 Spring Rd | 0.07mi | 3/2.0 | 1,192 (-13%) | 1mo | $100,000 | $84 | 74 |
| 161 Springs Rd | 0.09mi | 3/2.5 | 1,200 (-13%) | 17mo | $50,000 | $42 | 59 |
| 146 Warren | 0.13mi | 2/2.0 (-1) | 1,200 (-13%) | 17mo | $50,000 | $42 | 54 |
Match score weights: distance 35% · size 25% · config 20% · recency 20%. Top-matched comps best support the ARV.
Projected returns pro-forma
3.0% appreciation · 3.0% rent growth · sell at horizon
- IRR
- 77.7%
- Equity multiple
- 5.31×
- Total profit
- $71,233
- Equity at exit
- $26,529
- IRR
- 77.2%
- Equity multiple
- 10.91×
- Total profit
- $163,691
- Equity at exit
- $40,884
Cash invested: $16,520 (down + closing). Projections, not guarantees.
Landlord ↔ Tenant lean methodology
- Overall (STATE)
- 90 Strongly Landlord-Friendly
- State Louisiana
- 90 Strongly Landlord-Friendly · R+12
- County
- — inherits STATE
- City
- — inherits STATE
ZIP-level market 71027
- Active inventory
- 19
- Price-to-rent
- 2.9×
Monthly cashflow live
- Estimated rent
- $1,714 medium interval (Pro) →
- Mortgage (P&I)
- −$309
- Tax from tax record
- −$13 /mo · $160/yr
- Insurance
- −$25
- HOA
- −$0
- Vacancy / Maint / Mgmt
- −$360
- Net cashflow
- $1,007
Break-even live
Sensitivity live
| Price | -10% $1,040 | -5% $1,024 | +0% $1,007 | +5% $990 | +10% $974 |
|---|---|---|---|---|---|
| Rent | -10% $872 | -5% $939 | +0% $1,007 | +5% $1,075 | +10% $1,142 |
| Rate | -1.0pp $1,037 | -0.5pp $1,022 | base $1,007 | +0.5pp $992 | +1.0pp $976 |
UW: 25.0% down · 7.5% · 30yr · 1.5% tax · 5.0% vac · 8.0% maint · 8.0% mgmt
Financing live
Cash to close
- Down payment
- $14,750
- Closing costs
- $1,770
- Reserves months
- —
- Total cash needed
- —
Loan-product check · same deal, 3 products live
Conventional
25% down · 7.5% · 30yr
- Down + closing
- —
- Monthly P&I
- —
- Monthly cashflow
- —
- DSCR
- —
- Eligible?
- —
Personal DTI + credit; lowest rate.
DSCR
20% down · 8.5% · 30yr
- Down + closing
- —
- Monthly P&I
- —
- Monthly cashflow
- —
- DSCR
- —
- Eligible?
- —
No personal income docs; deal must DSCR.
Hard money
10% down · 12.0% · 12mo
- Down + closing
- —
- Monthly P&I
- —
- Monthly cashflow
- —
- DSCR
- —
- Eligible?
- —
Short-term bridge; refi at stabilization.
Listing history 12 events
-
2026-06-07statusdays on market $59,000 Pending 297 DOM
-
2026-06-02days on market $59,000 Active 294 DOM
-
2026-06-01days on market $59,000 Active 293 DOM
-
2026-05-31days on market $59,000 Active 292 DOM
-
2026-05-30days on market $59,000 Active 291 DOM
-
2026-05-16price $59,000
-
2026-01-06price $64,000
-
2025-11-12price $79,000
-
2025-10-06price $89,000
-
2025-09-02price $98,000
-
2025-08-12$110,000 Active
-
2007-09-04soldstatus $66,900
ⓘ Source: listings_history table (triggers on properties + properties_extension) + one-shot
backfill from property_details.listing_events for pre-trigger history.
Tax reassessment forecast LA · Resets to sale price
- Current annual tax
- $160 · $13/mo
- Projected year-2 tax
- $324 · $27/mo
- Expected delta
- +$165/yr (+$14/mo · 103.1%)
ⓘ Screening estimate from a state-policy table — verify with the county assessor before closing.
Climate risk First Street
- Flood 1/10 Low FEMA zone X (unshaded) · 0% chance over 30 yrs
- Wildfire 4/10 Moderate
- Heat 7/10 Severe 7 d/yr ≥110°F today · 22 d/yr by 30 yrs out
- Wind 6/10 Major 74% chance of damaging wind over 30 yrs
- Air quality 2/10 Low 1 unhealthy d/yr today · 1 by 30 yrs out
Nearby sold comps map
Loading sold comps map…
Walkable amenities ~0.75 mi
Loading nearby amenities…
Taxation est. · year 1
- Rental income
- $20,572
- − Mortgage interest
- −$3,305
- − Property taxes
- −$160
- − Insurance
- −$295
- − Repairs & maintenance
- −$1,646
- − Management
- −$1,646
- − Depreciation
- −$1,716
- Taxable income
- $11,804
- Est. tax owed @ 24.0%
- −$2,833
- After-tax cash flow
- $9,251/yr
For passive investors: Depreciation is non-cash, so a rental often shows a tax loss while cash-flowing — sheltering income. Rental losses are passive: they offset passive income freely, and up to $25,000/yr can offset ordinary (W-2) income if you actively participate and your MAGI is under $100k (phasing out to $0 by $150k); unused losses carry forward. On sale, claimed depreciation is recaptured at up to 25%, and gains may owe capital-gains tax (a 1031 exchange can defer both). Figures are a year-1 estimate at your 24.0% rate — not tax advice; consult a CPA.
Schools (NCES district)
- District
- Desoto Parish
- NCES district ID
- 2200510
- Math proficiency
- 35% ▼ -37.00%
- Reading proficiency
- 48% ▼ -31.00%
- Median HH income
- $40,201
- Composite
- 34.75/100
- National rank
- #5130
- State rank
- #21 of 98 in LA
Livability — Frierson
- Score
- 43/100
- State rank
- #458
- US rank
- #26938
Category grades
Schools grade is shown separately in the Schools card above.
Census & demographics
- City population
- 986
- Population (ZIP)
- 986
Population outlook (De Soto County) Hauer SSP2
- Today (2025)
- 28,142 people
- By 2030
- 28,546 · +1.4%
- By 2040
- 29,357 · +4.3%
- By 2050
- 30,239 · +7.5%
- By 2075
- 33,412 · +18.7%
- By 2100
- 35,428 · +25.9%
Race, ethnicity, and origin ACS 2023
- Neighborhood character
- Predominantly White (67%)
- Race & ethnicity
- White 67% Black 30% Hispanic / Latino 3% Two or more races 3%
- Common ancestry
- Lithuanian 3% Serbian 2% Portuguese 1%
Political lean MEDSL · De Soto
- 2024 margin
- Solid R (+35.5) · D 31.8% · R 67.3%
- 2008→2024 swing
- -22.1pp toward R · 2008: -13.4pp · 2024: -35.5pp
- All cycles
- 2024: R+35.5 2020: R+24.8 2016: R+21.5 2012: R+13.8 2008: R+13.4
Not yet ingested
- Civics
- —
Market trends
- HPI YoY
- —
- Current HPI
- —
- Rent YoY
- —
- Metro
- —
- State GDP YoY
- ▲ 3.29%
- F500 in state
- 10
Industry mix (Fortune 500 HQ in LA)
| Industry | F500 HQs | Revenue |
|---|---|---|
| Telecommunications | 2 | $23B |
|
||
| Utilities | 1 | $12B |
|
||
| Wholesale / Distribution | 1 | $5B |
|
||
| Advertising | 1 | $2B |
|
||
Price history
-11.8% since first listed7 events — show timeline
- 2026-05-16 Price Changed $59,000 NTREIS
- 2026-01-06 Price Changed $64,000 NTREIS
- 2025-11-12 Price Changed $79,000 NTREIS
- 2025-10-06 Price Changed $89,000 NTREIS
- 2025-09-02 Price Changed $98,000 NTREIS
- 2025-08-12 Listed $110,000 NTREIS
- 2007-09-04 Sold (Public Records) $66,900 Public Records
Property tax history
-4.9%/yrLatest (2025): $160 · -8.0% YoY. Source: county tax records.
Cash-flow waterfall
monthlySold comps — $/sqft
last 12 mo · ≤1 miLoading sold comps…