9712 Solitary Sandpiper St · Creedmoor, TX
Flood risk No data
- FEMA flood zone
- —
- Chance of flooding over 30 yrs
- —
- Est. flood insurance / yr
- —
Fire risk No data
- Est. fire insurance / yr
- —
Heat risk No data
- Hot days now (above threshold)
- —
- Hot days in 30 yrs
- —
Wind risk No data
- Chance of severe wind over 30 yrs
- —
Air-quality risk No data
- Unhealthy air days now
- —
- Unhealthy air days in 30 yrs
- —
Risk factors via First Street. Map © Google.
Why this score? — see what drove the D grade
The composite is a weighted blend of 9 inputs, each scored 0–100. Each bar is that input's sub-score; the figure is the points it added to the 100-point composite (weight × sub-score).
- ARV discount +15.0/15.0
- Cash flow +9.2/30.0
- Condition / age +4.0/5.0
- 1% rule +3.0/10.0
- Livability +2.8/5.0
- DSCR +2.6/10.0
- Rent growth +2.1/5.0
- Schools +1.9/10.0
- Appreciation +0.0/10.0
$292,462
🖨 Deal sheet 📄 Offer letter ✓ Due diligence
Listing remarks MLS
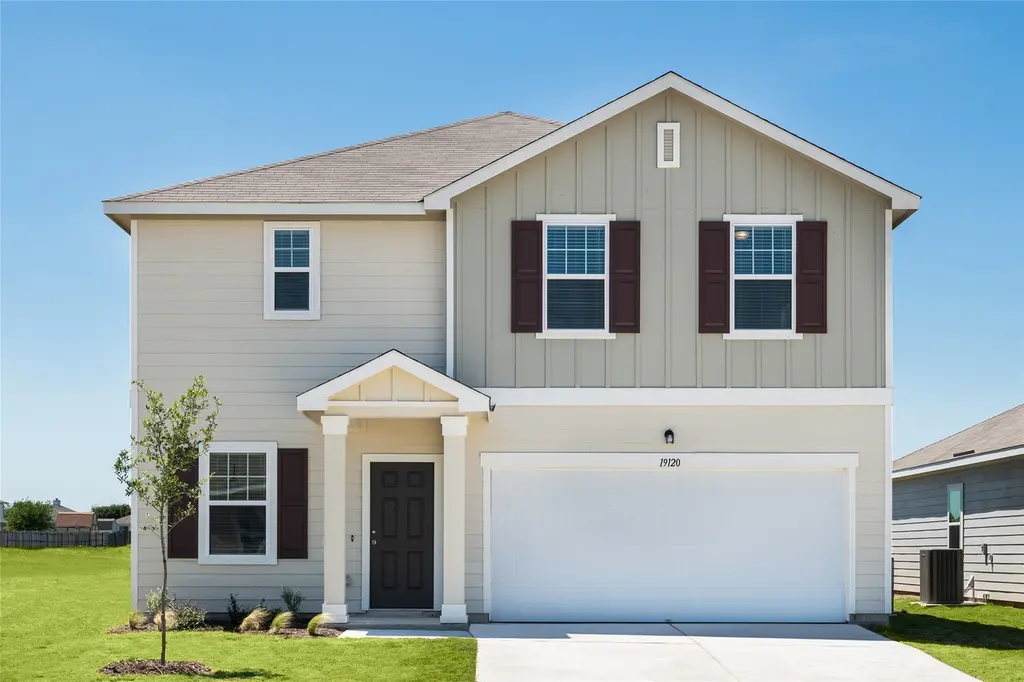
NEW CONSTRUCTION BY STARLIGHT HOMES! Available NOW! As you enter from the covered porch, you’re greeted by a flex room. Continuing through the main level, you pass a powder bath and the two-car garage before stepping into the open kitchen, dining area, and family room. A back patio is located just off the dining area. Upstairs, a spacious loft connects three additional bedrooms—each with a walk-in closet—and a shared bath. The laundry room is conveniently located just outside these bedrooms. On the opposite side of the loft, you’ll find the primary bedroom, complete with a walk-in closet and private primary bath.
Key facts
- Covered porch
- Dining area
- Family room
Tags
Neighborhood map
What this means for you Summary
Snapshot
- This is a 4-bed/2.5-bath single-family listed at $292k. Condition is rated good.
Deal economics
- At list price, monthly cash flow is $-221 ($-3k/yr) — negative.
- To cash-flow at today's rent, offer at most $260k (10.9% below list).
- To meet the 1% rule (rent ≥ 1% of price), the offer needs to be $234k (19.9% below list).
- Recommended offer: $234k (19.9% below list) — sets the bar for 1% rule.
- Cap rate 5.4% vs local median 4.3% in Creedmoor — meaningfully above typical; check what's discounted (condition, days-on-market, listing class) to confirm the premium yield is real.
Location & tenants
- Location reads 55/100 on livability (#1,353 in TX) — a working-class tenant base; expect higher turnover. Strengths: crime A-, housing B; Watch: cost of living C-, schools F, amenities F.
- Del Valle ISD (rural): math 19% / reading 26% proficiency, ranked #749 of 826 in TX (top 91%) — low school quality limits family demand, transient renter base, plan for 1-2y turnover; 77% free/reduced lunch — lower-income household profile, screen leases tightly.
- Market conditions: Rents soft (-1.8%/yr); 1002 active listings in the ZIP; 3 comparable units currently listed for rent nearby; rentals leasing fast (median 2d on market — plan ~1-2 weeks tenant-placement turnaround); high-income renter base; 17,121 units permitted in Travis County in 2024 (11,963 in 5+ unit buildings).
Forward outlook
- Local home prices are declining (-3.0%/yr); year-one equity from $2k of loan paydown is wiped out by about $9k of value loss. Plan a longer hold.
- Travis County population projected at +60% by 2050 — long-run rental-demand tailwind backs the buy-and-hold thesis.
Negotiation context
- It's been on market 46 days — a 3% lower offer ($284k) is reasonable based on typical stale-listing flexibility.
Questions for the listing agent
- What do current leases actually rent for vs. the listed asking? Can we see a recent rent roll and the last 12 months of T-12 income?
- It's been on market 46 days. Have you received any prior offers? Is the seller open to a 20% concession, seller financing, or rate buy-down credit?
- What does the HOA fee cover, when was the last increase, and are there any pending special assessments or reserve-fund shortfalls?
- Is there a deadline driving the sale (1031 exchange, divorce, estate, relocation)? That informs how much negotiation room exists.
- Schools are F-rated, which usually means shorter tenancies and higher turnover. Who's the typical renter profile here, and what's been the actual vacancy rate?
- The area grade is low — what's the realistic commute time and amenity access for the typical tenant pool here? Any planned neighborhood developments (good or bad) we should know about?
- What's the average days-on-market for RENTAL listings here right now (not sales)? A rising rental-DOM trend means longer vacancies and softer asking-rent achievability than the comps imply.
- What's the recent tenant-quality profile in this submarket — average credit score on applications, eviction rate, late-payment / NSF rate, and stable-employment percentage? A property-management company in the area should have these aggregated.
- How much new for-sale + rental construction is in the pipeline within 1–3 miles? Heavy new supply typically softens prices + rents 12–24 months out; constrained supply supports both.
Investment metrics
- 1% rule
- 0.80% ✗
- Cap rate
- 5.39%
- Cash-on-cash
- -3.24%
- DSCR
- 0.86
- GRM
- 10.4
CMA / ARV
- ARV (median comp)
- $369,392
- List price
- $292,462
- Delta
- -20.83%
- Verdict
- UNDERPRICED
- Comps
- 20 within 1.0 mi
Show comp detail 7 sales within ~0.75 mi
| Address | Dist | Beds/Ba | Sqft | Sold | Price | $/sf | Match |
|---|---|---|---|---|---|---|---|
| 9712 Solitary Sandpiper St | 0.00mi | 4/2.5 | 2,338 (0%) | 0mo | $292,462 | $125 | 100 |
| 9801 Serene Bliss Ln | 0.16mi | 4/3.0 | 2,302 (-2%) | 1mo | $399,370 | $173 | 87 |
| 9704 Serene Bliss Ln | 0.19mi | 4/3.0 | 2,302 (-2%) | 8mo | $425,000 | $185 | 80 |
| 9720 Serene Bliss Ln | 0.19mi | 3/2.5 (-1) | 2,302 (-2%) | 6mo | $399,900 | $174 | 79 |
| 9724 Serene Bliss Ln | 0.19mi | 4/2.5 | 2,484 (+6%) | 3mo | $399,900 | $161 | 79 |
| 9725 Serene Bliss Ln | 0.16mi | 3/2.5 (-1) | 2,158 (-8%) | 5mo | $409,868 | $190 | 71 |
| 9713 Serene Bliss Ln | 0.16mi | 3/2.0 (-1) | 2,105 (-10%) | 7mo | $405,900 | $193 | 63 |
Match score weights: distance 35% · size 25% · config 20% · recency 20%. Top-matched comps best support the ARV.
Projected returns pro-forma
-3.0% appreciation · 0.0% rent growth · sell at horizon
- IRR
- -25.2%
- Equity multiple
- 0.17×
- Total profit
- $-68,277
- Equity at exit
- $43,607
- IRR
- -34.6%
- Equity multiple
- -0.27×
- Total profit
- $-103,848
- Equity at exit
- $25,287
Cash invested: $81,889 (down + closing). Projections, not guarantees.
Landlord ↔ Tenant lean methodology
- Overall (STATE)
- 87 Strongly Landlord-Friendly
- State Texas
- 87 Strongly Landlord-Friendly · R+5
- County
- — inherits STATE
- City
- — inherits STATE
ZIP-level market 78610
- Rents YoY
- -1.8%
- Active inventory
- 1002
- Price-to-rent
- 10.4×
Monthly cashflow live
- Estimated rent
- $2,342 medium interval (Pro) →
- Mortgage (P&I)
- −$1,534
- Tax est. 1.5%
- −$366 /mo · $4,387/yr
- Insurance
- −$122
- HOA
- −$50
- Vacancy / Maint / Mgmt
- −$492
- Net cashflow
- $-221
Break-even live
UW: 25.0% down · 7.5% · 30yr · 1.5% tax · 5.0% vac · 8.0% maint · 8.0% mgmt
Financing live
Cash to close
- Down payment
- $73,116
- Closing costs
- $8,774
- Reserves months
- —
- Total cash needed
- —
Loan-product check · same deal, 3 products live
Conventional
25% down · 7.5% · 30yr
- Down + closing
- —
- Monthly P&I
- —
- Monthly cashflow
- —
- DSCR
- —
- Eligible?
- —
Personal DTI + credit; lowest rate.
DSCR
20% down · 8.5% · 30yr
- Down + closing
- —
- Monthly P&I
- —
- Monthly cashflow
- —
- DSCR
- —
- Eligible?
- —
No personal income docs; deal must DSCR.
Hard money
10% down · 12.0% · 12mo
- Down + closing
- —
- Monthly P&I
- —
- Monthly cashflow
- —
- DSCR
- —
- Eligible?
- —
Short-term bridge; refi at stabilization.
Rent comps 3 comps
| Address | Beds | Baths | Sqft | Rent | $/sqft | DOM | Units | Dist |
|---|---|---|---|---|---|---|---|---|
| 10615 Ridan Way Buda, TX | 3.0 | 2.5 | 1678 | $2,200 | $1.31 | 1d | 1 | 0.85mi |
| 6603 Smarty Jones Ln Buda, TX | 4.0 | 2.5 | 2557 | $2,195 | $0.86 | 10d | 1 | 0.99mi |
| 6915 Tiznow Ln Buda, TX | 3.0 | 2.5 | 1845 | $2,300 | $1.25 | 1d | 1 | 1.18mi |
HOA detail
- Monthly dues
- $50 · $600/yr
Listing history 3 events
-
2026-05-19status Pending 644-char remark
Show marketing remark (644 chars)
NEW CONSTRUCTION BY STARLIGHT HOMES! Available NOW! As you enter from the covered porch, you’re greeted by a flex room. Continuing through the main level, you pass a powder bath and the two-car garage before stepping into the open kitchen, dining area, and family room. A back patio is located just off the dining area. Upstairs, a spacious loft connects three additional bedrooms—each with a walk-in closet—and a shared bath. The laundry room is conveniently located just outside these bedrooms. On the opposite side of the loft, you’ll find the primary bedroom, complete with a walk-in closet and private primary bath.
-
2026-04-22price $292,462 644-char remark
Show marketing remark (644 chars)
NEW CONSTRUCTION BY STARLIGHT HOMES! Available NOW! As you enter from the covered porch, you’re greeted by a flex room. Continuing through the main level, you pass a powder bath and the two-car garage before stepping into the open kitchen, dining area, and family room. A back patio is located just off the dining area. Upstairs, a spacious loft connects three additional bedrooms—each with a walk-in closet—and a shared bath. The laundry room is conveniently located just outside these bedrooms. On the opposite side of the loft, you’ll find the primary bedroom, complete with a walk-in closet and private primary bath.
-
2026-04-03$342,490 Active 644-char remark
Show marketing remark (644 chars)
NEW CONSTRUCTION BY STARLIGHT HOMES! Available NOW! As you enter from the covered porch, you’re greeted by a flex room. Continuing through the main level, you pass a powder bath and the two-car garage before stepping into the open kitchen, dining area, and family room. A back patio is located just off the dining area. Upstairs, a spacious loft connects three additional bedrooms—each with a walk-in closet—and a shared bath. The laundry room is conveniently located just outside these bedrooms. On the opposite side of the loft, you’ll find the primary bedroom, complete with a walk-in closet and private primary bath.
ⓘ Source: listings_history table (triggers on properties + properties_extension) + one-shot
backfill from property_details.listing_events for pre-trigger history.
Nearby sold comps map
Loading sold comps map…
Walkable amenities ~0.75 mi
Loading nearby amenities…
Taxation est. · year 1
- Rental income
- $28,100
- − Mortgage interest
- −$16,382
- − Property taxes
- −$4,387
- − Insurance
- −$1,462
- − Repairs & maintenance
- −$2,248
- − Management
- −$2,248
- − HOA
- −$600
- − Depreciation
- −$8,508
- Taxable loss
- −$7,735
- Est. tax savings @ 24.0%
- +$1,856
- After-tax cash flow
- $-798/yr
For passive investors: Depreciation is non-cash, so a rental often shows a tax loss while cash-flowing — sheltering income. Rental losses are passive: they offset passive income freely, and up to $25,000/yr can offset ordinary (W-2) income if you actively participate and your MAGI is under $100k (phasing out to $0 by $150k); unused losses carry forward. On sale, claimed depreciation is recaptured at up to 25%, and gains may owe capital-gains tax (a 1031 exchange can defer both). Figures are a year-1 estimate at your 24.0% rate — not tax advice; consult a CPA.
Condition & rehab AI · 1 photo
This new construction home is in excellent condition with no visible repairs needed. It offers a spacious layout and modern amenities, making it an attractive option for both resale and rental markets.
Value-add opportunities
- Both Painting exterior and interior walls — Fresh paint enhances curb appeal and interior aesthetics.
- Both Landscaping improvements — Enhances curb appeal and adds value to the property.
- Resale Kitchen appliances — Modern appliances improve the home's appeal to potential buyers.
- Resale Bathroom fixtures — Upgraded fixtures can attract more buyers and renters.
- Rental HVAC system maintenance — A well-maintained HVAC system ensures comfort and reduces utility costs for renters.
Renovation cost estimate screening
Value-add ROI direction
- Both Painting exterior and interior walls — Fresh paint enhances curb appeal and interior aesthetics. ↑
- Both Landscaping improvements — Enhances curb appeal and adds value to the property. ↑
- Resale Kitchen appliances — Modern appliances improve the home's appeal to potential buyers. ↑
- Resale Bathroom fixtures — Upgraded fixtures can attract more buyers and renters. ↑
- Rental HVAC system maintenance — A well-maintained HVAC system ensures comfort and reduces utility costs for renters. ↑
ⓘ Cost ranges are severity-bucket heuristics (US national rule-of-thumb). Get contractor quotes + a written scope before underwriting a rehab budget.
Schools (NCES district)
- District
- Del Valle ISD
- NCES district ID
- 4816620
- Math proficiency
- 19% ▼ -13.00%
- Reading proficiency
- 26% ▼ -2.00%
- Median HH income
- $41,322
- Composite
- 19.13/100
- National rank
- #8830
- State rank
- #749 of 826 in TX
Livability — Creedmoor
- Score
- 55/100
- State rank
- #1353
- US rank
- #23312
Category grades
Schools grade is shown separately in the Schools card above.
Census & demographics
- Census place
- Creedmoor, TX
- County
- Hays County · 280,138 people
- Metro
- Austin-Round Rock-Georgetown, TX
- Population (ZIP)
- 48,319
- Household income
- $119,698
- Rent vs Own
- Severe rent burden
- 611.0
Population outlook (Travis County) Hauer SSP2
- Today (2025)
- 1,545,133 people
- By 2030
- 1,729,269 · +11.9%
- By 2040
- 2,097,596 · +35.8%
- By 2050
- 2,463,890 · +59.5%
- By 2075
- 3,249,374 · +110.3%
- By 2100
- 3,801,868 · +146.1%
Race, ethnicity, and origin ACS 2023
- Neighborhood character
- Diverse neighborhood (Simpson 0.58)
- Race & ethnicity
- White 49% Hispanic / Latino 42% Two or more races 17% Black 4% Asian 2%
- Hispanic origin (detail)
- Mexican 35%
- Common ancestry
- Italian 2% Romanian 2% Lithuanian 2%
- Foreign-born
- 10% · Canada, Jamaica, South Korea
- Languages at home
- 76% English-only · Spanish 20% Arabic 2% Other Indo-European 1%
Political lean MEDSL · Travis
- 2024 margin
- Solid D (+39.3) · D 68.8% · R 29.4% · Other 1.8%
- 2008→2024 swing
- +9.9pp toward D · 2008: 29.4pp · 2024: 39.3pp
- All cycles
- 2024: D+39.3 2020: D+45.0 2016: D+38.9 2012: D+23.9 2008: D+29.4
Not yet ingested
- Civics
- —
Market trends
- HPI YoY
- ▼ -161.50%
- Current HPI
- 220.6824
- Rent YoY
- ▼ -1.80%
- Metro
- Austin-Round Rock-Georgetown, TX
- State GDP YoY
- ▲ 3.95%
- F500 in state
- 110
Industry mix (Fortune 500 HQ in TX)
| Industry | F500 HQs | Revenue |
|---|---|---|
| Energy | 16 | $1,198B |
|
||
| Technology | 5 | $198B |
|
||
| Engineering / Construction | 4 | $72B |
|
||
| Energy Services | 3 | $60B |
|
||
| Utilities | 3 | $41B |
|
||
| Healthcare | 2 | $330B |
|
||
Price history
-14.6% since first listed3 events — show timeline
- 2026-05-19 Pending — Unlock MLS
- 2026-04-22 Price Changed $292,462 Unlock MLS
- 2026-04-03 Listed $342,490 Unlock MLS
Cash-flow waterfall
monthlySold comps — $/sqft
last 12 mo · ≤1 miLoading sold comps…