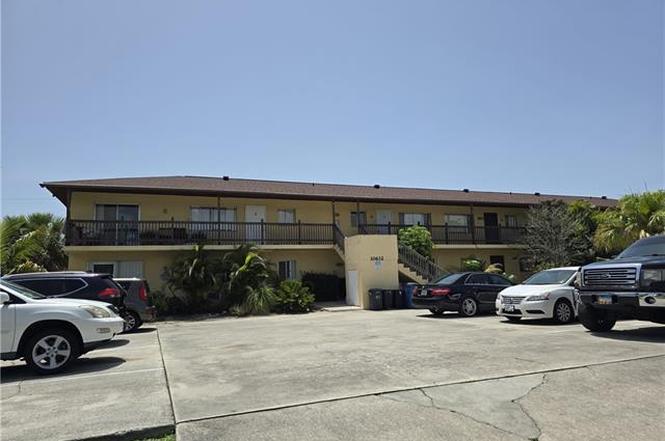
10632 Woods Cir #1 · Bonita Springs, FL
Flood risk 6/10 · Moderate
- FEMA flood zone
- X (shaded)
- Chance of flooding over 30 yrs
- 0.73%
- Est. flood insurance / yr
- $507 – $1,088
Fire risk 1/10 · Minimal
- Est. fire insurance / yr
- $947 – $1,759
Heat risk 9/10 · Severe
- Hot days now (above 107°F)
- 4 days/yr
- Hot days in 30 yrs
- 16 days/yr
Wind risk 10/10 · Severe
- Chance of severe wind over 30 yrs
- 99.0%
Air-quality risk 2/10 · Minimal
- Unhealthy air days now
- 1 days/yr
- Unhealthy air days in 30 yrs
- 1 days/yr
Risk factors via First Street. Map © Google.
Why this score? — see what drove the C- grade
The composite is a weighted blend of 9 inputs, each scored 0–100. Each bar is that input's sub-score; the figure is the points it added to the 100-point composite (weight × sub-score).
- Cash flow +19.6/30.0
- 1% rule +7.6/10.0
- ARV discount +7.5/15.0
- DSCR +6.2/10.0
- Schools +4.1/10.0
- Livability +3.5/5.0
- Condition / age +2.5/5.0
- Rent growth +2.3/5.0
- Appreciation +0.0/10.0
$170,000
🖨 Deal sheet 📄 Offer letter ✓ Due diligence
Listing remarks
Great investment opportunity in Bonita Springs. This 2-bedroom, 1-bath apartment offers a functional layout and strong rental potential. Convenient location near shopping, dining, major roads, and beaches.
Key facts
- Near dining
- Near shopping
- Functional layout
Tags
Property features AI
Finance
- Other: Part of a 9-unit complex with 1 unit per building
- HOA & community: Mandatory HOA (Condo-managed); Quarterly HOA fee of $1,400; Total annual recurring fees $5,600; Community is non-gated; No listed community amenities; No maintenance included
Exterior
- Parking: Detached 2-car garage
- Utilities: Central water; Central sewer; Window unit cooling
- Home design: Residential property; Low-rise building (1–3 stories); 2-story building; Rear exposure facing east; Located in Bonita Royal Condo Phase 1
- Construction: Concrete block construction; Built in 1982
- Exterior features: Stucco exterior; Windows — see remarks; Wood roof
Interior
- Kitchen: Eat-in kitchen
- Bedrooms: 2 bedrooms
- Flooring: Laminate flooring
- Bathrooms: 1 full bathroom; Master bath with tub only
- Heating & cooling: Window unit cooling
- Interior features: See remarks for additional interior details; Eat-in kitchen; Unfurnished; Split bedroom floor plan
Neighborhood map
What this means for you Summary
Snapshot
- This is a 2-bed/1.0-bath condo listed at $170k.
Deal economics
- At list price, monthly cash flow is $196 ($2k/yr) — positive.
- The deal already cash-flows at list — no discount required.
- Meets the 1% rule at list price ($2k rent vs $170k).
- Recommended offer: $150k (12.0% below list) — sets the bar for market timing.
- Cap rate 7.7% vs local median 1.7% in Bonita Springs — top-decile yield for the area; either an underpriced asset or a hidden risk that comps aren't pricing in. Stress-test before assuming the spread holds.
Location & tenants
- Location reads 70/100 on livability (#428 in FL) — a middle-class / working-renter tenant base. Strengths: crime A+, housing A+, employment A; Watch: schools C-, cost of living C-, health & safety D.
- Lee (suburban): math 47% / reading 50% proficiency, ranked #42 of 73 in FL (top 58%) — families likely to look elsewhere, expect single-tenant / working-renter base with shorter leases.
- Market conditions: Rents soft (-0.6%/yr); 835 active listings in the ZIP; 40 comparable units currently listed for rent nearby; rentals at typical pace (median 24d on market — plan ~3-4 weeks tenant-placement turnaround); solid renter incomes; 15,411 units permitted in Lee County in 2024 (4,686 in 5+ unit buildings).
Forward outlook
- Local home prices are declining (-3.0%/yr); year-one equity from $1k of loan paydown is wiped out by about $5k of value loss. Plan a longer hold.
- Lee County population projected at +44% by 2050 — long-run rental-demand tailwind backs the buy-and-hold thesis.
Negotiation context
- It's been on market 163 days — a 12% lower offer ($150k) is reasonable based on typical stale-listing flexibility.
- 12 sale attempts since 15y ago with the ask held roughly flat each time — persistent listings suggest the price (not the market) is what's stuck; bring a comps-based counter.
- Current owner paid $78k; list at $170k implies a 119% gain — meaningful room to come down on a strong offer.
Risks & watch-outs
- Watch-outs: HOA is 22% of rent.
- Climate carrying-cost: major flood risk; severe wind risk, 99% chance of damaging wind over 30y; extreme-heat days projected 4→16/yr by 2055 (HVAC capex compounding) — expect insurance premiums to compound above CPI over the hold.
Questions for the listing agent
- It's been on market 163 days. Have you received any prior offers? Is the seller open to a 12% concession, seller financing, or rate buy-down credit?
- What does the HOA fee cover, when was the last increase, and are there any pending special assessments or reserve-fund shortfalls?
- Any open or pending special assessments — roof, HVAC, plumbing, elevator, façade? What's the per-unit balance and payoff schedule, and is the seller paying it off at close or rolling it to the buyer?
- Why hasn't it sold? Are there any deal-killer items the seller is aware of (foundation, flood, title, zoning, code violations)?
- Is there a deadline driving the sale (1031 exchange, divorce, estate, relocation)? That informs how much negotiation room exists.
- What's the average days-on-market for RENTAL listings here right now (not sales)? A rising rental-DOM trend means longer vacancies and softer asking-rent achievability than the comps imply.
- What's the recent tenant-quality profile in this submarket — average credit score on applications, eviction rate, late-payment / NSF rate, and stable-employment percentage? A property-management company in the area should have these aggregated.
- How much new apartment / multifamily construction is in the pipeline within 1–3 miles? Heavy new supply (>2% of stock underway) typically softens rents 12–24 months out; light construction supports rent growth.
Investment metrics
- 1% rule
- 1.26% ✓
- Cap rate
- 7.68%
- Cash-on-cash
- 4.95%
- DSCR
- 1.22
- GRM
- 6.6
CMA / ARV
No comps found within radius.
Projected returns pro-forma
-3.0% appreciation · 0.0% rent growth · sell at horizon
- IRR
- -12.7%
- Equity multiple
- 0.56×
- Total profit
- $-21,095
- Equity at exit
- $25,348
- IRR
- -10.7%
- Equity multiple
- 0.46×
- Total profit
- $-25,607
- Equity at exit
- $14,698
Cash invested: $47,600 (down + closing). Projections, not guarantees.
Landlord ↔ Tenant lean methodology
- Overall (STATE)
- 87 Strongly Landlord-Friendly
- State Florida
- 87 Strongly Landlord-Friendly · R+3
- County
- — inherits STATE
- City
- — inherits STATE
ZIP-level market 34135
- Rents YoY
- -0.6%
- Active inventory
- 835
- Price-to-rent
- 6.6×
Monthly cashflow live
- Estimated rent
- $2,143 high interval (Pro) →
- Mortgage (P&I)
- −$891
- Tax from tax record
- −$67 /mo · $810/yr
- Insurance
- −$71
- HOA
- −$467
- Vacancy / Maint / Mgmt
- −$450
- Net cashflow
- $196
Break-even live
UW: 25.0% down · 7.5% · 30yr · 1.5% tax · 5.0% vac · 8.0% maint · 8.0% mgmt
Financing live
Cash to close
- Down payment
- $42,500
- Closing costs
- $5,100
- Reserves months
- —
- Total cash needed
- —
Loan-product check · same deal, 3 products live
Conventional
25% down · 7.5% · 30yr
- Down + closing
- —
- Monthly P&I
- —
- Monthly cashflow
- —
- DSCR
- —
- Eligible?
- —
Personal DTI + credit; lowest rate.
DSCR
20% down · 8.5% · 30yr
- Down + closing
- —
- Monthly P&I
- —
- Monthly cashflow
- —
- DSCR
- —
- Eligible?
- —
No personal income docs; deal must DSCR.
Hard money
10% down · 12.0% · 12mo
- Down + closing
- —
- Monthly P&I
- —
- Monthly cashflow
- —
- DSCR
- —
- Eligible?
- —
Short-term bridge; refi at stabilization.
Rent comps 40 comps
| Address | Beds | Baths | Sqft | Rent | $/sqft | DOM | Units | Dist |
|---|---|---|---|---|---|---|---|---|
| 10710 Rosemary Dr #712 Bonita Springs, FL | 1.0 | 1.0 | 984 | $1,750 | $1.78 | 23d | 1 | 0.24mi |
| 27250 Shriver Ave Unit 1073504P Bonita Springs, FL | 2.0 | 1.0 | 661 | $4,275 | $6.46 | 3d | 2 | 0.40mi |
| 10897 Goodwin St #899 Bonita Springs, FL | 2.0 | 1.0 | 770 | $1,950 | $2.53 | 23d | 1 | 0.41mi |
| 27249 Pullen Ave #5 Bonita Springs, FL | 2.0 | 2.0 | 956 | $1,950 | $2.04 | 23d | 1 | 0.42mi |
| 27249 Pullen Ave #4 Bonita Springs, FL | 2.0 | 2.5 | 956 | $3,200 | $3.35 | 23d | 1 | 0.42mi |
| 27020 Williams Rd #5 Bonita Springs, FL | 1.0 | 1.0 | 595 | $1,700 | $2.86 | 23d | 1 | 0.45mi |
| 10725 Wilson St #11 Bonita Springs, FL | 2.0 | 12.0 | 1008 | $1,800 | $1.79 | 23d | 1 | 0.46mi |
| 27083 Matheson Ave #208 Bonita Springs, FL | 2.0 | 2.0 | 970 | $1,750 | $1.80 | 23d | 1 | 0.51mi |
| 27302 Dortch Ave #304 Bonita Springs, FL | 2.0 | 1.0 | 800 | $2,550 | $3.19 | 2d | 1 | 0.52mi |
| 27095 Matheson Ave #206 Bonita Springs, FL | 1.0 | 1.0 | 715 | $1,500 | $2.10 | 23d | 1 | 0.56mi |
| 27109 Matheson Ave Unit 206 Bonita Springs, FL | 1.0 | 1.0 | 770 | $1,700 | $2.21 | 3d | 1 | 0.59mi |
| 27103 Matheson Ave #206 Bonita Springs, FL | 1.0 | 1.0 | 770 | $1,500 | $1.95 | 23d | 1 | 0.60mi |
| 27103 Matheson Ave #206 Bonita Springs, FL | 1.0 | 1.0 | 713 | $1,700 | $2.38 | 14d | 1 | 0.60mi |
| 27123 Matheson Ave #106 Bonita Springs, FL | 1.0 | 1.0 | 713 | $1,600 | $2.24 | 23d | 1 | 0.60mi |
| 27107 Matheson Ave Unit 4-108 Bonita Springs, FL | 2.0 | 2.0 | 975 | $3,995 | $4.10 | 23d | 1 | 0.61mi |
| 27123 Matheson Ave Bonita Springs, FL | 2.0 | 2.0 | 970 | $1,300 | $1.34 | 3d | 1 | 0.61mi |
| 26239 Bonita Fairways Cir Bonita Springs, FL | 2.0 | 2.0 | 1088 | $2,500 | $2.30 | 23d | 1 | 0.62mi |
| 10101 Sandy Hollow Ln #102 Bonita Springs, FL | 2.0 | 2.5 | 808 | $1,645 | $2.04 | 23d | 1 | 0.78mi |
| 10575 Crockett St Unit 406 Bonita Springs, FL | 2.0 | 2.0 | 900 | $2,450 | $2.72 | 3d | 1 | 0.82mi |
| 10575 Crockett St Unit 303 Bonita Springs, FL | 2.0 | 2.0 | 1000 | $2,400 | $2.40 | 23d | 1 | 0.82mi |
| 27715 Tennessee St Unit b Bonita Springs, FL | 2.0 | 1.0 | 885 | $1,750 | $1.98 | 23d | 1 | 0.90mi |
| 10280 Carolina St Unit 1 Bonita Springs, FL | 2.0 | 1.5 | 1040 | $2,200 | $2.12 | 19d | 1 | 0.99mi |
| 26589-610 Rosewood Pointe Dr Unit A 301 Bonita Springs, FL | 2.0 | 2.0 | 986 | $3,500 | $3.55 | 23d | 1 | 1.06mi |
| 26600 Rosewood Pointe Dr Unit 102 Bonita Springs, FL | 1.0 | 2.0 | 833 | $2,900 | $3.48 | 3d | 1 | 1.06mi |
| 26600 Rosewood Pointe Dr Unit B-101 Bonita Springs, FL | 2.0 | 2.0 | 983 | $2,200 | $2.24 | 3d | 1 | 1.06mi |
| 27599 Lime St Bonita Springs, FL | 2.0 | 1.0 | 900 | $1,800 | $2.00 | 23d | 1 | 1.06mi |
| 10325 Tarrah Ln Unit 1073517P Bonita Springs, FL | 2.0 | 1.0 | 818 | $4,608 | $5.63 | 2d | 1 | 1.11mi |
| 25806 Cockleshell Dr #314 Bonita Springs, FL | 2.0 | 2.0 | 975 | $1,800 | $1.85 | 23d | 1 | 1.11mi |
| 11355 Ridge Rd Bonita Springs, FL | 1.0 | 1.0 | 704 | $2,250 | $3.20 | 21d | 1 | 1.15mi |
| 9450 Highland Woods Blvd #6203 Bonita Springs, FL | 2.0 | 2.0 | 1100 | $6,000 | $5.45 | 14d | 1 | 1.16mi |
| 9861 Alabama St #3 Bonita Springs, FL | 2.0 | 2.0 | 866 | $2,100 | $2.42 | 19d | 1 | 1.22mi |
| 9861 Alabama St #3 Bonita Springs, FL | 2.0 | 2.0 | 866 | $2,100 | $2.42 | 23d | 1 | 1.22mi |
| 28121 Pine Haven Way #110 Bonita Springs, FL | 2.0 | 2.0 | 884 | $2,100 | $2.38 | 23d | 1 | 1.29mi |
| 28121 Pine Haven Way #109 Bonita Springs, FL | 2.0 | 2.0 | 1040 | $1,795 | $1.73 | 23d | 1 | 1.29mi |
| 9250 Highland Woods Blvd #2308 Bonita Springs, FL | 2.0 | 2.0 | 1100 | $1,995 | $1.81 | 23d | 1 | 1.31mi |
| 9250 Highland Woods Blvd #2308 Bonita Springs, FL | 2.0 | 2.0 | 1100 | $1,995 | $1.81 | 3d | 1 | 1.31mi |
| 11350 Pendleton St #352 Bonita Springs, FL | 2.0 | 1.0 | 1020 | $1,800 | $1.76 | 23d | 1 | 1.31mi |
| 28100 Pine Haven Way #6 Bonita Springs, FL | 2.0 | 2.0 | 884 | $1,895 | $2.14 | 23d | 1 | 1.31mi |
| 28100 Pine Haven Way #5 Bonita Springs, FL | 2.0 | 2.0 | 884 | $1,800 | $2.04 | 23d | 1 | 1.31mi |
| 11931 Palm Bay Ct Unit 102 Bonita Springs, FL | 2.0 | 2.0 | 940 | $1,800 | $1.91 | 23d | 1 | 1.32mi |
HOA detail condo
- Monthly dues
- $467 · $5,604/yr
- Assessments
- None detected in remarks — confirm with the listing agent.
Listing history 47 events
-
2026-06-17days on market $170,000 Active 163 DOM
-
2026-06-16days on market $170,000 Active 162 DOM
-
2026-06-15days on market $170,000 Active 161 DOM
-
2026-06-13days on market $170,000 Active 159 DOM
-
2026-06-10days on market $170,000 Active 156 DOM
-
2026-06-09days on market $170,000 Active 155 DOM
-
2026-06-07days on market $170,000 Active 153 DOM
-
2026-06-02days on market $170,000 Active 148 DOM
-
2026-06-01days on market $170,000 Active 147 DOM
-
2026-06-01days on market $170,000 Active 146 DOM
-
2026-01-05$170,000 Active
-
2025-12-31historical
-
2025-07-07$170,000 Active
-
2022-12-20status Active
-
2022-12-20historical
-
2022-10-08status Pending
-
2022-09-19price $159,000
-
2022-09-06price $145,000
-
2022-08-04price $155,000
-
2022-08-03price $159,000
-
2022-08-03status Active
-
2022-08-03status Pending
-
2022-07-11status Active
-
2022-06-22status Pending
-
2022-06-14$164,000 Active
-
2022-06-08historical
-
2022-06-01status Active
-
2022-05-07status Pending
-
2022-05-07historical
-
2022-05-05price $160,000
-
2022-04-02price $180,000
-
2022-02-26price $160,000
-
2022-01-10price $180,000
-
2021-12-14$170,000 Active
-
2018-10-11soldstatus $77,500
-
2018-10-05soldstatus $77,500 Sold
-
2018-07-20status Pending With Contingencies
-
2018-06-28$79,900 Active
-
2018-05-01historical
-
2018-01-02$79,900 Active
-
2017-12-04historical
-
2017-12-03$79,900
-
2011-04-06historical
-
2011-03-28$54,900
-
2004-11-04soldstatus $73,400
-
2001-04-09soldstatus $43,000
-
1999-04-05soldstatus $37,900
ⓘ Source: listings_history table (triggers on properties + properties_extension) + one-shot
backfill from property_details.listing_events for pre-trigger history.
Tax reassessment forecast FL · Resets to sale price
- Current annual tax
- $810 · $67/mo
- Projected year-2 tax
- $1,411 · $118/mo
- Expected delta
- +$601/yr (+$50/mo · 74.3%)
ⓘ Screening estimate from a state-policy table — verify with the county assessor before closing.
Climate risk First Street
- Flood 6/10 Major FEMA zone X (shaded) · 73% chance over 30 yrs
- Wildfire 1/10 Low
- Heat 9/10 Extreme 4 d/yr ≥107°F today · 16 d/yr by 30 yrs out
- Wind 10/10 Extreme 99% chance of damaging wind over 30 yrs
- Air quality 2/10 Low 1 unhealthy d/yr today · 1 by 30 yrs out
Nearby sold comps map
Loading sold comps map…
Walkable amenities ~0.75 mi
Loading nearby amenities…
Taxation est. · year 1
- Rental income
- $25,718
- − Mortgage interest
- −$9,523
- − Property taxes
- −$810
- − Insurance
- −$850
- − Repairs & maintenance
- −$2,057
- − Management
- −$2,057
- − HOA
- −$5,604
- − Depreciation
- −$4,945
- Taxable loss
- −$128
- Est. tax savings @ 24.0%
- +$31
- After-tax cash flow
- $2,387/yr
For passive investors: Depreciation is non-cash, so a rental often shows a tax loss while cash-flowing — sheltering income. Rental losses are passive: they offset passive income freely, and up to $25,000/yr can offset ordinary (W-2) income if you actively participate and your MAGI is under $100k (phasing out to $0 by $150k); unused losses carry forward. On sale, claimed depreciation is recaptured at up to 25%, and gains may owe capital-gains tax (a 1031 exchange can defer both). Figures are a year-1 estimate at your 24.0% rate — not tax advice; consult a CPA.
Schools (NCES district)
- District
- Lee
- NCES district ID
- 1201080
- Math proficiency
- 47% ▼ -11.00%
- Reading proficiency
- 50% ▼ -4.00%
- Median HH income
- $49,518
- Composite
- 41.49/100
- National rank
- #3458
- State rank
- #42 of 73 in FL
Livability — Bonita Springs
- Score
- 70/100
- State rank
- #428
- US rank
- #7576
Category grades
Schools grade is shown separately in the Schools card above.
Census & demographics
- Census place
- Bonita Springs, FL
- County
- Lee County · 788,662 people
- City population
- 64,727
- Metro
- Cape Coral-Fort Myers, FL
- Population (ZIP)
- 48,252
- Household income
- $91,380
- Rent vs Own
- Severe rent burden
- 976.0
Population outlook (Lee County) Hauer SSP2
- Today (2025)
- 871,946 people
- By 2030
- 955,468 · +9.6%
- By 2040
- 1,113,587 · +27.7%
- By 2050
- 1,256,891 · +44.1%
- By 2075
- 1,560,270 · +78.9%
- By 2100
- 1,726,848 · +98.0%
Race, ethnicity, and origin ACS 2023
- Neighborhood character
- Predominantly White (69%)
- Race & ethnicity
- White 69% Hispanic / Latino 26% Two or more races 13% Native American 3% Black 2%
- Hispanic origin (detail)
- Mexican 8% Puerto Rican 4% Cuban 3%
- Common ancestry
- Romanian 5% Lithuanian 2% Slovak 2%
- Foreign-born
- 22% · Canada, Jamaica
- Languages at home
- 74% English-only · Spanish 21% French/Haitian/Cajun 1% Russian/Polish/Slavic 1%
Political lean MEDSL · Lee
- 2024 margin
- Strong R (+28.4) · D 35.5% · R 63.9%
- 2008→2024 swing
- -18.0pp toward R · 2008: -10.4pp · 2024: -28.4pp
- All cycles
- 2024: R+28.4 2020: R+19.2 2016: R+20.4 2012: R+16.6 2008: R+10.4
Not yet ingested
- Civics
- —
Market trends
- HPI YoY
- ▼ -188.86%
- Current HPI
- 243.4153
- Rent YoY
- ▼ -0.61%
- Metro
- Cape Coral-Fort Myers, FL
- State GDP YoY
- ▲ 3.28%
- F500 in state
- 36
Industry mix (Fortune 500 HQ in FL)
| Industry | F500 HQs | Revenue |
|---|---|---|
| Industrial Technology | 2 | $29B |
|
||
| Insurance | 2 | $17B |
|
||
| Retail | 1 | $60B |
|
||
| Technology Distribution | 1 | $58B |
|
||
| Homebuilding | 1 | $35B |
|
||
| Technology Manufacturing | 1 | $35B |
|
||
Price history
+348.5% since first listed37 events — show timeline
- 2026-01-05 Listed $170,000 NAPLESMLS
- 2025-12-31 Listing Removed — NAPLESMLS
- 2025-07-07 Listed $170,000 NAPLESMLS
- 2022-12-20 Relisted — FORTMLS
- 2022-12-20 Listing Removed — FORTMLS
- 2022-10-08 Pending — FORTMLS
- 2022-09-19 Price Changed $159,000 FORTMLS
- 2022-09-06 Price Changed $145,000 FORTMLS
- 2022-08-04 Price Changed $155,000 FORTMLS
- 2022-08-03 Price Changed $159,000 FORTMLS
- 2022-08-03 Relisted — FORTMLS
- 2022-08-03 Pending — FORTMLS
- 2022-07-11 Relisted — FORTMLS
- 2022-06-22 Pending — FORTMLS
- 2022-06-14 Listed $164,000 FORTMLS
- 2022-06-08 Listing Removed — FORTMLS
- 2022-06-01 Relisted — FORTMLS
- 2022-05-07 Pending — FORTMLS
- 2022-05-07 Listing Removed — FORTMLS
- 2022-05-05 Price Changed $160,000 FORTMLS
- 2022-04-02 Price Changed $180,000 FORTMLS
- 2022-02-26 Price Changed $160,000 FORTMLS
- 2022-01-10 Price Changed $180,000 FORTMLS
- 2021-12-14 Listed $170,000 FORTMLS
- 2018-10-11 Sold (Public Records) $77,500 Public Records
- 2018-10-05 Sold (MLS) $77,500 NAPLESMLS
- 2018-07-20 Pending — NAPLESMLS
- 2018-06-28 Listed $79,900 NAPLESMLS
- 2018-05-01 Listing Removed — NAPLESMLS
- 2018-01-02 Listed $79,900 NAPLESMLS
- 2017-12-04 Listing Removed — NAPLESMLS
- 2017-12-03 Listed $79,900 NAPLESMLS
- 2011-04-06 Listing Removed — NAPLESMLS
- 2011-03-28 Listed $54,900 NAPLESMLS
- 2004-11-04 Sold (Public Records) $73,400 Public Records
- 2001-04-09 Sold (Public Records) $43,000 Public Records
- 1999-04-05 Sold (Public Records) $37,900 Public Records
Property tax history
+0.6%/yrLatest (2025): $810 · +6.5% YoY. Source: county tax records.
Cash-flow waterfall
monthlySold comps — $/sqft
last 12 mo · ≤1 miLoading sold comps…