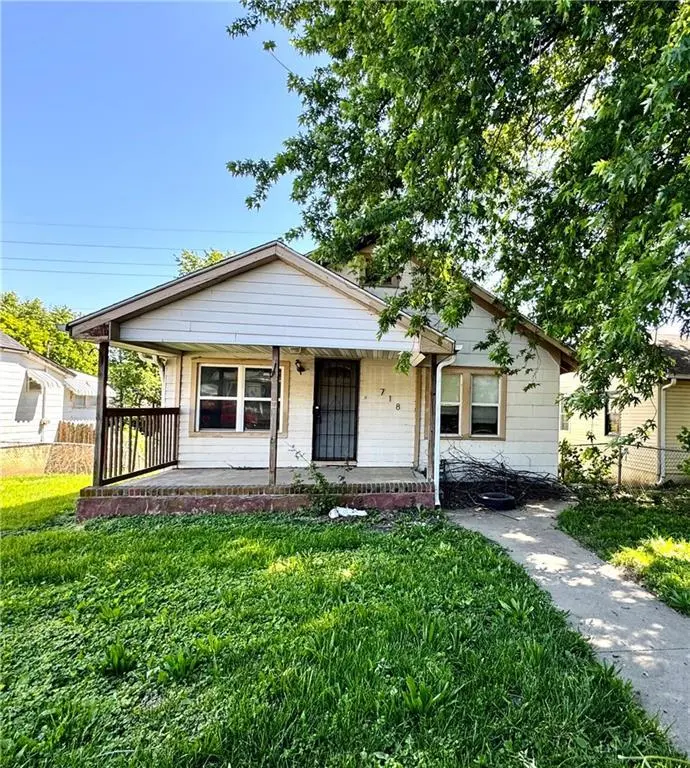
718 Thompson Ave · St. Joseph, MO
Flood risk 1/10 · Minimal
- FEMA flood zone
- X
- Chance of flooding over 30 yrs
- 0.0%
- Est. flood insurance / yr
- $473 – $860
Fire risk 2/10 · Minimal
- Est. fire insurance / yr
- $1,054 – $1,958
Heat risk 4/10 · Minor
- Hot days now (above 107°F)
- 7 days/yr
- Hot days in 30 yrs
- 16 days/yr
Wind risk 2/10 · Minimal
- Chance of severe wind over 30 yrs
- —
Air-quality risk 2/10 · Minimal
- Unhealthy air days now
- 0 days/yr
- Unhealthy air days in 30 yrs
- 1 days/yr
Risk factors via First Street. Map © Google.
Why this score? — see what drove the B grade
The composite is a weighted blend of 9 inputs, each scored 0–100. Each bar is that input's sub-score; the figure is the points it added to the 100-point composite (weight × sub-score).
- Cash flow +29.4/30.0
- ARV discount +15.0/15.0
- DSCR +10.0/10.0
- 1% rule +7.8/10.0
- Schools +2.8/10.0
- Rent growth +2.5/5.0
- Livability +2.5/5.0
- Condition / age +2.5/5.0
- Appreciation +0.0/10.0
$78,000
🖨 Deal sheet 📄 Offer letter ✓ Due diligence
Listing remarks MLS
* * * * Attention Investors. .. .. . Fixer-upper!!! A solid investment property priced for renovation! This investor-grade home needs updates and repairs and offers great potential for strong return on investment. Ready to jump into 2026 with your next investment Project!! This home is ready for your touches. .. . 1 bed on the main and 2 more were previously in the basement. The 2 car detached garage in back adds extra storage for the home. Take a look today!
Key facts
- 6,098 sq ft lot
- 2 garage spots
- Built 1937
Neighborhood map
What this means for you Summary
Snapshot
- This is a 3-bed/2.0-bath single-family listed at $78k.
Deal economics
- At list price, monthly cash flow is $277 ($3k/yr) — positive.
- The deal already cash-flows at list — no discount required.
- Meets the 1% rule at list price ($1k rent vs $78k).
- Recommended offer: $69k (12.0% below list) — sets the bar for market timing.
- Cap rate 10.6% vs local median 4.7% in St. Joseph — top-decile yield for the area; either an underpriced asset or a hidden risk that comps aren't pricing in. Stress-test before assuming the spread holds.
Location & tenants
- Location reads: area grade B — affects rentability + tenant quality, not the cash-flow math above.
- St. Joseph (urban): math 28% / reading 38% proficiency, ranked #241 of 324 in MO (top 74%) — families likely to look elsewhere, expect single-tenant / working-renter base with shorter leases.
- Market conditions: 54 active listings in the ZIP; 1 comparable units currently listed for rent nearby; 70 units permitted in Buchanan County in 2024 (0 in 5+ unit buildings).
Forward outlook
- Local home prices are declining (-3.0%/yr); year-one equity from $539 of loan paydown is wiped out by about $2k of value loss. Plan a longer hold.
- Buchanan County population projected to shrink 6% by 2050 — rents likely to lag national; underwrite the cash flow, not the appreciation.
- At projected returns (-3.0% appreciation + 3.0% rent growth), your $22k cash investment doubles in ~8 years — after that, you're playing with house money.
Negotiation context
- It's been on market 165 days — a 12% lower offer ($69k) is reasonable based on typical stale-listing flexibility.
- 6 sale attempts since 22y ago with the ask held roughly flat each time — persistent listings suggest the price (not the market) is what's stuck; bring a comps-based counter.
Risks & watch-outs
- Watch-outs: built in 1937 — expect roof / HVAC / electrical / plumbing capex.
Questions for the listing agent
- It's been on market 165 days. Have you received any prior offers? Is the seller open to a 12% concession, seller financing, or rate buy-down credit?
- Built in 1937 — when were the roof, HVAC, electrical panel, plumbing, and water heater last replaced?
- Why hasn't it sold? Are there any deal-killer items the seller is aware of (foundation, flood, title, zoning, code violations)?
- Is there a deadline driving the sale (1031 exchange, divorce, estate, relocation)? That informs how much negotiation room exists.
- What's the average days-on-market for RENTAL listings here right now (not sales)? A rising rental-DOM trend means longer vacancies and softer asking-rent achievability than the comps imply.
- What's the recent tenant-quality profile in this submarket — average credit score on applications, eviction rate, late-payment / NSF rate, and stable-employment percentage? A property-management company in the area should have these aggregated.
- How much new for-sale + rental construction is in the pipeline within 1–3 miles? Heavy new supply typically softens prices + rents 12–24 months out; constrained supply supports both.
Investment metrics
- 1% rule
- 1.28% ✓
- Cap rate
- 10.56%
- Cash-on-cash
- 15.22%
- DSCR
- 1.68
- GRM
- 6.5
CMA / ARV
- ARV (median comp)
- $125,999
- List price
- $78,000
- Delta
- -38.09%
- Verdict
- UNDERPRICED
- Comps
- 20 within 1.0 mi
Show comp detail 12 sales within ~0.75 mi
| Address | Dist | Beds/Ba | Sqft | Sold | Price | $/sf | Match |
|---|---|---|---|---|---|---|---|
| 706 Garden St | 0.13mi | 3/1.0 | 1,075 (+11%) | 7mo | $159,000 | $148 | 67 |
| 5620 S 9th St | 0.26mi | 3/1.0 | 874 (-10%) | 1mo | $135,000 | $154 | 66 |
| 5325 Sawyer St | 0.49mi | 3/1.0 | 964 (-1%) | 7mo | $84,500 | $88 | 66 |
| 1505 Mason Rd | 0.50mi | 2/1.0 (-1) | 1,000 (+3%) | 1mo | $120,000 | $120 | 62 |
| 717 Garden St | 0.15mi | 2/1.0 (-1) | 884 (-9%) | 8mo | $145,000 | $164 | 62 |
| 5705 S 16th St | 0.55mi | 3/2.0 | 1,016 (+4%) | 9mo | $150,000 | $148 | 59 |
| 321 Fleeman St | 0.53mi | 2/1.0 (-1) | 956 (-2%) | 7mo | $147,500 | $154 | 57 |
| 402 Blake St | 0.64mi | 2/1.0 (-1) | 932 (-4%) | 1mo | $139,000 | $149 | 54 |
| 212 Ohio St | 0.74mi | 2/1.0 (-1) | 940 (-3%) | 2mo | $90,000 | $96 | 50 |
| 5307 Halsey St | 0.56mi | 3/1.5 | 844 (-13%) | 5mo | $49,900 | $59 | 46 |
| 524 E Kansas Ave | 0.73mi | 3/1.5 | 1,080 (+11%) | 6mo | $159,900 | $148 | 40 |
| 206 Hammond St | 0.61mi | 2/1.0 (-1) | 834 (-14%) | 4mo | $107,000 | $128 | 36 |
Match score weights: distance 35% · size 25% · config 20% · recency 20%. Top-matched comps best support the ARV.
Projected returns pro-forma
-3.0% appreciation · 3.0% rent growth · sell at horizon
- IRR
- 5.9%
- Equity multiple
- 1.23×
- Total profit
- $5,007
- Equity at exit
- $11,630
- IRR
- 15.3%
- Equity multiple
- 2.24×
- Total profit
- $27,080
- Equity at exit
- $6,744
Cash invested: $21,840 (down + closing). Projections, not guarantees.
Landlord ↔ Tenant lean methodology
- Overall (STATE)
- 81 Strongly Landlord-Friendly
- State Missouri
- 81 Strongly Landlord-Friendly · R+10
- County
- — inherits STATE
- City
- — inherits STATE
ZIP-level market 64504
- Active inventory
- 54
- Price-to-rent
- 6.5×
Monthly cashflow live
- Estimated rent
- $1,000 medium interval (Pro) →
- Mortgage (P&I)
- −$409
- Tax from tax record
- −$71 /mo · $857/yr
- Insurance
- −$32
- HOA
- −$0
- Vacancy / Maint / Mgmt
- −$210
- Net cashflow
- $277
Break-even live
UW: 25.0% down · 7.5% · 30yr · 1.5% tax · 5.0% vac · 8.0% maint · 8.0% mgmt
Financing live
Cash to close
- Down payment
- $19,500
- Closing costs
- $2,340
- Reserves months
- —
- Total cash needed
- —
Loan-product check · same deal, 3 products live
Conventional
25% down · 7.5% · 30yr
- Down + closing
- —
- Monthly P&I
- —
- Monthly cashflow
- —
- DSCR
- —
- Eligible?
- —
Personal DTI + credit; lowest rate.
DSCR
20% down · 8.5% · 30yr
- Down + closing
- —
- Monthly P&I
- —
- Monthly cashflow
- —
- DSCR
- —
- Eligible?
- —
No personal income docs; deal must DSCR.
Hard money
10% down · 12.0% · 12mo
- Down + closing
- —
- Monthly P&I
- —
- Monthly cashflow
- —
- DSCR
- —
- Eligible?
- —
Short-term bridge; refi at stabilization.
Rent comps 1 comps
| Address | Beds | Baths | Sqft | Rent | $/sqft | DOM | Units | Dist |
|---|---|---|---|---|---|---|---|---|
| 5206 King Hill Ave Unit C St Joseph, MO | 2.0 | 1.0 | 1122 | $1,000 | $0.89 | 44d | 1 | 0.77mi |
Listing history 29 events
-
2026-06-19days on market $78,000 Active 165 DOM
-
2026-06-18days on market $78,000 Active 164 DOM
-
2026-06-17days on market $78,000 Active 163 DOM
-
2026-06-16days on market $78,000 Active 162 DOM
-
2026-06-15days on market $78,000 Active 161 DOM
-
2026-06-14days on market $78,000 Active 159 DOM
-
2026-06-12days on market $78,000 Active 158 DOM
-
2026-06-09days on market $78,000 Active 155 DOM
-
2026-06-08days on market $78,000 Active 154 DOM
-
2026-06-07days on market $78,000 Active 153 DOM
-
2026-06-03days on market $78,000 Active 149 DOM
-
2026-06-02days on market $78,000 Active 148 DOM
-
2026-06-01days on market $78,000 Active 147 DOM
-
2026-05-31days on market $78,000 Active 146 DOM
-
2026-05-30days on market $78,000 Active 145 DOM
-
2026-02-05price $78,000 468-char remark
Show marketing remark (468 chars)
* * * * Attention Investors. .. .. . Fixer-upper!!! A solid investment property priced for renovation! This investor-grade home needs updates and repairs and offers great potential for strong return on investment. Ready to jump into 2026 with your next investment Project!! This home is ready for your touches. .. . 1 bed on the main and 2 more were previously in the basement. The 2 car detached garage in back adds extra storage for the home. Take a look today!
-
2026-01-06$79,000 Active 468-char remark
Show marketing remark (468 chars)
* * * * Attention Investors. .. .. . Fixer-upper!!! A solid investment property priced for renovation! This investor-grade home needs updates and repairs and offers great potential for strong return on investment. Ready to jump into 2026 with your next investment Project!! This home is ready for your touches. .. . 1 bed on the main and 2 more were previously in the basement. The 2 car detached garage in back adds extra storage for the home. Take a look today!
-
2026-01-04historical $79,000 468-char remark
Show marketing remark (468 chars)
* * * * Attention Investors. .. .. . Fixer-upper!!! A solid investment property priced for renovation! This investor-grade home needs updates and repairs and offers great potential for strong return on investment. Ready to jump into 2026 with your next investment Project!! This home is ready for your touches. .. . 1 bed on the main and 2 more were previously in the basement. The 2 car detached garage in back adds extra storage for the home. Take a look today!
-
2017-10-02soldstatus 174-char remark
Show marketing remark (174 chars)
All appliances stay inlcuding washer/dryer. The owner has made many updates since purchased including a roof. Large detached garage has a work bench and shelving for storage.
-
2017-10-02soldstatus
Show marketing remark (174 chars)
All appliances stay inlcuding washer/dryer. The owner has made many updates since purchased including a roof. Large detached garage has a work bench and shelving for storage.
-
2017-08-31$59,900 174-char remark
Show marketing remark (174 chars)
All appliances stay inlcuding washer/dryer. The owner has made many updates since purchased including a roof. Large detached garage has a work bench and shelving for storage.
-
2015-12-30historical
-
2015-11-02$56,000
-
2015-10-19historical
-
2014-11-15$56,000
-
2013-05-01$59,900
-
2004-11-10soldstatus
-
2004-08-27$79,500
-
1997-04-28soldstatus
ⓘ Source: listings_history table (triggers on properties + properties_extension) + one-shot
backfill from property_details.listing_events for pre-trigger history.
Tax reassessment forecast MO · Resets to sale price
- Current annual tax
- $857 · $71/mo
- Projected year-2 tax
- $857 · $71/mo
- Expected delta
- $0/yr ($0/mo · 0.0%)
ⓘ Screening estimate from a state-policy table — verify with the county assessor before closing.
Climate risk First Street
- Flood 1/10 Low FEMA zone X · 0% chance over 30 yrs
- Wildfire 2/10 Low
- Heat 4/10 Moderate 7 d/yr ≥107°F today · 16 d/yr by 30 yrs out
- Wind 2/10 Low
- Air quality 2/10 Low 0 unhealthy d/yr today · 1 by 30 yrs out
Nearby sold comps map
Loading sold comps map…
Walkable amenities ~0.75 mi
Loading nearby amenities…
Taxation est. · year 1
- Rental income
- $12,000
- − Mortgage interest
- −$4,369
- − Property taxes
- −$857
- − Insurance
- −$390
- − Repairs & maintenance
- −$960
- − Management
- −$960
- − Depreciation
- −$2,269
- Taxable income
- $2,195
- Est. tax owed @ 24.0%
- −$527
- After-tax cash flow
- $2,798/yr
For passive investors: Depreciation is non-cash, so a rental often shows a tax loss while cash-flowing — sheltering income. Rental losses are passive: they offset passive income freely, and up to $25,000/yr can offset ordinary (W-2) income if you actively participate and your MAGI is under $100k (phasing out to $0 by $150k); unused losses carry forward. On sale, claimed depreciation is recaptured at up to 25%, and gains may owe capital-gains tax (a 1031 exchange can defer both). Figures are a year-1 estimate at your 24.0% rate — not tax advice; consult a CPA.
Schools (NCES district)
- District
- St. Joseph
- NCES district ID
- 2927060
- Math proficiency
- 28% ▼ -6.00%
- Reading proficiency
- 38% ▼ -1.00%
- Median HH income
- $43,007
- Composite
- 27.99/100
- National rank
- #6853
- State rank
- #241 of 324 in MO
Livability — St. Joseph
No livability data for this city. (Only ~50 U.S. cities are tracked.)
Census & demographics
- Census place
- St. Joseph, MO
- City population
- 44,382
- Population (ZIP)
- 10,286
Population outlook (Buchanan County) Hauer SSP2
- Today (2025)
- 89,041 people
- By 2030
- 88,401 · -0.7%
- By 2040
- 86,220 · -3.2%
- By 2050
- 83,603 · -6.1%
- By 2075
- 76,750 · -13.8%
- By 2100
- 67,623 · -24.1%
Race, ethnicity, and origin ACS 2023
- Neighborhood character
- Predominantly White (83%)
- Race & ethnicity
- White 83% Hispanic / Latino 9% Two or more races 7% Black 3% Native American 1%
- Hispanic origin (detail)
- Mexican 4% Cuban 2%
- Common ancestry
- Lithuanian 2% Romanian 2% Slovak 2%
- Foreign-born
- 4% · Canada
- Languages at home
- 94% English-only · Spanish 5%
Political lean MEDSL · Buchanan
- 2024 margin
- Strong R (+28.0) · D 35.2% · R 63.3% · Other 1.5%
- 2008→2024 swing
- -28.2pp toward R · 2008: 0.1pp · 2024: -28.0pp
- All cycles
- 2024: R+28.0 2020: R+24.6 2016: R+26.2 2012: R+8.7 2008: D+0.1
Not yet ingested
- Civics
- —
Market trends
- HPI YoY
- ▼ -100.84%
- Current HPI
- 149.9895
- Rent YoY
- —
- Metro
- —
- State GDP YoY
- ▲ 1.84%
- F500 in state
- 20
Industry mix (Fortune 500 HQ in MO)
| Industry | F500 HQs | Revenue |
|---|---|---|
| Healthcare | 1 | $163B |
|
||
| Insurance | 1 | $21B |
|
||
| Industrial Technology | 1 | $17B |
|
||
| Retail | 1 | $16B |
|
||
| Industrial Distribution | 1 | $10B |
|
||
| Utilities | 1 | $9B |
|
||
Price history
-1.9% since first listed14 events — show timeline
- 2026-02-05 Price Changed $78,000 Heartland MLS as Distributed by MLS Grid
- 2026-01-06 Listed $79,000 Heartland MLS as Distributed by MLS Grid
- 2026-01-04 Coming Soon $79,000 Heartland MLS as Distributed by MLS Grid
- 2017-10-02 Sold (Public Records) — Public Records
- 2017-10-02 Sold (MLS) — Heartland MLS as Distributed by MLS Grid
- 2017-08-31 Listed $59,900 Heartland MLS as Distributed by MLS Grid
- 2015-12-30 Listing Removed — Heartland MLS as Distributed by MLS Grid
- 2015-11-02 Listed $56,000 Heartland MLS as Distributed by MLS Grid
- 2015-10-19 Listing Removed — Heartland MLS as Distributed by MLS Grid
- 2014-11-15 Listed $56,000 Heartland MLS as Distributed by MLS Grid
- 2013-05-01 Listed $59,900 Heartland MLS as Distributed by MLS Grid
- 2004-11-10 Sold (MLS) — Heartland MLS as Distributed by MLS Grid
- 2004-08-27 Listed $79,500 Heartland MLS as Distributed by MLS Grid
- 1997-04-28 Sold (Public Records) — Public Records
Property tax history
+1.4%/yrLatest (2025): $857 · +4.3% YoY. Source: county tax records.
Cash-flow waterfall
monthlySold comps — $/sqft
last 12 mo · ≤1 miLoading sold comps…