 11-Plex
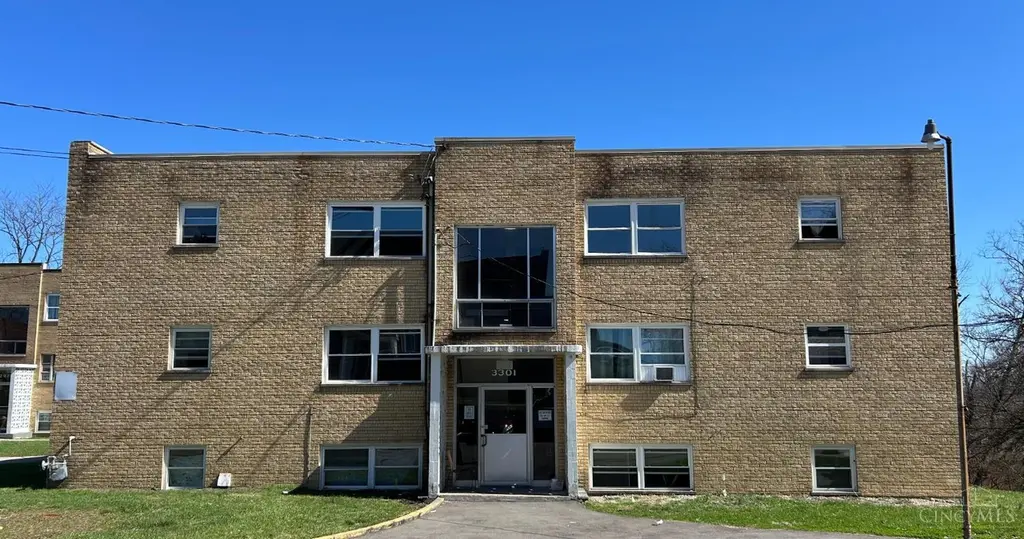
3301 Camvic Ter · Cheviot, OH
Flood risk 1/10 · Minimal
- FEMA flood zone
- X (unshaded)
- Chance of flooding over 30 yrs
- 0.0%
- Est. flood insurance / yr
- $507 – $1,088
Fire risk 1/10 · Minimal
- Est. fire insurance / yr
- $713 – $1,323
Heat risk 4/10 · Minor
- Hot days now (above 102°F)
- 7 days/yr
- Hot days in 30 yrs
- 19 days/yr
Wind risk 2/10 · Minimal
- Chance of severe wind over 30 yrs
- 1.0%
Air-quality risk 2/10 · Minimal
- Unhealthy air days now
- 1 days/yr
- Unhealthy air days in 30 yrs
- 1 days/yr
Risk factors via First Street. Map © Google.
Why this score? — see what drove the C grade
The composite is a weighted blend of 9 inputs, each scored 0–100. Each bar is that input's sub-score; the figure is the points it added to the 100-point composite (weight × sub-score).
- Cash flow +22.6/30.0
- ARV discount +7.5/15.0
- DSCR +7.2/10.0
- 1% rule +5.8/10.0
- Livability +3.9/5.0
- Rent growth +3.4/5.0
- Schools +2.5/10.0
- Condition / age +2.5/5.0
- Appreciation +0.0/10.0
$995,000
🖨 Deal sheet 📄 Offer letter ✓ Due diligence
Multi-family units
County records classify this as Multi-Family (5+ Unit). Listing-text estimate: 11 units. confirmed
5+ unit building — per-unit beds/baths from public records are typically unavailable; the breakdown below (if shown) is an estimate from the listing text.
Listing remarks MLS
Excellent investment opportunity in Cheviot. 11-one BR unit brick building with long-term tenants on month-to-month leases. Additional 30x60 storage garage and coin-op washer/dryer for additional revenue. Parking and storage for each unit. Newer membrane roof, newer windows & plumbing.
Key facts
- Large extra building
- Completely renovated
- Cul-de-sac
Tags
Property features AI
Finance
- Other: Owner pays heat and water
- Financial info: Total of 11 units; All units are 1-bedroom; Typical 1-bedroom rent listed at $1,090
- HOA & community: Maintenance expense: $1,680
Exterior
- Parking: Detached garage; 11 open parking spaces; Parking on lot
- Utilities: Public water; Public sewer; Natural gas
- Home design: Three+ levels; Single building
- Construction: Block foundation
- Exterior features: Vinyl windows; Membrane roof; Brick exterior
Interior
- Bedrooms: Eleven 1-bedroom units
- Heating & cooling: Steam heating (heat paid by owner); Window AC units; Separate A/C in units; Natural gas service; Separate gas/electric meters
- Interior features: Full basement
Neighborhood map
What this means for you Summary
Snapshot
- This is a 11 × 1-bed/1.0-bath units multifamily listed at $995k.
Deal economics
- At list price, monthly cash flow is $2k ($20k/yr) — positive. Per door: $154/mo.
- The deal already cash-flows at list — no discount required.
- Meets the 1% rule at list price ($11k rent vs $995k).
- Recommended offer: $935k (6.0% below list) — sets the bar for market timing.
- Cap rate 8.3% vs local median 5.1% in Cheviot — top-decile yield for the area; either an underpriced asset or a hidden risk that comps aren't pricing in. Stress-test before assuming the spread holds.
Location & tenants
- Location reads 78/100 on livability (#163 in OH, #2,446 nationally) — a middle-class / working-renter tenant base. Strengths: commute A+, cost of living A+, housing A+; Watch: crime C-, amenities D, employment F.
- Cincinnati Public Schools (urban): math 25% / reading 36% proficiency, ranked #581 of 656 in OH (top 89%) — families likely to look elsewhere, expect single-tenant / working-renter base with shorter leases; 70% free/reduced lunch — lower-income household profile, screen leases tightly.
- Market conditions: Rents rising (+3.6%/yr); 82 active listings in the ZIP; 801 units permitted in Hamilton County in 2024 (190 in 5+ unit buildings).
- At $10,770/mo this rent would consume 240% of the median local household income ($54k/yr) (locally 1916% of renters already pay >50% of income on rent) — very limited rent-growth headroom before tenants either downsize or default.
Forward outlook
- Local home prices are declining (-3.0%/yr); year-one equity from $7k of loan paydown is wiped out by about $30k of value loss. Plan a longer hold.
Negotiation context
- It's been on market 80 days — a 6% lower offer ($935k) is reasonable based on typical stale-listing flexibility.
- 5 sale attempts since 21y ago with the ask held roughly flat each time — persistent listings suggest the price (not the market) is what's stuck; bring a comps-based counter.
- Current owner paid $475k; list at $995k implies a 109% gain — meaningful room to come down on a strong offer.
Questions for the listing agent
- It's been on market 80 days. Have you received any prior offers? Is the seller open to a 6% concession, seller financing, or rate buy-down credit?
- Can we see the unit-by-unit rent roll, current vacancy, and any below-market leases? What's the average tenancy length?
- What capital expenditures (roof, boiler, parking lot, exteriors) have been made in the last 5 years, and what's planned in the next 2?
- Built in 1961 — when were the roof, HVAC, electrical panel, plumbing, and water heater last replaced?
- Why hasn't it sold? Are there any deal-killer items the seller is aware of (foundation, flood, title, zoning, code violations)?
- Is there a deadline driving the sale (1031 exchange, divorce, estate, relocation)? That informs how much negotiation room exists.
- What's the average days-on-market for RENTAL listings here right now (not sales)? A rising rental-DOM trend means longer vacancies and softer asking-rent achievability than the comps imply.
- What's the recent tenant-quality profile in this submarket — average credit score on applications, eviction rate, late-payment / NSF rate, and stable-employment percentage? A property-management company in the area should have these aggregated.
- How much new apartment / multifamily construction is in the pipeline within 1–3 miles? Heavy new supply (>2% of stock underway) typically softens rents 12–24 months out; light construction supports rent growth.
Investment metrics
- 1% rule
- 1.08% ✓
- Cap rate
- 8.33%
- Cash-on-cash
- 7.29%
- DSCR
- 1.32
- GRM
- 7.7
CMA / ARV
No comps found within radius.
Projected returns pro-forma
-3.0% appreciation · 3.64% rent growth · sell at horizon
- IRR
- -4.4%
- Equity multiple
- 0.83×
- Total profit
- $-46,334
- Equity at exit
- $148,358
- IRR
- 6.0%
- Equity multiple
- 1.46×
- Total profit
- $127,979
- Equity at exit
- $86,029
Cash invested: $278,600 (down + closing). Projections, not guarantees.
Landlord ↔ Tenant lean methodology
- Overall (STATE)
- 73 Landlord-Friendly
- State Ohio
- 73 Landlord-Friendly · R+6
- County
- — inherits STATE
- City
- — inherits STATE
ZIP-level market 45211
- Home prices YoY
- -32.0%
- Rents YoY
- 3.6%
- Active inventory
- 82
- Price-to-rent
- 84.7×
Monthly cashflow live
- Estimated rent
- $10,770 high interval (Pro) →
- Mortgage (P&I)
- −$5,218
- Tax from tax record
- −$1,183 /mo · $14,200/yr
- Insurance
- −$415
- HOA
- −$0
- Vacancy / Maint / Mgmt
- −$2,262
- Net cashflow
- $1,692
Break-even live
11-unit breakdown (identical units grouped — click to expand)
| Units | Beds | Baths | Est. rent |
|---|---|---|---|
| 11× units | 1 | 1 | $10,769 |
| #1 | 1 | 1 | $979 |
| #2 | 1 | 1 | $979 |
| #3 | 1 | 1 | $979 |
| #4 | 1 | 1 | $979 |
| #5 | 1 | 1 | $979 |
| #6 | 1 | 1 | $979 |
| #7 | 1 | 1 | $979 |
| #8 | 1 | 1 | $979 |
| #9 | 1 | 1 | $979 |
| #10 | 1 | 1 | $979 |
| #11 | 1 | 1 | $979 |
| Total (11 units) | $10,770 | ||
UW: 25.0% down · 7.5% · 30yr · 1.5% tax · 5.0% vac · 8.0% maint · 8.0% mgmt
Financing live
Cash to close
- Down payment
- $248,750
- Closing costs
- $29,850
- Reserves months
- —
- Total cash needed
- —
Loan-product check · same deal, 3 products live
Conventional
25% down · 7.5% · 30yr
- Down + closing
- —
- Monthly P&I
- —
- Monthly cashflow
- —
- DSCR
- —
- Eligible?
- —
Personal DTI + credit; lowest rate.
DSCR
20% down · 8.5% · 30yr
- Down + closing
- —
- Monthly P&I
- —
- Monthly cashflow
- —
- DSCR
- —
- Eligible?
- —
No personal income docs; deal must DSCR.
Hard money
10% down · 12.0% · 12mo
- Down + closing
- —
- Monthly P&I
- —
- Monthly cashflow
- —
- DSCR
- —
- Eligible?
- —
Short-term bridge; refi at stabilization.
Listing history 24 events
-
2026-06-18days on market $995,000 Active 80 DOM
-
2026-06-17days on market $995,000 Active 79 DOM
-
2026-06-16days on market $995,000 Active 78 DOM
-
2026-06-15days on market $995,000 Active 77 DOM
-
2026-06-13days on market $995,000 Active 75 DOM
-
2026-06-13days on market $995,000 Active 74 DOM
-
2026-06-09days on market $995,000 Active 71 DOM
-
2026-06-08days on market $995,000 Active 70 DOM
-
2026-06-07days on market $995,000 Active 69 DOM
-
2026-06-03days on market $995,000 Active 65 DOM
-
2026-06-02days on market $995,000 Active 64 DOM
-
2026-06-01days on market $995,000 Active 63 DOM
-
2026-05-31days on market $995,000 Active 62 DOM
-
2026-04-20status Active
-
2026-04-06historical Contingency Pending
-
2026-03-30$995,000 Active
-
2024-05-21soldstatus $475,000
-
2024-05-16soldstatus $475,000 Sold 290-char remark
Show marketing remark (290 chars)
Excellent investment opportunity in Cheviot. 11-one BR unit brick building with long-term tenants on month-to-month leases. Additional 30x60 storage garage and coin-op washer/dryer for additional revenue. Parking and storage for each unit. Newer membrane roof, newer windows & plumbing.
-
2024-05-06historical Contingency Pending 290-char remark
Show marketing remark (290 chars)
Excellent investment opportunity in Cheviot. 11-one BR unit brick building with long-term tenants on month-to-month leases. Additional 30x60 storage garage and coin-op washer/dryer for additional revenue. Parking and storage for each unit. Newer membrane roof, newer windows & plumbing.
-
2024-05-01$550,000 Active 290-char remark
Show marketing remark (290 chars)
Excellent investment opportunity in Cheviot. 11-one BR unit brick building with long-term tenants on month-to-month leases. Additional 30x60 storage garage and coin-op washer/dryer for additional revenue. Parking and storage for each unit. Newer membrane roof, newer windows & plumbing.
-
2015-06-28historical
-
2014-09-16$269,900 Active
-
2005-09-29soldstatus $290,000
-
2005-05-23$299,900
ⓘ Source: listings_history table (triggers on properties + properties_extension) + one-shot
backfill from property_details.listing_events for pre-trigger history.
Tax reassessment forecast OH · Partial reset (capped growth)
- Current annual tax
- $14,200 · $1,183/mo
- Projected year-2 tax
- $14,861 · $1,238/mo
- Expected delta
- +$661/yr (+$55/mo · 4.7%)
ⓘ Screening estimate from a state-policy table — verify with the county assessor before closing.
Climate risk First Street
- Flood 1/10 Low FEMA zone X (unshaded) · 0% chance over 30 yrs
- Wildfire 1/10 Low
- Heat 4/10 Moderate 7 d/yr ≥102°F today · 19 d/yr by 30 yrs out
- Wind 2/10 Low 100% chance of damaging wind over 30 yrs
- Air quality 2/10 Low 1 unhealthy d/yr today · 1 by 30 yrs out
Nearby sold comps map
Loading sold comps map…
Walkable amenities ~0.75 mi
Loading nearby amenities…
Taxation est. · year 1
- Rental income
- $129,240
- − Mortgage interest
- −$55,735
- − Property taxes
- −$14,200
- − Insurance
- −$4,975
- − Repairs & maintenance
- −$10,339
- − Management
- −$10,339
- − Depreciation
- −$28,945
- Taxable income
- $4,705
- Est. tax owed @ 24.0%
- −$1,129
- After-tax cash flow
- $19,180/yr
For passive investors: Depreciation is non-cash, so a rental often shows a tax loss while cash-flowing — sheltering income. Rental losses are passive: they offset passive income freely, and up to $25,000/yr can offset ordinary (W-2) income if you actively participate and your MAGI is under $100k (phasing out to $0 by $150k); unused losses carry forward. On sale, claimed depreciation is recaptured at up to 25%, and gains may owe capital-gains tax (a 1031 exchange can defer both). Figures are a year-1 estimate at your 24.0% rate — not tax advice; consult a CPA.
Schools (NCES district)
- District
- Cincinnati Public Schools
- NCES district ID
- 3904375
- Math proficiency
- 25% ▼ -19.00%
- Reading proficiency
- 36% ▼ -14.00%
- Median HH income
- $35,743
- Composite
- 25.21/100
- National rank
- #7508
- State rank
- #581 of 656 in OH
Livability — Cheviot
- Score
- 78/100
- State rank
- #163
- US rank
- #2446
Category grades
Schools grade is shown separately in the Schools card above.
Census & demographics
- Census place
- Cheviot, OH
- County
- Hamilton County · 701,295 people
- Metro
- Cincinnati, OH-KY-IN
- Population (ZIP)
- 38,049
- Household income
- $53,868
- Rent vs Own
- Severe rent burden
- 1916.0
Population outlook (Hamilton County) Hauer SSP2
- Today (2025)
- 826,054 people
- By 2030
- 830,947 · +0.6%
- By 2040
- 832,319 · +0.8%
- By 2050
- 822,428 · -0.4%
- By 2075
- 788,688 · -4.5%
- By 2100
- 710,674 · -14.0%
Race, ethnicity, and origin ACS 2023
- Neighborhood character
- Diverse neighborhood (Simpson 0.60)
- Race & ethnicity
- White 50% Black 38% Two or more races 8% Hispanic / Latino 6% Asian 2%
- Hispanic origin (detail)
- Mexican 4% Puerto Rican 1%
- Common ancestry
- Lithuanian 2% Italian 1% Romanian 1%
- Foreign-born
- 5% · Canada
- Languages at home
- 91% English-only · Spanish 4% French/Haitian/Cajun 1% Other Indo-European 1%
Political lean MEDSL · Hamilton
- 2024 margin
- D (+14.9) · D 57.0% · R 42.1%
- 2008→2024 swing
- +7.9pp toward D · 2008: 7.0pp · 2024: 14.9pp
- All cycles
- 2024: D+14.9 2020: D+15.9 2016: D+9.5 2012: D+4.9 2008: D+7.0
Not yet ingested
- Civics
- —
Market trends
- HPI YoY
- ▼ -101.15%
- Current HPI
- 215.0659
- Rent YoY
- ▲ 3.64%
- Metro
- Cincinnati, OH-KY-IN
- State GDP YoY
- ▲ 1.98%
- F500 in state
- 48
Industry mix (Fortune 500 HQ in OH)
| Industry | F500 HQs | Revenue |
|---|---|---|
| Insurance | 3 | $145B |
|
||
| Industrial Machinery | 3 | $49B |
|
||
| Financial Services | 3 | $24B |
|
||
| Consumer Goods | 2 | $93B |
|
||
| Aerospace / Defense | 2 | $47B |
|
||
| Utilities | 2 | $33B |
|
||
Price history
+231.8% since first listed11 events — show timeline
- 2026-04-20 Relisted — Cincy MLS
- 2026-04-06 Contingent — Cincy MLS
- 2026-03-30 Listed $995,000 Cincy MLS
- 2024-05-21 Sold (Public Records) $475,000 Public Records
- 2024-05-16 Sold (MLS) $475,000 Cincy MLS
- 2024-05-06 Contingent — Cincy MLS
- 2024-05-01 Listed $550,000 Cincy MLS
- 2015-06-28 Listing Removed — Cincy MLS
- 2014-09-16 Listed $269,900 Cincy MLS
- 2005-09-29 Sold (MLS) $290,000 Cincy MLS
- 2005-05-23 Listed $299,900 Cincy MLS
Property tax history
+4.5%/yrLatest (2025): $14,200 · -15.9% YoY. Source: county tax records.
Cash-flow waterfall
monthlySold comps — $/sqft
last 12 mo · ≤1 miLoading sold comps…