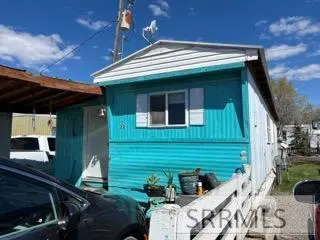
1149 S Yellowstone Hwy #22 · St. Anthony, ID
Flood risk 1/10 · Minimal
- FEMA flood zone
- X
- Chance of flooding over 30 yrs
- 0.0%
- Est. flood insurance / yr
- $435 – $905
Fire risk 2/10 · Minimal
- Est. fire insurance / yr
- $584 – $1,086
Heat risk 3/10 · Minor
- Hot days now (above threshold)
- 7 days/yr
- Hot days in 30 yrs
- 19 days/yr
Wind risk No data
- Chance of severe wind over 30 yrs
- —
Air-quality risk No data
- Unhealthy air days now
- —
- Unhealthy air days in 30 yrs
- —
Risk factors via First Street. Map © Google.
Why this score? — see what drove the D grade
The composite is a weighted blend of 9 inputs, each scored 0–100. Each bar is that input's sub-score; the figure is the points it added to the 100-point composite (weight × sub-score).
- Appreciation +10.0/10.0
- 1% rule +7.7/10.0
- ARV discount +7.5/15.0
- Cash flow +6.3/30.0
- Schools +3.4/10.0
- Rent growth +2.5/5.0
- Livability +2.5/5.0
- Condition / age +2.5/5.0
- DSCR +0.6/10.0
$60,000
🖨 Deal sheet (PDF) 📄 Offer letter ✓ Due diligence
Listing remarks
This 3-bedroom, 1-bathroom manufactured home offers 800 square feet of updated living space in an established community in St. Anthony. The home is move-in ready and priced at $60,000, with a lot rent of $350 per month. The layout provides three bedrooms suitable for a variety of living needs, along with a full bathroom and comfortable common areas. Updates throughout make this home ready for its next owner without the need for immediate repairs or renovations. Contact the listing agent today to take a look!
Key facts
- Garage
- Built 1968
- Listed 53 days
Property features AI
Finance
- HOA & community: Homeowners association with a $350 monthly fee
Exterior
- Parking: Attached garage; Gravel parking
- Utilities: Public water; Public sewer; Natural gas available
- Home design: Manufactured home; Single-story / One level; Residential property
- Construction: Metal siding
- Exterior features: Metal roof
Interior
- Kitchen: Refrigerator
- Flooring: Laminate flooring
- Bathrooms: One full bathroom
- Heating & cooling: Natural gas heating
- Interior features: Laminate countertops
Neighborhood map
What this means for you Summary
Snapshot
- This is a 3-bed/1.0-bath manufactured listed at $60k.
Deal economics
- At list price, monthly cash flow is $-107 ($-1k/yr) — negative.
- To cash-flow at today's rent, offer at most $41k (31.6% below list).
- Meets the 1% rule at list price ($764 rent vs $60k).
- Recommended offer: $41k (31.6% below list) — sets the bar for cash-flow.
Location & tenants
- Location reads: area grade D — affects rentability + tenant quality, not the cash-flow math above.
- Fremont County Joint District (rural): math 37% / reading 44% proficiency, ranked #63 of 92 in ID (top 68%) — families likely to look elsewhere, expect single-tenant / working-renter base with shorter leases.
- Zoned schools: Henrys Fork Elementary (math 42% / reading 43%, grade F, #216 of 357 statewide, top 60%, 603 students, 56% FRL); South Fremont Jr High (math 30% / reading 42%, grade F, #78 of 109 statewide, top 72%, 365 students, 49% FRL); South Fremont High School (math 27% / reading 67%, grade D-, #55 of 169 statewide, top 34%, 457 students, 40% FRL).
- Market conditions: 129 active listings in the ZIP; 135 units permitted in Fremont County in 2024 (0 in 5+ unit buildings).
Forward outlook
- In year one you build about $6k of equity ($415 loan paydown + $6k appreciation (10.0% local appreciation)).
- Fremont County population projected at -21% by 2050 — secular population decline; favor cash flow + early exit over multi-decade hold.
- By year 6, paydown + projected appreciation supports a ~$38k cash-out refi (75% LTV) — recoverable capital for the next deal without selling this one.
Negotiation context
- It's been on market 53 days — a 3% lower offer ($58k) is reasonable based on typical stale-listing flexibility.
Risks & watch-outs
- Watch-outs: HOA is 46% of rent.
Questions for the listing agent
- What do current leases actually rent for vs. the listed asking? Can we see a recent rent roll and the last 12 months of T-12 income?
- It's been on market 53 days. Have you received any prior offers? Is the seller open to a 32% concession, seller financing, or rate buy-down credit?
- Built in 1968 — when were the roof, HVAC, electrical panel, plumbing, and water heater last replaced?
- What does the HOA fee cover, when was the last increase, and are there any pending special assessments or reserve-fund shortfalls?
- Is there a deadline driving the sale (1031 exchange, divorce, estate, relocation)? That informs how much negotiation room exists.
- The area grade is low — what's the realistic commute time and amenity access for the typical tenant pool here? Any planned neighborhood developments (good or bad) we should know about?
- What's the average days-on-market for RENTAL listings here right now (not sales)? A rising rental-DOM trend means longer vacancies and softer asking-rent achievability than the comps imply.
- What's the recent tenant-quality profile in this submarket — average credit score on applications, eviction rate, late-payment / NSF rate, and stable-employment percentage? A property-management company in the area should have these aggregated.
- How much new for-sale + rental construction is in the pipeline within 1–3 miles? Heavy new supply typically softens prices + rents 12–24 months out; constrained supply supports both.
Investment metrics
- 1% rule
- 1.27% ✓
- Cap rate
- 4.15%
- Cash-on-cash
- -7.66%
- DSCR
- 0.66
- GRM
- 6.5
CMA / ARV
No comps found within radius.
Projected returns pro-forma
10.0% appreciation · 3.0% rent growth · sell at horizon
- IRR
- 19.0%
- Equity multiple
- 2.55×
- Total profit
- $26,043
- Equity at exit
- $54,053
- IRR
- 17.7%
- Equity multiple
- 5.91×
- Total profit
- $82,445
- Equity at exit
- $116,567
Cash invested: $16,800 (down + closing). Projections, not guarantees.
Landlord ↔ Tenant lean methodology
- Overall (STATE)
- 91 Strongly Landlord-Friendly
- State Idaho
- 91 Strongly Landlord-Friendly · R+18
- County
- — inherits STATE
- City
- — inherits STATE
ZIP-level market 83445
- Home prices YoY
- 10.2%
- Active inventory
- 129
- Price-to-rent
- 6.5×
Monthly cashflow live
- Estimated rent
- $764 medium interval (Pro) →
- Mortgage (P&I)
- −$315
- Tax from tax record
- −$21 /mo · $249/yr
- Insurance
- −$25
- HOA
- −$350
- Lot rent leased land?
- −$0
- Vacancy / Maint / Mgmt
- −$160
- Net cashflow
- $-107
Break-even live
Sensitivity live
| Price | -10% $-73 | -5% $-90 | +0% $-107 | +5% $-124 | +10% $-141 |
|---|---|---|---|---|---|
| Rent | -10% $-168 | -5% $-137 | +0% $-107 | +5% $-77 | +10% $-47 |
| Rate | -1.0pp $-77 | -0.5pp $-92 | base $-107 | +0.5pp $-123 | +1.0pp $-139 |
UW: 25.0% down · 7.5% · 30yr · 1.5% tax · 5.0% vac · 8.0% maint · 8.0% mgmt
Financing live
Cash to close
- Down payment
- $15,000
- Closing costs
- $1,800
- Reserves months
- —
- Total cash needed
- —
Loan-product check · same deal, 3 products live
Conventional
25% down · 7.5% · 30yr
- Down + closing
- —
- Monthly P&I
- —
- Monthly cashflow
- —
- DSCR
- —
- Eligible?
- —
Personal DTI + credit; lowest rate.
DSCR
20% down · 8.5% · 30yr
- Down + closing
- —
- Monthly P&I
- —
- Monthly cashflow
- —
- DSCR
- —
- Eligible?
- —
No personal income docs; deal must DSCR.
Hard money
10% down · 12.0% · 12mo
- Down + closing
- —
- Monthly P&I
- —
- Monthly cashflow
- —
- DSCR
- —
- Eligible?
- —
Short-term bridge; refi at stabilization.
HOA detail
- Monthly dues
- $350 · $4,200/yr
Listing history 18 events
-
2026-06-22days on market $60,000 Active 53 DOM
-
2026-06-21days on market $60,000 Active 52 DOM
-
2026-06-19days on market $60,000 Active 50 DOM
-
2026-06-18days on market $60,000 Active 49 DOM
-
2026-06-17days on market $60,000 Active 48 DOM
-
2026-06-16days on market $60,000 Active 47 DOM
-
2026-06-15days on market $60,000 Active 46 DOM
-
2026-06-14days on market $60,000 Active 44 DOM
-
2026-06-12days on market $60,000 Active 43 DOM
-
2026-06-09days on market $60,000 Active 40 DOM
-
2026-06-08days on market $60,000 Active 39 DOM
-
2026-06-07days on market $60,000 Active 38 DOM
-
2026-06-03days on market $60,000 Active 34 DOM
-
2026-06-02days on market $60,000 Active 33 DOM
-
2026-06-01pricedays on market $60,000 Active 32 DOM
-
2026-05-31days on market $75,000 Active 31 DOM
-
2026-05-30days on market $75,000 Active 30 DOM
-
2026-04-29$75,000 Active
ⓘ Source: listings_history table (triggers on properties + properties_extension) + one-shot
backfill from property_details.listing_events for pre-trigger history.
Tax reassessment forecast ID · Resets to sale price
- Current annual tax
- $249 · $21/mo
- Projected year-2 tax
- $414 · $34/mo
- Expected delta
- +$165/yr (+$14/mo · 66.2%)
ⓘ Screening estimate from a state-policy table — verify with the county assessor before closing.
Climate risk First Street
- Flood 1/10 Low FEMA zone X · 0% chance over 30 yrs
- Wildfire 2/10 Low
- Heat 3/10 Moderate
Nearby sold comps map
Loading sold comps map…
Walkable amenities ~0.75 mi
Loading nearby amenities…
Taxation est. · year 1
- Rental income
- $9,162
- − Mortgage interest
- −$3,361
- − Property taxes
- −$249
- − Insurance
- −$300
- − Repairs & maintenance
- −$733
- − Management
- −$733
- − HOA
- −$4,200
- − Depreciation
- −$1,745
- Taxable loss
- −$2,159
- Est. tax savings @ 24.0%
- +$518
- After-tax cash flow
- $-768/yr
For passive investors: Depreciation is non-cash, so a rental often shows a tax loss while cash-flowing — sheltering income. Rental losses are passive: they offset passive income freely, and up to $25,000/yr can offset ordinary (W-2) income if you actively participate and your MAGI is under $100k (phasing out to $0 by $150k); unused losses carry forward. On sale, claimed depreciation is recaptured at up to 25%, and gains may owe capital-gains tax (a 1031 exchange can defer both). Figures are a year-1 estimate at your 24.0% rate — not tax advice; consult a CPA.
Schools (NCES district)
- District
- Fremont County Joint District
- NCES district ID
- 1601110
- Math proficiency
- 37% ▲ 1.00%
- Reading proficiency
- 44% ▼ -2.00%
- Median HH income
- $45,591
- Composite
- 34.47/100
- National rank
- #5187
- State rank
- #63 of 92 in ID
Livability — St. Anthony
No livability data for this city. (Only ~50 U.S. cities are tracked.)
Census & demographics
- Census place
- St. Anthony, ID
- Population (ZIP)
- 7,514
Population outlook (Fremont County) Hauer SSP2
- Today (2025)
- 12,247 people
- By 2030
- 11,817 · -3.5%
- By 2040
- 10,832 · -11.6%
- By 2050
- 9,725 · -20.6%
- By 2075
- 6,685 · -45.4%
- By 2100
- 3,942 · -67.8%
Race, ethnicity, and origin ACS 2023
- Neighborhood character
- Predominantly White (77%)
- Race & ethnicity
- White 77% Hispanic / Latino 17% Two or more races 6% Native American 2%
- Hispanic origin (detail)
- Mexican 15% Puerto Rican 1%
- Common ancestry
- Slovak 3% Portuguese 3% Lithuanian 3%
- Foreign-born
- 6% · Canada
- Languages at home
- 88% English-only · Spanish 12%
Political lean MEDSL · Fremont
- 2024 margin
- Solid R (+69.0) · D 14.0% · R 83.0% · Other 3.0%
- 2008→2024 swing
- -7.1pp toward R · 2008: -61.8pp · 2024: -69.0pp
- All cycles
- 2024: R+69.0 2020: R+67.7 2016: R+60.2 2012: R+70.6 2008: R+61.8
Not yet ingested
- Civics
- —
Market trends
- HPI YoY
- ▲ 52.68%
- Current HPI
- 568.0
- Rent YoY
- —
- Metro
- —
- State GDP YoY
- ▲ 4.51%
- F500 in state
- 6
Industry mix (Fortune 500 HQ in ID)
| Industry | F500 HQs | Revenue |
|---|---|---|
| Retail | 1 | $79B |
|
||
| Technology | 1 | $25B |
|
||
| Food / Agriculture | 1 | $6B |
|
||
Price history
1 event — show timeline
- 2026-04-29 Listed $75,000 SRMLS
Property tax history
+5.2%/yrLatest (2025): $249 · +4.1% YoY. Source: county tax records.
Cash-flow waterfall
monthlySold comps — $/sqft
last 12 mo · ≤1 miLoading sold comps…