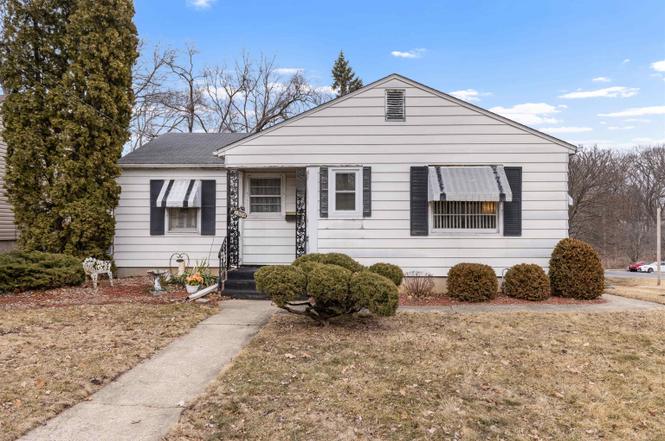
2508 Pelham Rd · Rockford, IL
Flood risk 1/10 · Minimal
- FEMA flood zone
- X (unshaded)
- Chance of flooding over 30 yrs
- 0.0%
- Est. flood insurance / yr
- $473 – $860
Fire risk 1/10 · Minimal
- Est. fire insurance / yr
- $804 – $1,492
Heat risk 2/10 · Minimal
- Hot days now (above 101°F)
- 7 days/yr
- Hot days in 30 yrs
- 15 days/yr
Wind risk 2/10 · Minimal
- Chance of severe wind over 30 yrs
- —
Air-quality risk 2/10 · Minimal
- Unhealthy air days now
- 1 days/yr
- Unhealthy air days in 30 yrs
- 2 days/yr
Risk factors via First Street. Map © Google.
Why this score? — see what drove the B grade
The composite is a weighted blend of 9 inputs, each scored 0–100. Each bar is that input's sub-score; the figure is the points it added to the 100-point composite (weight × sub-score).
- Cash flow +30.0/30.0
- ARV discount +15.0/15.0
- DSCR +10.0/10.0
- 1% rule +8.1/10.0
- Rent growth +4.0/5.0
- Livability +3.1/5.0
- Condition / age +2.5/5.0
- Schools +1.2/10.0
- Appreciation +0.0/10.0
$115,000
🖨 Deal sheet (PDF) 📄 Offer letter ✓ Due diligence
Listing remarks MLS
3-bedroom ranch with a 1 car attached garage and fenced yard. Home features some vinyl windows and functional layout with opportunity for updates and improvements. Property is being sold AS-IS WHERE-IS. Buyer to verify all information, lot lines, condition, and property details to their satisfaction. Inspections are welcome for buyer knowledge only; seller will make no repairs. Some personal property will remain and will not be removed. Home will not be cleaned out prior to closing. Needs TLC. Property backs up to the College of Medicine. Showings stop at 6:30pm Sunday 2/22
Key facts
- Vinyl windows
- Fenced yard
- Functional layout
Tags
Neighborhood map
What this means for you Summary
Snapshot
- This is a 3-bed/1.0-bath single-family listed at $115k.
Deal economics
- At list price, monthly cash flow is $479 ($6k/yr) — positive.
- The deal already cash-flows at list — no discount required.
- Meets the 1% rule at list price ($2k rent vs $115k).
- Cap rate 11.3% vs local median 6.1% in Rockford — top-decile yield for the area; either an underpriced asset or a hidden risk that comps aren't pricing in. Stress-test before assuming the spread holds.
Location & tenants
- Location reads 62/100 on livability (#876 in IL) — a middle-class / working-renter tenant base. Strengths: cost of living A+, housing A+, health & safety A+; Watch: crime F, amenities F, commute F.
- Rockford SD 205 (urban): math 12% / reading 16% proficiency, ranked #533 of 620 in IL (top 86%) — low school quality limits family demand, transient renter base, plan for 1-2y turnover; 73% free/reduced lunch — lower-income household profile, screen leases tightly.
- Zoned schools: C Henry Bloom Elem School (math 12% / reading 8%, grade F, #1,517 of 2,056 statewide, top 78%, 410 students, 0% FRL); Abraham Lincoln Middle School (math 3% / reading 7%, grade F, #636 of 665 statewide, top 98%, 699 students, 0% FRL); Rockford East High School (math 7% / reading 13%, grade F, #528 of 693 statewide, top 82%, 1,718 students, 0% FRL) — zoned schools average 0% FRL vs 73% district-wide (73 pts lower); this property's tenant base skews higher-income than the district average.
- Market conditions: Rents rising fast (+5.9%/yr); 157 active listings in the ZIP; 6 comparable units currently listed for rent nearby; rentals at typical pace (median 15d on market — plan ~3-4 weeks tenant-placement turnaround); solid renter incomes; 285 units permitted in Winnebago County in 2024 (0 in 5+ unit buildings).
Forward outlook
- Local home prices are declining (-3.0%/yr); year-one equity from $795 of loan paydown is wiped out by about $3k of value loss. Plan a longer hold.
- Winnebago County population projected at -20% by 2050 — secular population decline; favor cash flow + early exit over multi-decade hold.
- At projected returns (-3.0% appreciation + 5.9% rent growth), your $32k cash investment doubles in ~6 years — after that, you're playing with house money.
Negotiation context
- Only 3 days on market — expect competitive offers; lowballing is unlikely to land.
- 2 sale attempts with the ask held roughly flat each time — persistent listings suggest the price (not the market) is what's stuck; bring a comps-based counter.
Risks & watch-outs
- Watch-outs: built in 1935 — expect roof / HVAC / electrical / plumbing capex.
Questions for the listing agent
- Built in 1935 — when were the roof, HVAC, electrical panel, plumbing, and water heater last replaced?
- Is there a deadline driving the sale (1031 exchange, divorce, estate, relocation)? That informs how much negotiation room exists.
- Schools are F-rated, which usually means shorter tenancies and higher turnover. Who's the typical renter profile here, and what's been the actual vacancy rate?
- Crime grade is F in this area — have there been break-ins, vandalism, or insurance claims at this property in the last 3 years? What carrier currently insures it and at what premium?
- What's the average days-on-market for RENTAL listings here right now (not sales)? A rising rental-DOM trend means longer vacancies and softer asking-rent achievability than the comps imply.
- What's the recent tenant-quality profile in this submarket — average credit score on applications, eviction rate, late-payment / NSF rate, and stable-employment percentage? A property-management company in the area should have these aggregated.
- How much new for-sale + rental construction is in the pipeline within 1–3 miles? Heavy new supply typically softens prices + rents 12–24 months out; constrained supply supports both.
Investment metrics
- 1% rule
- 1.31% ✓
- Cap rate
- 11.29%
- Cash-on-cash
- 17.86%
- DSCR
- 1.79
- GRM
- 6.4
CMA / ARV
- ARV (on-the-fly)
- $184,144
- Comps found
- 12
Show comp detail 12 sales within ~0.75 mi
| Address | Dist | Beds/Ba | Sqft | Sold | Price | $/sf | Match |
|---|---|---|---|---|---|---|---|
| 2812 Guilford Rd | 0.41mi | 3/2.0 | 1,356 (+0%) | 3mo | $184,900 | $136 | 74 |
| 3012 Burrmont Rd | 0.32mi | 3/2.0 | 1,384 (+2%) | 8mo | $190,000 | $137 | 70 |
| 1419 Stratford Ave | 0.50mi | 3/2.0 | 1,404 (+4%) | 5mo | $170,000 | $121 | 63 |
| 1419 Roncevalles Ave | 0.56mi | 3/1.0 | 1,406 (+4%) | 7mo | $176,000 | $125 | 62 |
| 2820 Buckingham Dr | 0.21mi | 2/1.0 (-1) | 1,156 (-15%) | 4mo | $155,000 | $134 | 58 |
| 2202 Princeton Ave | 0.52mi | 2/2.0 (-1) | 1,428 (+6%) | 2mo | $205,000 | $144 | 56 |
| 1423 Roncevalles Ave | 0.56mi | 3/2.0 | 1,241 (-8%) | 3mo | $195,000 | $157 | 54 |
| 641 Paris Ave | 0.72mi | 3/1.5 | 1,400 (+3%) | 7mo | $172,500 | $123 | 53 |
| 3020 Barrington Pl | 0.35mi | 4/2.0 (+1) | 1,538 (+14%) | 6mo | $191,000 | $124 | 47 |
| 3504 Brendenwood Rd | 0.66mi | 3/1.5 | 1,500 (+11%) | 3mo | $183,000 | $122 | 47 |
| 732 James Ave | 0.53mi | 2/1.0 (-1) | 1,166 (-14%) | 3mo | $180,000 | $154 | 45 |
| 701 Lundvall Ave | 0.61mi | 4/2.0 (+1) | 1,163 (-14%) | 7mo | $160,000 | $138 | 33 |
Match score weights: distance 35% · size 25% · config 20% · recency 20%. Top-matched comps best support the ARV.
Projected returns pro-forma
-3.0% appreciation · 5.92% rent growth · sell at horizon
- IRR
- 12.4%
- Equity multiple
- 1.51×
- Total profit
- $16,394
- Equity at exit
- $17,147
- IRR
- 23.4%
- Equity multiple
- 3.27×
- Total profit
- $73,234
- Equity at exit
- $9,943
Cash invested: $32,200 (down + closing). Projections, not guarantees.
Landlord ↔ Tenant lean methodology
- Overall (STATE)
- 43 Moderately Tenant-Leaning
- State Illinois
- 43 Moderately Tenant-Leaning · D+7
- County
- — inherits STATE
- City
- — inherits STATE
ZIP-level market 61107
- Home prices YoY
- -20.1%
- Rents YoY
- 5.9%
- Active inventory
- 157
- Price-to-rent
- 6.4×
Monthly cashflow live
- Estimated rent
- $1,502 high interval (Pro) →
- Mortgage (P&I)
- −$603
- Tax from tax record
- −$56 /mo · $676/yr
- Insurance
- −$48
- HOA
- −$0
- Vacancy / Maint / Mgmt
- −$315
- Net cashflow
- $479
Break-even live
Sensitivity live
| Price | -10% $544 | -5% $512 | +0% $479 | +5% $447 | +10% $414 |
|---|---|---|---|---|---|
| Rent | -10% $361 | -5% $420 | +0% $479 | +5% $538 | +10% $598 |
| Rate | -1.0pp $537 | -0.5pp $508 | base $479 | +0.5pp $449 | +1.0pp $419 |
UW: 25.0% down · 7.5% · 30yr · 1.5% tax · 5.0% vac · 8.0% maint · 8.0% mgmt
Financing live
Cash to close
- Down payment
- $28,750
- Closing costs
- $3,450
- Reserves months
- —
- Total cash needed
- —
Loan-product check · same deal, 3 products live
Conventional
25% down · 7.5% · 30yr
- Down + closing
- —
- Monthly P&I
- —
- Monthly cashflow
- —
- DSCR
- —
- Eligible?
- —
Personal DTI + credit; lowest rate.
DSCR
20% down · 8.5% · 30yr
- Down + closing
- —
- Monthly P&I
- —
- Monthly cashflow
- —
- DSCR
- —
- Eligible?
- —
No personal income docs; deal must DSCR.
Hard money
10% down · 12.0% · 12mo
- Down + closing
- —
- Monthly P&I
- —
- Monthly cashflow
- —
- DSCR
- —
- Eligible?
- —
Short-term bridge; refi at stabilization.
Rent comps 6 comps
| Address | Beds | Baths | Sqft | Rent | $/sqft | DOM | Units | Dist |
|---|---|---|---|---|---|---|---|---|
| 4719 Illinois St Loves Park, IL | 3.0 | 1.0 | 1188 | $1,600 | $1.35 | 15d | 1 | 1.11mi |
| 2021 2nd Ave Rockford, IL | 2.0 | 1.0 | 1250 | $1,000 | $0.80 | 15d | 1 | 1.32mi |
| 4300 Eastridge Dr Unit 1 Rockford, IL | 3.0 | 2.0 | 1500 | $1,575 | $1.05 | 15d | 1 | 1.42mi |
| 4173 Eastridge Dr Rockford, IL | 3.0 | 1.0 | 1000 | $1,250 | $1.25 | 45d | 1 | 1.43mi |
| 1832 N Main St Rockford, IL | 2.0–3.0 | 1.0–2.0 | 872 | $1,199 | $1.37 | 15d | 1 | 1.48mi |
| 333 S Gardiner Ave Unit AVE2 Rockford, IL | 4.0 | 1.0 | 1306 | $1,600 | $1.23 | 45d | 1 | 1.49mi |
Listing history 4 events
-
2026-02-24status Pending 586-char remark
Show marketing remark (586 chars)
3-bedroom ranch with a 1 car attached garage and fenced yard. Home features some vinyl windows and functional layout with opportunity for updates and improvements. Property is being sold AS-IS WHERE-IS. Buyer to verify all information, lot lines, condition, and property details to their satisfaction. Inspections are welcome for buyer knowledge only; seller will make no repairs. Some personal property will remain and will not be removed. Home will not be cleaned out prior to closing. Needs TLC. Property backs up to the College of Medicine. Showings stop at 6:30pm Sunday 2/22
-
2026-02-24status Pending
Show marketing remark (586 chars)
3-bedroom ranch with a 1 car attached garage and fenced yard. Home features some vinyl windows and functional layout with opportunity for updates and improvements. Property is being sold AS-IS WHERE-IS. Buyer to verify all information, lot lines, condition, and property details to their satisfaction. Inspections are welcome for buyer knowledge only; seller will make no repairs. Some personal property will remain and will not be removed. Home will not be cleaned out prior to closing. Needs TLC. Property backs up to the College of Medicine. Showings stop at 6:30pm Sunday 2/22
-
2026-02-20$115,000 Active 586-char remark
Show marketing remark (586 chars)
3-bedroom ranch with a 1 car attached garage and fenced yard. Home features some vinyl windows and functional layout with opportunity for updates and improvements. Property is being sold AS-IS WHERE-IS. Buyer to verify all information, lot lines, condition, and property details to their satisfaction. Inspections are welcome for buyer knowledge only; seller will make no repairs. Some personal property will remain and will not be removed. Home will not be cleaned out prior to closing. Needs TLC. Property backs up to the College of Medicine. Showings stop at 6:30pm Sunday 2/22
-
2026-02-20$115,000 Active
Show marketing remark (586 chars)
3-bedroom ranch with a 1 car attached garage and fenced yard. Home features some vinyl windows and functional layout with opportunity for updates and improvements. Property is being sold AS-IS WHERE-IS. Buyer to verify all information, lot lines, condition, and property details to their satisfaction. Inspections are welcome for buyer knowledge only; seller will make no repairs. Some personal property will remain and will not be removed. Home will not be cleaned out prior to closing. Needs TLC. Property backs up to the College of Medicine. Showings stop at 6:30pm Sunday 2/22
ⓘ Source: listings_history table (triggers on properties + properties_extension) + one-shot
backfill from property_details.listing_events for pre-trigger history.
Tax reassessment forecast IL · Partial reset (capped growth)
- Current annual tax
- $676 · $56/mo
- Projected year-2 tax
- $1,643 · $137/mo
- Expected delta
- +$967/yr (+$81/mo · 143.0%)
ⓘ Screening estimate from a state-policy table — verify with the county assessor before closing.
Climate risk First Street
- Flood 1/10 Low FEMA zone X (unshaded) · 0% chance over 30 yrs
- Wildfire 1/10 Low
- Heat 2/10 Low 7 d/yr ≥101°F today · 15 d/yr by 30 yrs out
- Wind 2/10 Low
- Air quality 2/10 Low 1 unhealthy d/yr today · 2 by 30 yrs out
Nearby sold comps map
Loading sold comps map…
Walkable amenities ~0.75 mi
Loading nearby amenities…
Taxation est. · year 1
- Rental income
- $18,023
- − Mortgage interest
- −$6,442
- − Property taxes
- −$676
- − Insurance
- −$575
- − Repairs & maintenance
- −$1,442
- − Management
- −$1,442
- − Depreciation
- −$3,345
- Taxable income
- $4,101
- Est. tax owed @ 24.0%
- −$984
- After-tax cash flow
- $4,766/yr
For passive investors: Depreciation is non-cash, so a rental often shows a tax loss while cash-flowing — sheltering income. Rental losses are passive: they offset passive income freely, and up to $25,000/yr can offset ordinary (W-2) income if you actively participate and your MAGI is under $100k (phasing out to $0 by $150k); unused losses carry forward. On sale, claimed depreciation is recaptured at up to 25%, and gains may owe capital-gains tax (a 1031 exchange can defer both). Figures are a year-1 estimate at your 24.0% rate — not tax advice; consult a CPA.
Schools (NCES district)
- District
- Rockford SD 205
- NCES district ID
- 1734510
- Math proficiency
- 12% ▼ -2.00%
- Reading proficiency
- 16% ▼ -3.00%
- Median HH income
- $42,533
- Composite
- 12.21/100
- National rank
- #9649
- State rank
- #533 of 620 in IL
Livability — Rockford
- Score
- 62/100
- State rank
- #876
- US rank
- #17035
Category grades
Schools grade is shown separately in the Schools card above.
Census & demographics
- Census place
- Rockford, IL
- County
- Winnebago County · 147,297 people
- City population
- 147,297
- Metro
- Rockford, IL
- Population (ZIP)
- 30,765
- Household income
- $78,574
- Rent vs Own
- Severe rent burden
- 981.0
Population outlook (Winnebago County) Hauer SSP2
- Today (2025)
- 271,080 people
- By 2030
- 260,684 · -3.8%
- By 2040
- 238,405 · -12.1%
- By 2050
- 216,129 · -20.3%
- By 2075
- 172,882 · -36.2%
- By 2100
- 135,336 · -50.1%
Race, ethnicity, and origin ACS 2023
- Neighborhood character
- Predominantly White (68%)
- Race & ethnicity
- White 68% Hispanic / Latino 15% Black 9% Two or more races 9% Asian 4% Native American 1%
- Hispanic origin (detail)
- Mexican 11% Puerto Rican 1%
- Common ancestry
- Romanian 6% Portuguese 4% Lithuanian 2%
- Foreign-born
- 10% · Canada, China
- Languages at home
- 83% English-only · Spanish 11% Arabic 1% Other Indo-European 1%
Political lean MEDSL · Winnebago
- 2024 margin
- Toss-up / Even · D 49.5% · R 49.0% · Other 1.5%
- 2008→2024 swing
- -12.2pp toward R · 2008: 12.8pp · 2024: 0.6pp
- All cycles
- 2024: D+0.6 2020: D+2.5 2016: R+1.2 2012: D+5.7 2008: D+12.8
Not yet ingested
- Civics
- —
Market trends
- HPI YoY
- ▼ -62.46%
- Current HPI
- 248.8598
- Rent YoY
- ▲ 5.92%
- Metro
- Rockford, IL
- State GDP YoY
- ▲ 1.59%
- F500 in state
- 60
Industry mix (Fortune 500 HQ in IL)
| Industry | F500 HQs | Revenue |
|---|---|---|
| Insurance | 4 | $201B |
|
||
| Consumer Goods | 4 | $87B |
|
||
| Industrial Machinery | 3 | $64B |
|
||
| Healthcare | 2 | $55B |
|
||
| Retail / Pharmacy | 1 | $148B |
|
||
| Agriculture / Food | 1 | $86B |
|
||
Price history
+0.0% since first listed4 events — show timeline
- 2026-02-24 Pending — NWIAR
- 2026-02-24 Pending — MRED as Distributed by MLS Grid
- 2026-02-20 Listed $115,000 NWIAR
- 2026-02-20 Listed $115,000 MRED as Distributed by MLS Grid
Property tax history
-2.2%/yrLatest (2024): $676 · -8.7% YoY. Source: county tax records.
Cash-flow waterfall
monthlySold comps — $/sqft
last 12 mo · ≤1 miLoading sold comps…