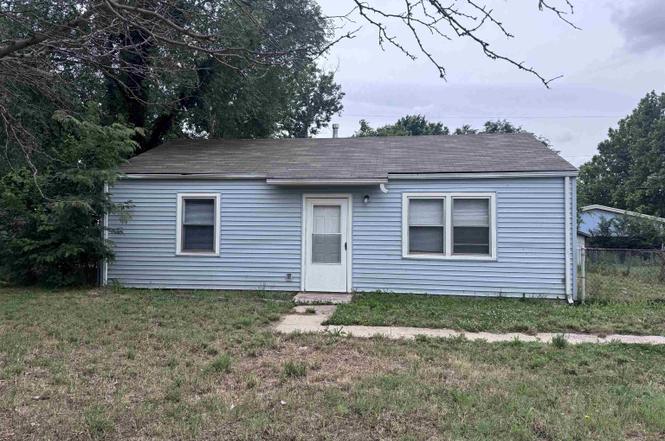
2929 E Idlewild Dr · Oaklawn-Sunview, KS
Flood risk 3/10 · Minor
- FEMA flood zone
- X (unshaded)
- Chance of flooding over 30 yrs
- 0.16%
- Est. flood insurance / yr
- $507 – $1,088
Fire risk 3/10 · Minor
- Est. fire insurance / yr
- $1,154 – $2,142
Heat risk 5/10 · Moderate
- Hot days now (above 106°F)
- 7 days/yr
- Hot days in 30 yrs
- 18 days/yr
Wind risk 2/10 · Minimal
- Chance of severe wind over 30 yrs
- —
Air-quality risk 2/10 · Minimal
- Unhealthy air days now
- 1 days/yr
- Unhealthy air days in 30 yrs
- 1 days/yr
Risk factors via First Street. Map © Google.
Why this score? — see what drove the B- grade
The composite is a weighted blend of 9 inputs, each scored 0–100. Each bar is that input's sub-score; the figure is the points it added to the 100-point composite (weight × sub-score).
- Cash flow +30.0/30.0
- 1% rule +10.0/10.0
- DSCR +10.0/10.0
- ARV discount +7.5/15.0
- Rent growth +3.8/5.0
- Schools +2.9/10.0
- Livability +2.5/5.0
- Condition / age +2.5/5.0
- Appreciation +0.0/10.0
$69,950
🖨 Deal sheet 📄 Offer letter ✓ Due diligence
Key facts
- Fenced yard
- New flooring
- New bathroom vanity
Tags
Property features AI
Exterior
- Utilities: Public water; Sewer available; Natural gas available
- Home design: Single-family onsite built; One story
- Construction: Composition roof; Slab foundation
- Exterior features: One level; Chain link fencing; Storage structure; Storm door(s)
Interior
- Kitchen: Range; Refrigerator
- Flooring: Laminate
- Bathrooms: 1 full bathroom
- Heating & cooling: Central air (electric); Forced air heating (natural gas)
- Interior features: Range; Refrigerator; Main-floor laundry in a separate room; Laminate flooring
- Laundry & utility: Laundry on the main floor in a separate room
Neighborhood map
What this means for you Summary
Snapshot
- This is a 2-bed/1.0-bath single-family listed at $70k.
Deal economics
- At list price, monthly cash flow is $419 ($5k/yr) — positive.
- The deal already cash-flows at list — no discount required.
- Meets the 1% rule at list price ($1k rent vs $70k).
Location & tenants
- Location reads: area grade B — affects rentability + tenant quality, not the cash-flow math above.
- Derby (suburban): math 29% / reading 36% proficiency, ranked #66 of 169 in KS (top 39%) — families likely to look elsewhere, expect single-tenant / working-renter base with shorter leases.
- Zoned schools: Oaklawn Elem (math 17% / reading 22%, grade F, #593 of 684 statewide, top 89%, 216 students, 91% FRL); Derby North Middle School (math 29% / reading 29%, grade F, #85 of 219 statewide, top 40%, 828 students, 48% FRL); Derby High School (math 17% / reading 21%, grade F, #230 of 327 statewide, top 71%, 2,172 students, 43% FRL) — zoned schools average 61% FRL vs 34% district-wide (26 pts higher); higher-poverty schools than district average — tighter screening recommended.
- Market conditions: Rents rising fast (+5.2%/yr); 18 active listings in the ZIP; 2,613 units permitted in Sedgwick County in 2024 (258 in 5+ unit buildings).
Forward outlook
- Local home prices are declining (-3.0%/yr); year-one equity from $484 of loan paydown is wiped out by about $2k of value loss. Plan a longer hold.
- Sedgwick County population projected at +5% by 2050 — modest demand growth; plan on rents tracking national, not racing it.
- At projected returns (-3.0% appreciation + 5.2% rent growth), your $20k cash investment doubles in ~5 years — after that, you're playing with house money.
Negotiation context
- Only 1 days on market — expect competitive offers; lowballing is unlikely to land.
- 2 sale attempts with the ask held roughly flat each time — persistent listings suggest the price (not the market) is what's stuck; bring a comps-based counter.
Risks & watch-outs
- Watch-outs: built in 1950 — expect roof / HVAC / electrical / plumbing capex.
- Climate carrying-cost: extreme-heat days projected 7→18/yr by 2055 (HVAC capex compounding) — expect insurance premiums to compound above CPI over the hold.
Questions for the listing agent
- Built in 1950 — when were the roof, HVAC, electrical panel, plumbing, and water heater last replaced?
- Is there a deadline driving the sale (1031 exchange, divorce, estate, relocation)? That informs how much negotiation room exists.
- What's the average days-on-market for RENTAL listings here right now (not sales)? A rising rental-DOM trend means longer vacancies and softer asking-rent achievability than the comps imply.
- What's the recent tenant-quality profile in this submarket — average credit score on applications, eviction rate, late-payment / NSF rate, and stable-employment percentage? A property-management company in the area should have these aggregated.
- How much new for-sale + rental construction is in the pipeline within 1–3 miles? Heavy new supply typically softens prices + rents 12–24 months out; constrained supply supports both.
Investment metrics
- 1% rule
- 1.52% ✓
- Cap rate
- 13.47%
- Cash-on-cash
- 25.65%
- DSCR
- 2.14
- GRM
- 5.5
CMA / ARV
No comps found within radius.
Projected returns pro-forma
-3.0% appreciation · 5.18% rent growth · sell at horizon
- IRR
- 21.5%
- Equity multiple
- 1.90×
- Total profit
- $17,686
- Equity at exit
- $10,430
- IRR
- 30.9%
- Equity multiple
- 4.06×
- Total profit
- $59,863
- Equity at exit
- $6,048
Cash invested: $19,586 (down + closing). Projections, not guarantees.
Landlord ↔ Tenant lean methodology
- Overall (STATE)
- 83 Strongly Landlord-Friendly
- State Kansas
- 83 Strongly Landlord-Friendly · R+10
- County
- — inherits STATE
- City
- — inherits STATE
ZIP-level market 67216
- Home prices YoY
- -19.5%
- Rents YoY
- 5.2%
- Active inventory
- 18
- Price-to-rent
- 5.5×
Monthly cashflow live
- Estimated rent
- $1,063 medium interval (Pro) →
- Mortgage (P&I)
- −$367
- Tax from tax record
- −$25 /mo · $304/yr
- Insurance
- −$29
- HOA
- −$0
- Vacancy / Maint / Mgmt
- −$223
- Net cashflow
- $419
Break-even live
UW: 25.0% down · 7.5% · 30yr · 1.5% tax · 5.0% vac · 8.0% maint · 8.0% mgmt
Financing live
Cash to close
- Down payment
- $17,488
- Closing costs
- $2,098
- Reserves months
- —
- Total cash needed
- —
Loan-product check · same deal, 3 products live
Conventional
25% down · 7.5% · 30yr
- Down + closing
- —
- Monthly P&I
- —
- Monthly cashflow
- —
- DSCR
- —
- Eligible?
- —
Personal DTI + credit; lowest rate.
DSCR
20% down · 8.5% · 30yr
- Down + closing
- —
- Monthly P&I
- —
- Monthly cashflow
- —
- DSCR
- —
- Eligible?
- —
No personal income docs; deal must DSCR.
Hard money
10% down · 12.0% · 12mo
- Down + closing
- —
- Monthly P&I
- —
- Monthly cashflow
- —
- DSCR
- —
- Eligible?
- —
Short-term bridge; refi at stabilization.
Listing history 1 events
-
2026-06-17$69,950 Active 1 DOM
ⓘ Source: listings_history table (triggers on properties + properties_extension) + one-shot
backfill from property_details.listing_events for pre-trigger history.
Tax reassessment forecast KS · Resets to sale price
- Current annual tax
- $304 · $25/mo
- Projected year-2 tax
- $986 · $82/mo
- Expected delta
- +$682/yr (+$57/mo · 224.5%)
ⓘ Screening estimate from a state-policy table — verify with the county assessor before closing.
Climate risk First Street
- Flood 3/10 Moderate FEMA zone X (unshaded) · 16% chance over 30 yrs
- Wildfire 3/10 Moderate
- Heat 5/10 Major 7 d/yr ≥106°F today · 18 d/yr by 30 yrs out
- Wind 2/10 Low
- Air quality 2/10 Low 1 unhealthy d/yr today · 1 by 30 yrs out
Nearby sold comps map
Loading sold comps map…
Walkable amenities ~0.75 mi
Loading nearby amenities…
Taxation est. · year 1
- Rental income
- $12,758
- − Mortgage interest
- −$3,918
- − Property taxes
- −$304
- − Insurance
- −$350
- − Repairs & maintenance
- −$1,021
- − Management
- −$1,021
- − Depreciation
- −$2,035
- Taxable income
- $4,110
- Est. tax owed @ 24.0%
- −$986
- After-tax cash flow
- $4,037/yr
For passive investors: Depreciation is non-cash, so a rental often shows a tax loss while cash-flowing — sheltering income. Rental losses are passive: they offset passive income freely, and up to $25,000/yr can offset ordinary (W-2) income if you actively participate and your MAGI is under $100k (phasing out to $0 by $150k); unused losses carry forward. On sale, claimed depreciation is recaptured at up to 25%, and gains may owe capital-gains tax (a 1031 exchange can defer both). Figures are a year-1 estimate at your 24.0% rate — not tax advice; consult a CPA.
Schools (NCES district)
- District
- Derby
- NCES district ID
- 2005460
- Math proficiency
- 29% ▼ -3.00%
- Reading proficiency
- 36% ▲ 1.00%
- Median HH income
- $60,460
- Composite
- 29.25/100
- National rank
- #6564
- State rank
- #66 of 169 in KS
Livability — Oaklawn-Sunview
No livability data for this city. (Only ~50 U.S. cities are tracked.)
Census & demographics
- County
- Sedgwick County · 432,957 people
- Metro
- Wichita, KS
- Population (ZIP)
- 23,254
- Household income
- $48,902
- Rent vs Own
- Severe rent burden
- 980.0
Population outlook (Sedgwick County) Hauer SSP2
- Today (2025)
- 537,014 people
- By 2030
- 546,984 · +1.9%
- By 2040
- 559,141 · +4.1%
- By 2050
- 562,027 · +4.7%
- By 2075
- 557,255 · +3.8%
- By 2100
- 513,383 · -4.4%
Race, ethnicity, and origin ACS 2023
- Neighborhood character
- Diverse neighborhood (Simpson 0.67)
- Race & ethnicity
- White 51% Hispanic / Latino 25% Two or more races 16% Asian 8% Black 5% Native American 1%
- Hispanic origin (detail)
- Mexican 19% Puerto Rican 3%
- Common ancestry
- Romanian 1% Slovak 1% Lithuanian 1%
- Foreign-born
- 12% · Canada, Vietnam
- Languages at home
- 78% English-only · Spanish 16% Other Asian/Pacific 3% Vietnamese 1%
Political lean MEDSL · Sedgwick
- 2024 margin
- R (+13.8) · D 42.3% · R 56.1% · Other 1.6%
- 2008→2024 swing
- -1.1pp toward R · 2008: -12.7pp · 2024: -13.8pp
- All cycles
- 2024: R+13.8 2020: R+12.6 2016: R+19.1 2012: R+19.7 2008: R+12.7
Not yet ingested
- Civics
- —
Market trends
- HPI YoY
- ▼ -53.94%
- Current HPI
- 223.3077
- Rent YoY
- ▲ 5.18%
- Metro
- Wichita, KS
- State GDP YoY
- —
- F500 in state
- 0
Price history
-28.3% since first listed5 events — show timeline
- 2026-06-17 Listed $69,950 SCKMLS as Distributed by MLS Grid
- 2025-10-21 Price Changed $79,900 SCKMLS as Distributed by MLS Grid
- 2025-10-21 Listing Removed — SCKMLS as Distributed by MLS Grid
- 2025-08-21 Price Changed $85,000 SCKMLS as Distributed by MLS Grid
- 2025-06-29 Listed $97,500 SCKMLS as Distributed by MLS Grid
Property tax history
+1.9%/yrLatest (2025): $304 · +3.6% YoY. Source: county tax records.
Cash-flow waterfall
monthlySold comps — $/sqft
last 12 mo · ≤1 miLoading sold comps…