9722 Yosemite St · Detroit, MI
Flood risk 1/10 · Minimal
- FEMA flood zone
- X (unshaded)
- Chance of flooding over 30 yrs
- 0.0%
- Est. flood insurance / yr
- $507 – $1,088
Fire risk 1/10 · Minimal
- Est. fire insurance / yr
- $784 – $1,456
Heat risk 3/10 · Minor
- Hot days now (above 97°F)
- 7 days/yr
- Hot days in 30 yrs
- 15 days/yr
Wind risk 2/10 · Minimal
- Chance of severe wind over 30 yrs
- —
Air-quality risk 4/10 · Minor
- Unhealthy air days now
- 4 days/yr
- Unhealthy air days in 30 yrs
- 6 days/yr
Risk factors via First Street. Map © Google.
Why this score? — see what drove the C- grade
The composite is a weighted blend of 9 inputs, each scored 0–100. Each bar is that input's sub-score; the figure is the points it added to the 100-point composite (weight × sub-score).
- Cash flow +15.0/30.0
- Appreciation +10.0/10.0
- ARV discount +7.5/15.0
- 1% rule +5.0/10.0
- DSCR +5.0/10.0
- Livability +3.7/5.0
- Rent growth +2.5/5.0
- Condition / age +2.5/5.0
- Schools +1.3/10.0
$15,500
🖨 Deal sheet 📄 Offer letter ✓ Due diligence
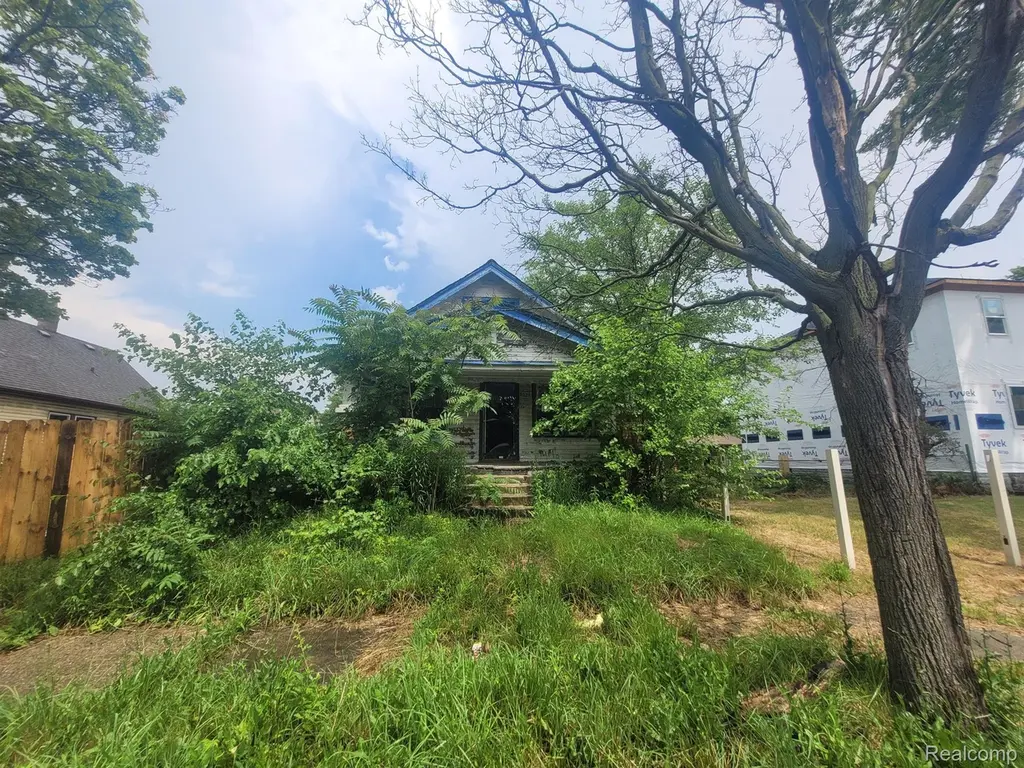
Listing remarks MLS
Attention Investors check out this latest offering from the Detroit Land Bank Authority! Welcome to an incredible investment opportunity in the Nardin Park neighborhood! This one story ranch property boasts 833 square feet of potential. This property presents a unique opportunity for restoration and renovation, allowing you to unleash its full potential. Please note that the DLBA is entitled to a tax capture for the 5 tax years subsequent to transferring ownership of the property. The tax capture may be incompatible with tax abatement that are otherwise available to the selected purchaser. DLBA will review requests to waive its tax capture rights and may require a payment in lieu of taxes to approve such requests. THIS BUNDLE INCLUDES 9722 YOSEMITE AND 9728 YOSEMITE AND MUST BE PURCHASED TOGETHER. TOTAL LISTING PRICE IS $15,500.00
Key facts
- 3,049 sq ft lot
- Built 1921
- Listed 721 days
Neighborhood map
What this means for you Summary
Snapshot
- This is a 3-bed/1.0-bath land listed at $16k.
Deal economics
- At list price, monthly cash flow is $784 ($9k/yr) — positive.
- The deal already cash-flows at list — no discount required.
- Meets the 1% rule at list price ($1k rent vs $16k).
- Recommended offer: $14k (12.0% below list) — sets the bar for market timing.
- Cap rate 67.0% vs local median 10.2% in Detroit — top-decile yield for the area; either an underpriced asset or a hidden risk that comps aren't pricing in. Stress-test before assuming the spread holds.
Location & tenants
- Location reads 73/100 on livability (#218 in MI) — a middle-class / working-renter tenant base. Strengths: amenities A+, commute A+, cost of living A+; Watch: schools F, crime F, employment F.
- Detroit Public Schools Community District (urban): math 10% / reading 24% proficiency, ranked #499 of 540 in MI (top 92%) — low school quality limits family demand, transient renter base, plan for 1-2y turnover; 90% free/reduced lunch — lower-income household profile, screen leases tightly.
- Market conditions: 244 active listings in the ZIP; 33 comparable units currently listed for rent nearby; rentals at typical pace (median 25d on market — plan ~3-4 weeks tenant-placement turnaround); lower-income renter base — watch delinquency; 2,639 units permitted in Wayne County in 2024 (1,216 in 5+ unit buildings).
- This rent runs 39% of the median local income ($34k/yr) — at the standard rent-burdened threshold; future hikes will face affordability resistance.
Forward outlook
- In year one you build about $2k of equity ($107 loan paydown + $2k appreciation (10.0% local appreciation)).
- Wayne County population projected at -17% by 2050 — secular population decline; favor cash flow + early exit over multi-decade hold.
- At projected returns (10.0% appreciation + 3.0% rent growth), your $4k cash investment doubles in ~1 year — after that, you're playing with house money.
Negotiation context
- It's been on market 721 days — a 12% lower offer ($14k) is reasonable based on typical stale-listing flexibility.
- 2 sale attempts since 2y ago with the ask held roughly flat each time — persistent listings suggest the price (not the market) is what's stuck; bring a comps-based counter.
Risks & watch-outs
- Watch-outs: built in 1921 — expect roof / HVAC / electrical / plumbing capex.
Questions for the listing agent
- It's been on market 721 days. Have you received any prior offers? Is the seller open to a 12% concession, seller financing, or rate buy-down credit?
- Built in 1921 — when were the roof, HVAC, electrical panel, plumbing, and water heater last replaced?
- Why hasn't it sold? Are there any deal-killer items the seller is aware of (foundation, flood, title, zoning, code violations)?
- Is there a deadline driving the sale (1031 exchange, divorce, estate, relocation)? That informs how much negotiation room exists.
- Schools are F-rated, which usually means shorter tenancies and higher turnover. Who's the typical renter profile here, and what's been the actual vacancy rate?
- Crime grade is F in this area — have there been break-ins, vandalism, or insurance claims at this property in the last 3 years? What carrier currently insures it and at what premium?
- What's the average days-on-market for RENTAL listings here right now (not sales)? A rising rental-DOM trend means longer vacancies and softer asking-rent achievability than the comps imply.
- What's the recent tenant-quality profile in this submarket — average credit score on applications, eviction rate, late-payment / NSF rate, and stable-employment percentage? A property-management company in the area should have these aggregated.
- How much new for-sale + rental construction is in the pipeline within 1–3 miles? Heavy new supply typically softens prices + rents 12–24 months out; constrained supply supports both.
Investment metrics
- 1% rule
- 7.28% ✓
- Cap rate
- 67.01%
- Cash-on-cash
- 216.86%
- DSCR
- 10.65
- GRM
- 1.1
CMA / ARV
- ARV (median comp)
- $38,446
- List price
- $15,500
- Delta
- -59.68%
- Verdict
- UNDERPRICED
- Comps
- 20 within 1.0 mi
Projected returns pro-forma
10.0% appreciation · 3.0% rent growth · sell at horizon
- IRR
- —
- Equity multiple
- 14.46×
- Total profit
- $58,411
- Equity at exit
- $13,964
- IRR
- —
- Equity multiple
- 31.59×
- Total profit
- $132,762
- Equity at exit
- $30,113
Cash invested: $4,340 (down + closing). Projections, not guarantees.
Landlord ↔ Tenant lean methodology
- Overall (STATE)
- 62 Landlord-Friendly
- State Michigan
- 62 Landlord-Friendly · EVEN
- County
- — inherits STATE
- City
- — inherits STATE
ZIP-level market 48204
- Home prices YoY
- 18.5%
- Active inventory
- 244
- Price-to-rent
- 1.1×
Monthly cashflow live
- Estimated rent
- $1,128 high interval (Pro) →
- Mortgage (P&I)
- −$81
- Tax est. 1.5%
- −$19 /mo · $232/yr
- Insurance
- −$6
- HOA
- −$0
- Vacancy / Maint / Mgmt
- −$237
- Net cashflow
- $784
Break-even live
UW: 25.0% down · 7.5% · 30yr · 1.5% tax · 5.0% vac · 8.0% maint · 8.0% mgmt
Financing live
Cash to close
- Down payment
- $3,875
- Closing costs
- $465
- Reserves months
- —
- Total cash needed
- —
Loan-product check · same deal, 3 products live
Conventional
25% down · 7.5% · 30yr
- Down + closing
- —
- Monthly P&I
- —
- Monthly cashflow
- —
- DSCR
- —
- Eligible?
- —
Personal DTI + credit; lowest rate.
DSCR
20% down · 8.5% · 30yr
- Down + closing
- —
- Monthly P&I
- —
- Monthly cashflow
- —
- DSCR
- —
- Eligible?
- —
No personal income docs; deal must DSCR.
Hard money
10% down · 12.0% · 12mo
- Down + closing
- —
- Monthly P&I
- —
- Monthly cashflow
- —
- DSCR
- —
- Eligible?
- —
Short-term bridge; refi at stabilization.
Rent comps 33 comps
| Address | Beds | Baths | Sqft | Rent | $/sqft | DOM | Units | Dist |
|---|---|---|---|---|---|---|---|---|
| 9789 Chenlot St Unit 1 Detroit, MI | 2.0 | 1.0 | 1000 | $1,000 | $1.00 | 5d | 1 | 0.21mi |
| 9376 Otsego St Detroit, MI | 3.0 | 1.0 | 873 | $1,396 | $1.60 | 44d | 1 | 0.34mi |
| 9917 Woodside St Apt 1 Detroit, MI | 2.0 | 1.0 | 800 | $800 | $1.00 | 44d | 1 | 0.36mi |
| 3759 Atkinson St Unit 2 Detroit, MI | 2.0 | 1.0 | 919 | $1,200 | $1.31 | 24d | 1 | 0.61mi |
| 12019 Stoepel St Detroit, MI | 2.0 | 1.0 | 1000 | $943 | $0.94 | 5d | 1 | 0.66mi |
| 12032 Santa Rosa Dr Unit 1 Detroit, MI | 3.0 | 1.0 | 900 | $1,423 | $1.58 | 5d | 1 | 0.69mi |
| 3295 Rochester St Unit 2 Detroit, MI | 2.0 | 1.0 | 800 | $1,000 | $1.25 | 4d | 1 | 0.72mi |
| 3295 Rochester St Unit 2 Detroit, MI | 2.0 | 1.0 | 782 | $850 | $1.09 | 44d | 1 | 0.72mi |
| 8762 Epworth St Unit 8768 Detroit, MI | 2.0 | 1.0 | 900 | $1,000 | $1.11 | 24d | 1 | 0.72mi |
| 4268 Cortland St Unit 1 Detroit, MI | 2.0 | 1.0 | 1000 | $1,050 | $1.05 | 44d | 1 | 0.81mi |
| 3226 Calvert Ave Detroit, MI | 3.0 | 1.0 | 1100 | $1,200 | $1.09 | 13d | 1 | 0.81mi |
| 3242 Clairmount St Detroit, MI | 2.0 | 1.0 | 530 | $1,300 | $2.45 | 44d | 1 | 0.83mi |
| 12415 Monica St Detroit, MI | 2.0 | 1.0 | 1000 | $1,200 | $1.20 | 44d | 1 | 0.96mi |
| 12663 Stoepel St Detroit, MI | 2.0 | 1.0 | 1100 | $1,050 | $0.95 | 22d | 1 | 0.97mi |
| 12663 Stoepel St Unit 1 Detroit, MI | 2.0 | 1.0 | 750 | $975 | $1.30 | 18d | 1 | 0.97mi |
| 5101 Oregon St Detroit, MI | 2.0 | 1.0 | 1000 | $1,049 | $1.05 | 44d | 1 | 1.01mi |
| 4203 Tyler St Detroit, MI | 2.0 | 1.0 | 950 | $895 | $0.94 | 44d | 1 | 1.15mi |
| 5398 Allendale St Detroit, MI | 2.0 | 1.0 | 1100 | $1,200 | $1.09 | 24d | 1 | 1.15mi |
| 3783 Tyler St Unit Lower Detroit, MI | 3.0 | 1.0 | 1000 | $1,150 | $1.15 | 44d | 1 | 1.22mi |
| 9022 Northlawn St Detroit, MI | 2.0 | 1.0 | 1100 | $1,300 | $1.18 | 24d | 1 | 1.22mi |
| 3824 Tyler St Apt 1 Detroit, MI | 3.0 | 1.0 | 900 | $1,523 | $1.69 | 17d | 1 | 1.23mi |
| 8353 Alpine St Detroit, MI | 2.0 | 1.0 | 1000 | $1,050 | $1.05 | 44d | 1 | 1.27mi |
| 2638 Richton St Unit 2638 Richton Upper Detroit, MI | 2.0 | 1.0 | 1000 | $900 | $0.90 | 44d | 1 | 1.29mi |
| 2676 Sturtevant St Unit 1 Detroit, MI | 2.0 | 1.0 | 1000 | $1,000 | $1.00 | 24d | 1 | 1.33mi |
| 8544 Cloverlawn St Detroit, MI | 2.0 | 1.0 | 800 | $800 | $1.00 | 17d | 1 | 1.33mi |
| 4045 Clements St Detroit, MI | 3.0 | 1.0 | 850 | $1,150 | $1.35 | 24d | 1 | 1.33mi |
| 4045 Clements St Detroit, MI | 3.0 | 1.0 | 850 | $1,150 | $1.35 | 44d | 1 | 1.33mi |
| 2531 Pingree St Unit 2 (FL 2) Detroit, MI | 3.0 | 1.0 | 893 | $1,100 | $1.23 | 2d | 1 | 1.34mi |
| 9353 Kentucky St Detroit, MI | 2.0 | 1.0 | 800 | $999 | $1.25 | 17d | 1 | 1.39mi |
| 2926 Ewald Cir Detroit, MI | 2.0 | 1.0 | 800 | $900 | $1.12 | 17d | 1 | 1.44mi |
| 3812 W Grand St Detroit, MI | 2.0 | 1.0 | 1100 | $1,025 | $0.93 | 17d | 1 | 1.45mi |
| 13620 Tuller St Detroit, MI | 4.0 | 1.0 | 1064 | $1,374 | $1.29 | 13d | 1 | 1.47mi |
| 5440 Milford St Unit 1 Detroit, MI | 2.0 | 1.0 | 850 | $1,150 | $1.35 | 44d | 1 | 1.49mi |
Listing history 14 events
-
2026-06-18days on market $15,500 Active 721 DOM
-
2026-06-17days on market $15,500 Active 720 DOM
-
2026-06-15days on market $15,500 Active 718 DOM
-
2026-06-13days on market $15,500 Active 716 DOM
-
2026-06-13days on market $15,500 Active 715 DOM
-
2026-06-09days on market $15,500 Active 712 DOM
-
2026-06-08days on market $15,500 Active 711 DOM
-
2026-06-07days on market $15,500 Active 710 DOM
-
2026-06-04days on market $15,500 Active 707 DOM
-
2026-06-03days on market $15,500 Active 706 DOM
-
2026-06-01days on market $15,500 Active 704 DOM
-
2026-05-31days on market $15,500 Active 703 DOM
-
2024-06-27$15,500 Active 842-char remark
Show marketing remark (842 chars)
Attention Investors check out this latest offering from the Detroit Land Bank Authority! Welcome to an incredible investment opportunity in the Nardin Park neighborhood! This one story ranch property boasts 833 square feet of potential. This property presents a unique opportunity for restoration and renovation, allowing you to unleash its full potential. Please note that the DLBA is entitled to a tax capture for the 5 tax years subsequent to transferring ownership of the property. The tax capture may be incompatible with tax abatement that are otherwise available to the selected purchaser. DLBA will review requests to waive its tax capture rights and may require a payment in lieu of taxes to approve such requests. THIS BUNDLE INCLUDES 9722 YOSEMITE AND 9728 YOSEMITE AND MUST BE PURCHASED TOGETHER. TOTAL LISTING PRICE IS $15,500.00
ⓘ Source: listings_history table (triggers on properties + properties_extension) + one-shot
backfill from property_details.listing_events for pre-trigger history.
Climate risk First Street
- Flood 1/10 Low FEMA zone X (unshaded) · 0% chance over 30 yrs
- Wildfire 1/10 Low
- Heat 3/10 Moderate 7 d/yr ≥97°F today · 15 d/yr by 30 yrs out
- Wind 2/10 Low
- Air quality 4/10 Moderate 4 unhealthy d/yr today · 6 by 30 yrs out
Nearby sold comps map
Loading sold comps map…
Walkable amenities ~0.75 mi
Loading nearby amenities…
Taxation est. · year 1
- Rental income
- $13,540
- − Mortgage interest
- −$868
- − Property taxes
- −$232
- − Insurance
- −$78
- − Repairs & maintenance
- −$1,083
- − Management
- −$1,083
- − Depreciation
- −$451
- Taxable income
- $9,745
- Est. tax owed @ 24.0%
- −$2,339
- After-tax cash flow
- $7,073/yr
For passive investors: Depreciation is non-cash, so a rental often shows a tax loss while cash-flowing — sheltering income. Rental losses are passive: they offset passive income freely, and up to $25,000/yr can offset ordinary (W-2) income if you actively participate and your MAGI is under $100k (phasing out to $0 by $150k); unused losses carry forward. On sale, claimed depreciation is recaptured at up to 25%, and gains may owe capital-gains tax (a 1031 exchange can defer both). Figures are a year-1 estimate at your 24.0% rate — not tax advice; consult a CPA.
Schools (NCES district)
- District
- Detroit Public Schools Community District
- NCES district ID
- 2601103
- Math proficiency
- 10% ▼ -2.00%
- Reading proficiency
- 24% ▲ 6.00%
- Median HH income
- $25,815
- Composite
- 13.06/100
- National rank
- #9564
- State rank
- #499 of 540 in MI
Livability — Detroit
- Score
- 73/100
- State rank
- #218
- US rank
- #5427
Category grades
Schools grade is shown separately in the Schools card above.
Census & demographics
- Census place
- Detroit, MI
- County
- Wayne County · 1,562,939 people
- City population
- 572,865
- Metro
- Detroit-Warren-Dearborn, MI
- Population (ZIP)
- 20,696
- Household income
- $34,468
- Rent vs Own
- Severe rent burden
- 1418.0
Population outlook (Wayne County) Hauer SSP2
- Today (2025)
- 1,675,273 people
- By 2030
- 1,620,300 · -3.3%
- By 2040
- 1,502,341 · -10.3%
- By 2050
- 1,384,039 · -17.4%
- By 2075
- 1,124,592 · -32.9%
- By 2100
- 881,193 · -47.4%
Race, ethnicity, and origin ACS 2023
- Neighborhood character
- Predominantly Black (86%)
- Race & ethnicity
- Black 86% Two or more races 7% Hispanic / Latino 5% White 4% Native American 2%
- Hispanic origin (detail)
- Mexican 4%
- Common ancestry
- Hispanic 1% Romanian 1%
- Foreign-born
- 2% · Canada
- Languages at home
- 95% English-only · Spanish 4%
Political lean MEDSL · Wayne
- 2024 margin
- Strong D (+29.0) · D 62.7% · R 33.7% · Other 3.6%
- 2008→2024 swing
- -20.5pp toward R · 2008: 49.5pp · 2024: 29.0pp
- All cycles
- 2024: D+29.0 2020: D+38.1 2016: D+37.3 2012: D+46.9 2008: D+49.5
Not yet ingested
- Civics
- —
Market trends
- HPI YoY
- ▲ 36.51%
- Current HPI
- 234.0465
- Rent YoY
- —
- Metro
- Detroit-Warren-Dearborn, MI
- State GDP YoY
- ▲ 1.37%
- F500 in state
- 28
Industry mix (Fortune 500 HQ in MI)
| Industry | F500 HQs | Revenue |
|---|---|---|
| Automotive Parts | 3 | $48B |
|
||
| Automotive | 2 | $372B |
|
||
| Chemicals | 1 | $45B |
|
||
| Automotive Retail | 1 | $29B |
|
||
| Healthcare / Medical Devices | 1 | $23B |
|
||
| Automotive Technology | 1 | $20B |
|
||
Price history
+0.0% since first listed2 events — show timeline
- 2024-06-27 Listed $15,500 MiRealSource-MiMLS
- 2024-06-27 Listed $15,500 REALCOMP
Property tax history
-35.0%/yrLatest (2015): $6 · -57.1% YoY. Source: county tax records.
Cash-flow waterfall
monthlySold comps — $/sqft
last 12 mo · ≤1 miLoading sold comps…