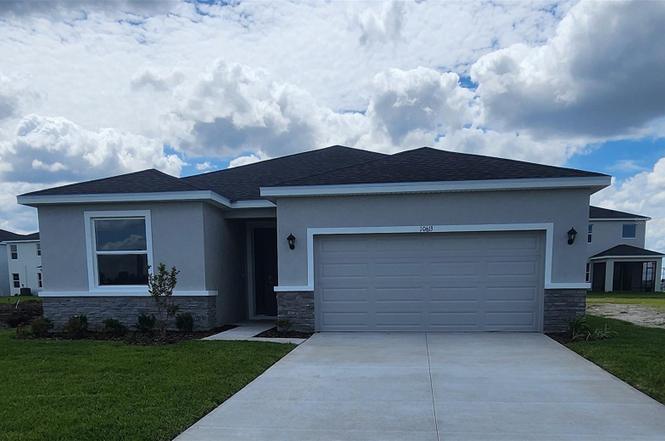
10613 Fern Hollow Run · Ruskin, FL
Flood risk No data
- FEMA flood zone
- —
- Chance of flooding over 30 yrs
- —
- Est. flood insurance / yr
- —
Fire risk No data
- Est. fire insurance / yr
- —
Heat risk No data
- Hot days now (above threshold)
- —
- Hot days in 30 yrs
- —
Wind risk No data
- Chance of severe wind over 30 yrs
- —
Air-quality risk No data
- Unhealthy air days now
- —
- Unhealthy air days in 30 yrs
- —
Risk factors via First Street. Map © Google.
Why this score? — see what drove the F grade
The composite is a weighted blend of 9 inputs, each scored 0–100. Each bar is that input's sub-score; the figure is the points it added to the 100-point composite (weight × sub-score).
- Cash flow +7.9/30.0
- ARV discount +7.5/15.0
- Schools +4.4/10.0
- Livability +3.6/5.0
- 1% rule +3.2/10.0
- Condition / age +2.5/5.0
- Rent growth +2.3/5.0
- DSCR +2.0/10.0
- Appreciation +0.0/10.0
$369,000
🖨 Deal sheet (PDF) 📄 Offer letter ✓ Due diligence
Listing remarks
MOVE IN READY! Receive up to $15,000 towards closing costs and special interest rates with the use of our preferred lender + $5,000 towards upgrades - Now through Sunday, May 31st. Self-guided tour available on this quick move-in home every day from 7am-9pm. Stop by to tour on your own time. Our Newest Community is Set within Southwest Florida's natural beauty and close to many popular area attractions, just 3 miles from I-75. Oakfield Trails neighborhood will consist of single-family homes all designed to meet the needs of today’s modern family. All of our homes feature all-concrete block construction on the first and second floors and D. R. Horton’s state-of-the-art Smart Home
Key facts
- Natural playgrounds
- Pickleball courts
- Tennis courts
Tags
Property features AI
Finance
- Other: Home warranty included; Builder information available (D.R. Horton, license CBC1259187); Living area reported as 2,045 sq ft (builder source); total building area 2,755 sq ft
- Financial info: Other annual assessment amount listed; Lease restrictions apply
- HOA & community: Has HOA (Legacy Preserve Homeowner’s Association); Monthly HOA fee of $223 (required; association approval required); Community pool and clubhouse; Playground; Pets allowed
Exterior
- Parking: Attached 2-car garage with garage door opener
- Security: Smoke detector(s)
- Utilities: Public water; Public sewer; Cable available; Electricity connected; Sprinkler well; Underground utilities
- Home design: Single family residence; One story; Northwest facing; Completed new construction (projected completion April 17, 2026)
- Construction: Block and stucco construction; Shingle roof; Slab foundation; Built by D.R. Horton (model: Lantana); New construction
- Exterior features: Sliding doors; Level, paved lot; Irrigation equipment; Paved road access
Interior
- Kitchen: Dishwasher; Microwave; Range; Stone counters
- Bedrooms: 4 bedrooms
- Flooring: Carpet
- Bathrooms: 2 full baths; 1 half bath
- Heating & cooling: Central heating; Heat pump; Central air
- Interior features: Open floorplan; Stone counters; Walk-in closets; Smoke detectors
- Laundry & utility: Dedicated laundry room
Neighborhood map
What this means for you Summary
Snapshot
- This is a 4-bed/2.5-bath land listed at $369k.
Deal economics
- At list price, monthly cash flow is $-386 ($-5k/yr) — negative.
- To cash-flow at today's rent, offer at most $313k (15.1% below list).
- To meet the 1% rule (rent ≥ 1% of price), the offer needs to be $302k (18.1% below list).
- Recommended offer: $302k (18.1% below list) — sets the bar for 1% rule.
Location & tenants
- Location reads 71/100 on livability (#392 in FL) — a middle-class / working-renter tenant base. Strengths: cost of living A+, housing A+, commute B+; Watch: amenities F, health & safety F.
- Manatee (suburban): math 54% / reading 50% proficiency, ranked #26 of 73 in FL (top 36%) — acceptable for families but not a draw, mixed tenant base, ~2y average lease.
- Zoned schools: Virgil Mills Elementary School (math 69% / reading 65%, grade B+, #450 of 2,144 statewide, top 22%, 818 students, 43% FRL); Buffalo Creek Middle School (math 59% / reading 51%, grade B-, #180 of 571 statewide, top 32%, 1,127 students, 44% FRL); Parrish Community High School (math 47% / reading 57%, grade D+, #160 of 667 statewide, top 25%, 2,017 students, 32% FRL).
- Market conditions: Rents soft (-0.9%/yr); 2194 active listings in the ZIP; 19 comparable units currently listed for rent nearby; rentals at typical pace (median 18d on market — plan ~3-4 weeks tenant-placement turnaround); high-income renter base; 7,472 units permitted in Manatee County in 2024 (1,782 in 5+ unit buildings).
- This rent runs 32% of the median local income ($114k/yr) — at the standard rent-burdened threshold; future hikes will face affordability resistance.
Forward outlook
- Local home prices are declining (-3.0%/yr); year-one equity from $3k of loan paydown is wiped out by about $11k of value loss. Plan a longer hold.
- Manatee County population projected at +43% by 2050 — long-run rental-demand tailwind backs the buy-and-hold thesis.
Negotiation context
- It's been on market 150 days — a 12% lower offer ($325k) is reasonable based on typical stale-listing flexibility.
Questions for the listing agent
- What do current leases actually rent for vs. the listed asking? Can we see a recent rent roll and the last 12 months of T-12 income?
- It's been on market 150 days. Have you received any prior offers? Is the seller open to a 18% concession, seller financing, or rate buy-down credit?
- What does the HOA fee cover, when was the last increase, and are there any pending special assessments or reserve-fund shortfalls?
- Why hasn't it sold? Are there any deal-killer items the seller is aware of (foundation, flood, title, zoning, code violations)?
- Is there a deadline driving the sale (1031 exchange, divorce, estate, relocation)? That informs how much negotiation room exists.
- Schools are F-rated, which usually means shorter tenancies and higher turnover. Who's the typical renter profile here, and what's been the actual vacancy rate?
- The area grade is low — what's the realistic commute time and amenity access for the typical tenant pool here? Any planned neighborhood developments (good or bad) we should know about?
- What's the average days-on-market for RENTAL listings here right now (not sales)? A rising rental-DOM trend means longer vacancies and softer asking-rent achievability than the comps imply.
- What's the recent tenant-quality profile in this submarket — average credit score on applications, eviction rate, late-payment / NSF rate, and stable-employment percentage? A property-management company in the area should have these aggregated.
- How much new for-sale + rental construction is in the pipeline within 1–3 miles? Heavy new supply typically softens prices + rents 12–24 months out; constrained supply supports both.
Investment metrics
- 1% rule
- 0.82% ✗
- Cap rate
- 5.04%
- Cash-on-cash
- -4.48%
- DSCR
- 0.80
- GRM
- 10.2
CMA / ARV
No comps found within radius.
Projected returns pro-forma
-3.0% appreciation · 0.0% rent growth · sell at horizon
- IRR
- -27.6%
- Equity multiple
- 0.10×
- Total profit
- $-93,041
- Equity at exit
- $55,019
- IRR
- -44.2%
- Equity multiple
- -0.41×
- Total profit
- $-146,143
- Equity at exit
- $31,904
Cash invested: $103,320 (down + closing). Projections, not guarantees.
Landlord ↔ Tenant lean methodology
- Overall (STATE)
- 87 Strongly Landlord-Friendly
- State Florida
- 87 Strongly Landlord-Friendly · R+3
- County
- — inherits STATE
- City
- — inherits STATE
ZIP-level market 34219
- Home prices YoY
- -23.7%
- Rents YoY
- -0.9%
- Active inventory
- 2194
- Price-to-rent
- 10.2×
Monthly cashflow live
- Estimated rent
- $3,022 high interval (Pro) →
- Mortgage (P&I)
- −$1,935
- Tax est. 1.5%
- −$461 /mo · $5,535/yr
- Insurance
- −$154
- HOA
- −$223
- Vacancy / Maint / Mgmt
- −$635
- Net cashflow
- $-386
Break-even live
Sensitivity live
| Price | -10% $-131 | -5% $-258 | +0% $-386 | +5% $-513 | +10% $-641 |
|---|---|---|---|---|---|
| Rent | -10% $-625 | -5% $-505 | +0% $-386 | +5% $-266 | +10% $-147 |
| Rate | -1.0pp $-200 | -0.5pp $-292 | base $-386 | +0.5pp $-481 | +1.0pp $-579 |
UW: 25.0% down · 7.5% · 30yr · 1.5% tax · 5.0% vac · 8.0% maint · 8.0% mgmt
Financing live
Cash to close
- Down payment
- $92,250
- Closing costs
- $11,070
- Reserves months
- —
- Total cash needed
- —
Loan-product check · same deal, 3 products live
Conventional
25% down · 7.5% · 30yr
- Down + closing
- —
- Monthly P&I
- —
- Monthly cashflow
- —
- DSCR
- —
- Eligible?
- —
Personal DTI + credit; lowest rate.
DSCR
20% down · 8.5% · 30yr
- Down + closing
- —
- Monthly P&I
- —
- Monthly cashflow
- —
- DSCR
- —
- Eligible?
- —
No personal income docs; deal must DSCR.
Hard money
10% down · 12.0% · 12mo
- Down + closing
- —
- Monthly P&I
- —
- Monthly cashflow
- —
- DSCR
- —
- Eligible?
- —
Short-term bridge; refi at stabilization.
Rent comps 19 comps
| Address | Beds | Baths | Sqft | Rent | $/sqft | DOM | Units | Dist |
|---|---|---|---|---|---|---|---|---|
| 10455 Wet Marsh Cv Parrish, FL | 3.0 | 2.0 | 1635 | $2,650 | $1.62 | 12d | 1 | 0.57mi |
| 9544 Sandy Bluffs Cir Parrish, FL | 5.0 | 3.0 | 2557 | $2,950 | $1.15 | 5d | 1 | 0.73mi |
| 9962 Last Light Gln Parrish, FL | 4.0 | 2.0 | 1740 | $2,495 | $1.43 | 5d | 1 | 0.94mi |
| 11454 Gallatin Trl Parrish, FL | 4.0 | 2.0 | 1635 | $2,575 | $1.57 | 17d | 1 | 0.97mi |
| 10416 High Noon Trl Parrish, FL | 3.0 | 2.0 | 1412 | $2,400 | $1.70 | 5d | 1 | 0.99mi |
| 11512 Gallatin Trl Parrish, FL | 4.0 | 2.5 | 1929 | $3,300 | $1.71 | 25d | 1 | 1.00mi |
| 10749 Hidden Banks Gln Parrish, FL | 5.0 | 3.0 | 2447 | $2,549 | $1.04 | 25d | 1 | 1.12mi |
| 11880 Little River Way Parrish, FL | 4.0 | 2.0 | 1635 | $2,650 | $1.62 | 25d | 1 | 1.15mi |
| 11884 Little River Way Parrish, FL | 3.0 | 2.5 | 2142 | $3,250 | $1.52 | 17d | 1 | 1.15mi |
| 10225 Daybreak Gln Parrish, FL | 4.0 | 3.0 | 1978 | $2,600 | $1.31 | 5d | 1 | 1.16mi |
| 10646 Hidden Banks Gln Parrish, FL | 3.0 | 2.0 | 1504 | $2,350 | $1.56 | 17d | 1 | 1.17mi |
| 9009 Moccasin Wallow Rd Parrish, FL | 3.0–4.0 | 2.5 | 1581 | $2,304 | $1.46 | 3d | 32 | 1.19mi |
| 10935 Gentle Current Way Parrish, FL | 5.0 | 3.0 | 2605 | $3,900 | $1.50 | 25d | 1 | 1.22mi |
| 8614 Mercator Ct Parrish, FL | 4.0 | 2.5 | 2910 | $3,300 | $1.13 | 25d | 1 | 1.41mi |
| 11230 82nd St E Parrish, FL | 3.0 | 2.0 | 1758 | $2,495 | $1.42 | 17d | 1 | 1.42mi |
| 9928 Wimico Ter Parrish, FL | 3.0 | 2.0 | 1504 | $2,450 | $1.63 | 17d | 1 | 1.47mi |
| 11567 84th Street Cir E #105 Parrish, FL | 3.0 | 2.5 | 1420 | $1,999 | $1.41 | 5d | 1 | 1.47mi |
| 11628 Moonsail Dr Parrish, FL | 3.0 | 2.0 | 2144 | $3,500 | $1.63 | 23d | 1 | 1.48mi |
| 8541 Bella Mar Trl Parrish, FL | 5.0 | 3.0 | 2389 | $2,800 | $1.17 | 12d | 1 | 1.49mi |
HOA detail
- Monthly dues
- $223 · $2,676/yr
Listing history 19 events
-
2026-05-21status Pending
-
2026-05-20price $369,000
-
2026-05-19price $372,000
-
2026-05-13price $369,000
-
2026-05-06price $372,000
-
2026-04-30price $374,000
-
2026-04-22price $377,000
-
2026-04-15price $379,000
-
2026-04-09price $384,000
-
2026-04-03price $389,000
-
2026-03-25price $392,000
-
2026-03-18price $394,000
-
2026-03-12price $397,000
-
2026-03-05price $399,000
-
2026-02-26price $404,000
-
2026-01-28price $407,000
-
2026-01-26price $409,990
-
2026-01-20price $399,000
-
2025-12-22$409,990 Active
ⓘ Source: listings_history table (triggers on properties + properties_extension) + one-shot
backfill from property_details.listing_events for pre-trigger history.
Nearby sold comps map
Loading sold comps map…
Walkable amenities ~0.75 mi
Loading nearby amenities…
Taxation est. · year 1
- Rental income
- $36,262
- − Mortgage interest
- −$20,670
- − Property taxes
- −$5,535
- − Insurance
- −$1,845
- − Repairs & maintenance
- −$2,901
- − Management
- −$2,901
- − HOA
- −$2,676
- − Depreciation
- −$10,735
- Taxable loss
- −$11,000
- Est. tax savings @ 24.0%
- +$2,640
- After-tax cash flow
- $-1,990/yr
For passive investors: Depreciation is non-cash, so a rental often shows a tax loss while cash-flowing — sheltering income. Rental losses are passive: they offset passive income freely, and up to $25,000/yr can offset ordinary (W-2) income if you actively participate and your MAGI is under $100k (phasing out to $0 by $150k); unused losses carry forward. On sale, claimed depreciation is recaptured at up to 25%, and gains may owe capital-gains tax (a 1031 exchange can defer both). Figures are a year-1 estimate at your 24.0% rate — not tax advice; consult a CPA.
Schools (NCES district)
- District
- Manatee
- NCES district ID
- 1201230
- Math proficiency
- 54% ▼ -6.00%
- Reading proficiency
- 50% ▼ -2.00%
- Median HH income
- $49,607
- Composite
- 44.43/100
- National rank
- #2806
- State rank
- #26 of 73 in FL
Livability — Ruskin
- Score
- 71/100
- State rank
- #392
- US rank
- #6879
Category grades
Schools grade is shown separately in the Schools card above.
Census & demographics
- County
- Manatee County · 416,364 people
- City population
- 33,319
- Metro
- North Port-Sarasota-Bradenton, FL
- Population (ZIP)
- 33,296
- Household income
- $113,773
- Rent vs Own
- Severe rent burden
- 219.0
Population outlook (Manatee County) Hauer SSP2
- Today (2025)
- 447,342 people
- By 2030
- 488,911 · +9.3%
- By 2040
- 567,934 · +27.0%
- By 2050
- 637,995 · +42.6%
- By 2075
- 781,970 · +74.8%
- By 2100
- 848,272 · +89.6%
Race, ethnicity, and origin ACS 2023
- Neighborhood character
- Predominantly White (75%)
- Race & ethnicity
- White 75% Hispanic / Latino 11% Two or more races 8% Black 8% Asian 2%
- Hispanic origin (detail)
- Mexican 2% Puerto Rican 3%
- Common ancestry
- Romanian 4% Hispanic 2% Russian 2%
- Foreign-born
- 10% · Canada, Dominican Republic, Jamaica
- Languages at home
- 88% English-only · Spanish 7% French/Haitian/Cajun 2% Other Asian/Pacific 1%
Political lean MEDSL · Manatee
- 2024 margin
- Strong R (+23.5) · D 37.9% · R 61.4%
- 2008→2024 swing
- -16.5pp toward R · 2008: -7.0pp · 2024: -23.5pp
- All cycles
- 2024: R+23.5 2020: R+16.1 2016: R+17.1 2012: R+12.5 2008: R+7.0
Not yet ingested
- Civics
- —
Market trends
- HPI YoY
- ▼ -84.45%
- Current HPI
- 271.7131
- Rent YoY
- ▼ -0.95%
- Metro
- North Port-Sarasota-Bradenton, FL
- State GDP YoY
- ▲ 3.28%
- F500 in state
- 36
Industry mix (Fortune 500 HQ in FL)
| Industry | F500 HQs | Revenue |
|---|---|---|
| Industrial Technology | 2 | $29B |
|
||
| Insurance | 2 | $17B |
|
||
| Retail | 1 | $60B |
|
||
| Technology Distribution | 1 | $58B |
|
||
| Homebuilding | 1 | $35B |
|
||
| Technology Manufacturing | 1 | $35B |
|
||
Price history
-10.0% since first listed19 events — show timeline
- 2026-05-21 Pending — Stellar MLS as Distributed by MLS Grid
- 2026-05-20 Price Changed $369,000 Stellar MLS as Distributed by MLS Grid
- 2026-05-19 Price Changed $372,000 Stellar MLS as Distributed by MLS Grid
- 2026-05-13 Price Changed $369,000 Stellar MLS as Distributed by MLS Grid
- 2026-05-06 Price Changed $372,000 Stellar MLS as Distributed by MLS Grid
- 2026-04-30 Price Changed $374,000 Stellar MLS as Distributed by MLS Grid
- 2026-04-22 Price Changed $377,000 Stellar MLS as Distributed by MLS Grid
- 2026-04-15 Price Changed $379,000 Stellar MLS as Distributed by MLS Grid
- 2026-04-09 Price Changed $384,000 Stellar MLS as Distributed by MLS Grid
- 2026-04-03 Price Changed $389,000 Stellar MLS as Distributed by MLS Grid
- 2026-03-25 Price Changed $392,000 Stellar MLS as Distributed by MLS Grid
- 2026-03-18 Price Changed $394,000 Stellar MLS as Distributed by MLS Grid
- 2026-03-12 Price Changed $397,000 Stellar MLS as Distributed by MLS Grid
- 2026-03-05 Price Changed $399,000 Stellar MLS as Distributed by MLS Grid
- 2026-02-26 Price Changed $404,000 Stellar MLS as Distributed by MLS Grid
- 2026-01-28 Price Changed $407,000 Stellar MLS as Distributed by MLS Grid
- 2026-01-26 Price Changed $409,990 Stellar MLS as Distributed by MLS Grid
- 2026-01-20 Price Changed $399,000 Stellar MLS as Distributed by MLS Grid
- 2025-12-22 Listed $409,990 Stellar MLS as Distributed by MLS Grid
Cash-flow waterfall
monthlySold comps — $/sqft
last 12 mo · ≤1 miLoading sold comps…