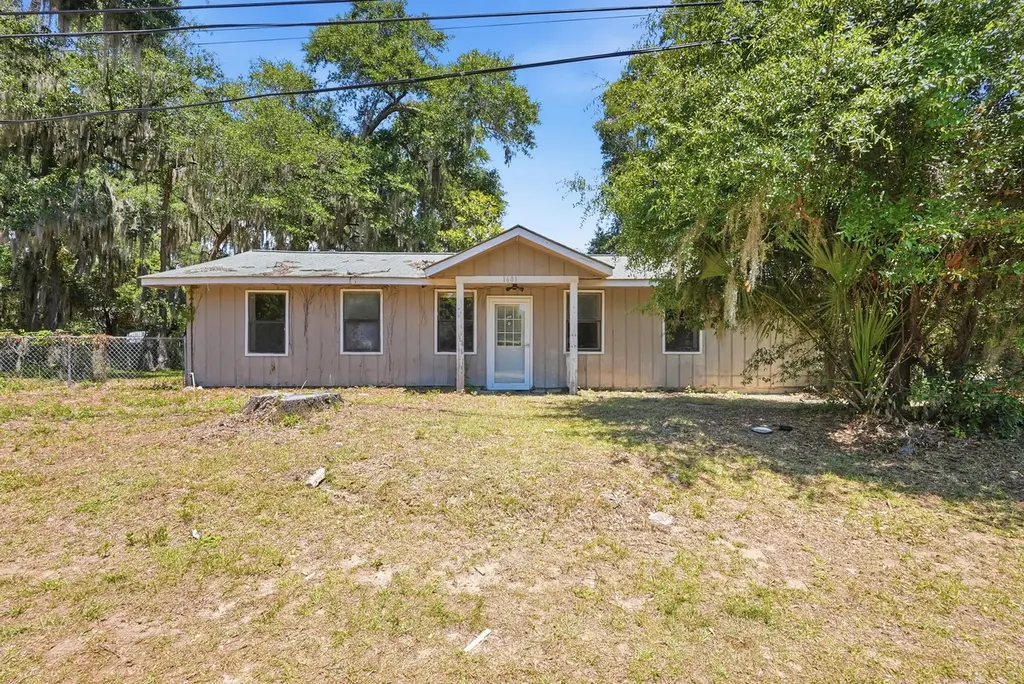
1601 Palmetto St · Beaufort, SC
Flood risk 1/10 · Minimal
- FEMA flood zone
- X (unshaded)
- Chance of flooding over 30 yrs
- 0.0%
- Est. flood insurance / yr
- $507 – $1,088
Fire risk 1/10 · Minimal
- Est. fire insurance / yr
- $783 – $1,453
Heat risk 10/10 · Severe
- Hot days now (above 107°F)
- 7 days/yr
- Hot days in 30 yrs
- 18 days/yr
Wind risk 9/10 · Severe
- Chance of severe wind over 30 yrs
- 99.0%
Air-quality risk 3/10 · Minor
- Unhealthy air days now
- 3 days/yr
- Unhealthy air days in 30 yrs
- 3 days/yr
Risk factors via First Street. Map © Google.
Why this score? — see what drove the D+ grade
The composite is a weighted blend of 9 inputs, each scored 0–100. Each bar is that input's sub-score; the figure is the points it added to the 100-point composite (weight × sub-score).
- ARV discount +15.0/15.0
- Cash flow +14.0/30.0
- DSCR +4.2/10.0
- Schools +4.1/10.0
- Livability +3.5/5.0
- 1% rule +3.1/10.0
- Condition / age +2.5/5.0
- Rent growth +2.0/5.0
- Appreciation +0.0/10.0
$275,000
🖨 Deal sheet 📄 Offer letter ✓ Due diligence
Listing remarks
Nestled in the highly sought-after Pigeon Point neighborhood of Beaufort, this one-story home offers an exceptional opportunity to create your dream Lowcountry retreat. Whether you are searching for a second home, investment property, or your next renovation project, this home is full of potential. Requiring a complete renovation, it provides the perfect blank canvas for a DIY enthusiast, investor, or visionary buyer ready to bring new life to a classic property. Ideally located just minutes from downtown Beaufort, local shopping, dining, and the scenic waterfront, this property combines convenience with the charm of one of Beaufort's most desirable historic communities.
Key facts
- 8,712 sq ft lot
- Built 1983
- Listed 5 days
Property features AI
Exterior
- Utilities: Public sewer
- Home design: Single-family detached home; Residential property; Entry at ground level; One level
- Construction: Fee simple ownership
- Exterior features: Lot under 0.5 acre; No other structures on the property
Interior
- Bedrooms: 3 bedrooms
- Bathrooms: 1 bathroom
- Interior features: Ground-level entry; One-story layout
Neighborhood map
What this means for you Summary
Snapshot
- This is a 3-bed/1.0-bath single-family listed at $275k.
Deal economics
- At list price, monthly cash flow is $35 ($422/yr) — positive.
- The deal already cash-flows at list — no discount required.
- To meet the 1% rule (rent ≥ 1% of price), the offer needs to be $224k (18.7% below list).
- Recommended offer: $224k (18.7% below list) — sets the bar for 1% rule.
- Cap rate 6.4% vs local median 2.5% in Beaufort — top-decile yield for the area; either an underpriced asset or a hidden risk that comps aren't pricing in. Stress-test before assuming the spread holds.
Location & tenants
- Location reads 69/100 on livability (#76 in SC) — a middle-class / working-renter tenant base. Strengths: health & safety A+, amenities A, housing A; Watch: crime F, commute F.
- Beaufort 01 (town): math 42% / reading 51% proficiency, ranked #17 of 80 in SC (top 21%) — families likely to look elsewhere, expect single-tenant / working-renter base with shorter leases.
- Market conditions: Rents soft (-1.9%/yr); 259 active listings in the ZIP; 6 comparable units currently listed for rent nearby; rentals at typical pace (median 21d on market — plan ~3-4 weeks tenant-placement turnaround); 1,824 units permitted in Beaufort County in 2024 (618 in 5+ unit buildings).
- This rent runs 38% of the median local income ($70k/yr) — at the standard rent-burdened threshold; future hikes will face affordability resistance.
Forward outlook
- Local home prices are declining (-3.0%/yr); year-one equity from $2k of loan paydown is wiped out by about $8k of value loss. Plan a longer hold.
- Beaufort County population projected at +30% by 2050 — long-run rental-demand tailwind backs the buy-and-hold thesis.
Negotiation context
- Only 5 days on market — expect competitive offers; lowballing is unlikely to land.
- 3 sale attempts since 9y ago with the ask held roughly flat each time — persistent listings suggest the price (not the market) is what's stuck; bring a comps-based counter.
Risks & watch-outs
- Climate carrying-cost: severe wind risk, 99% chance of damaging wind over 30y; extreme-heat days projected 7→18/yr by 2055 (HVAC capex compounding) — expect insurance premiums to compound above CPI over the hold.
Questions for the listing agent
- Is there a deadline driving the sale (1031 exchange, divorce, estate, relocation)? That informs how much negotiation room exists.
- Crime grade is F in this area — have there been break-ins, vandalism, or insurance claims at this property in the last 3 years? What carrier currently insures it and at what premium?
- The area grade is low — what's the realistic commute time and amenity access for the typical tenant pool here? Any planned neighborhood developments (good or bad) we should know about?
- What's the average days-on-market for RENTAL listings here right now (not sales)? A rising rental-DOM trend means longer vacancies and softer asking-rent achievability than the comps imply.
- What's the recent tenant-quality profile in this submarket — average credit score on applications, eviction rate, late-payment / NSF rate, and stable-employment percentage? A property-management company in the area should have these aggregated.
- How much new for-sale + rental construction is in the pipeline within 1–3 miles? Heavy new supply typically softens prices + rents 12–24 months out; constrained supply supports both.
Investment metrics
- 1% rule
- 0.81% ✗
- Cap rate
- 6.45%
- Cash-on-cash
- 0.55%
- DSCR
- 1.02
- GRM
- 10.2
CMA / ARV
- ARV (on-the-fly)
- $487,188
- Comps found
- 12
Show comp detail 12 sales within ~0.75 mi
| Address | Dist | Beds/Ba | Sqft | Sold | Price | $/sf | Match |
|---|---|---|---|---|---|---|---|
| 2017 Lafayette St | 0.17mi | 3/2.0 | 1,366 (-3%) | 1mo | $459,900 | $337 | 82 |
| 2013 Lafayette St | 0.19mi | 3/2.0 | 1,232 (-12%) | 4mo | $440,000 | $357 | 63 |
| 1404 Laudonniere St | 0.39mi | 3/1.5 | 1,267 (-10%) | 1mo | $438,000 | $346 | 63 |
| 1403 Park Ave | 0.36mi | 3/2.0 | 1,460 (+4%) | 12mo | $225,000 | $154 | 63 |
| 1405 Lafayette St | 0.38mi | 2/2.0 (-1) | 1,353 (-4%) | 6mo | $470,000 | $347 | 62 |
| 1117 Lafayette St | 0.54mi | 3/2.5 | 1,379 (-2%) | 14mo | $465,000 | $337 | 54 |
| 1119 Lafayette St | 0.53mi | 3/2.5 | 1,459 (+4%) | 16mo | $539,000 | $369 | 50 |
| 1115 Emmons St | 0.51mi | 3/3.0 | 1,500 (+7%) | 10mo | $385,000 | $257 | 48 |
| 2204 Wilson Dr | 0.74mi | 2/1.5 (-1) | 1,296 (-8%) | 1mo | $805,000 | $621 | 45 |
| 918 La Chere St | 0.73mi | 3/2.0 | 1,252 (-11%) | 9mo | $510,000 | $407 | 37 |
| 2908 Waters Edge Ct E | 0.72mi | 3/2.0 | 1,221 (-13%) | 15mo | $657,500 | $538 | 28 |
| 2704 Oaklawn St | 0.72mi | 2/2.0 (-1) | 1,244 (-11%) | 18mo | $405,000 | $326 | 24 |
Match score weights: distance 35% · size 25% · config 20% · recency 20%. Top-matched comps best support the ARV.
Projected returns pro-forma
-3.0% appreciation · 0.0% rent growth · sell at horizon
- IRR
- -18.6%
- Equity multiple
- 0.36×
- Total profit
- $-48,946
- Equity at exit
- $41,003
- IRR
- -17.7%
- Equity multiple
- 0.15×
- Total profit
- $-65,351
- Equity at exit
- $23,777
Cash invested: $77,000 (down + closing). Projections, not guarantees.
Landlord ↔ Tenant lean methodology
- Overall (STATE)
- 90 Strongly Landlord-Friendly
- State South Carolina
- 90 Strongly Landlord-Friendly · R+6
- County
- — inherits STATE
- City
- — inherits STATE
ZIP-level market 29902
- Home prices YoY
- -29.9%
- Rents YoY
- -1.9%
- Active inventory
- 259
- Price-to-rent
- 10.2×
Monthly cashflow live
- Estimated rent
- $2,237 high interval (Pro) →
- Mortgage (P&I)
- −$1,442
- Tax from tax record
- −$175 /mo · $2,101/yr
- Insurance
- −$115
- HOA
- −$0
- Vacancy / Maint / Mgmt
- −$470
- Net cashflow
- $35
Break-even live
UW: 25.0% down · 7.5% · 30yr · 1.5% tax · 5.0% vac · 8.0% maint · 8.0% mgmt
Financing live
Cash to close
- Down payment
- $68,750
- Closing costs
- $8,250
- Reserves months
- —
- Total cash needed
- —
Loan-product check · same deal, 3 products live
Conventional
25% down · 7.5% · 30yr
- Down + closing
- —
- Monthly P&I
- —
- Monthly cashflow
- —
- DSCR
- —
- Eligible?
- —
Personal DTI + credit; lowest rate.
DSCR
20% down · 8.5% · 30yr
- Down + closing
- —
- Monthly P&I
- —
- Monthly cashflow
- —
- DSCR
- —
- Eligible?
- —
No personal income docs; deal must DSCR.
Hard money
10% down · 12.0% · 12mo
- Down + closing
- —
- Monthly P&I
- —
- Monthly cashflow
- —
- DSCR
- —
- Eligible?
- —
Short-term bridge; refi at stabilization.
Rent comps 6 comps
| Address | Beds | Baths | Sqft | Rent | $/sqft | DOM | Units | Dist |
|---|---|---|---|---|---|---|---|---|
| 2105 Carolina Wren Dr Beaufort, SC | 3.0 | 2.0 | 1250 | $1,578 | $1.26 | 44d | 1 | 0.47mi |
| 903 Emmons St Beaufort, SC | 2.0 | 1.0 | 1200 | $2,350 | $1.96 | 13d | 1 | 0.71mi |
| 413 Meritta Ave Beaufort, SC | 3.0 | 2.0 | 1500 | $2,900 | $1.93 | 21d | 1 | 0.81mi |
| 409 Church St Beaufort, SC | 2.0 | 1.0 | 1020 | $1,900 | $1.86 | 21d | 1 | 0.84mi |
| 2927 Waters Edge Ct Beaufort, SC | 3.0 | 2.0 | 1185 | $3,100 | $2.62 | 21d | 1 | 0.84mi |
| 1505 Palmetto Dr Beaufort, SC | 3.0 | 2.0 | 1353 | $1,600 | $1.18 | 44d | 1 | 1.16mi |
Listing history 4 events
-
2026-05-21$275,000 Active
-
2026-05-20historical $275,000
-
2017-06-09$80,000
-
2017-06-08$80,000
ⓘ Source: listings_history table (triggers on properties + properties_extension) + one-shot
backfill from property_details.listing_events for pre-trigger history.
Tax reassessment forecast SC · Resets to sale price
- Current annual tax
- $2,101 · $175/mo
- Projected year-2 tax
- $2,101 · $175/mo
- Expected delta
- $0/yr ($0/mo · 0.0%)
ⓘ Screening estimate from a state-policy table — verify with the county assessor before closing.
Climate risk First Street
- Flood 1/10 Low FEMA zone X (unshaded) · 0% chance over 30 yrs
- Wildfire 1/10 Low
- Heat 10/10 Extreme 7 d/yr ≥107°F today · 18 d/yr by 30 yrs out
- Wind 9/10 Extreme 99% chance of damaging wind over 30 yrs
- Air quality 3/10 Moderate 3 unhealthy d/yr today · 3 by 30 yrs out
Nearby sold comps map
Loading sold comps map…
Walkable amenities ~0.75 mi
Loading nearby amenities…
Taxation est. · year 1
- Rental income
- $26,841
- − Mortgage interest
- −$15,404
- − Property taxes
- −$2,101
- − Insurance
- −$1,375
- − Repairs & maintenance
- −$2,147
- − Management
- −$2,147
- − Depreciation
- −$8,000
- Taxable loss
- −$4,334
- Est. tax savings @ 24.0%
- +$1,040
- After-tax cash flow
- $1,463/yr
For passive investors: Depreciation is non-cash, so a rental often shows a tax loss while cash-flowing — sheltering income. Rental losses are passive: they offset passive income freely, and up to $25,000/yr can offset ordinary (W-2) income if you actively participate and your MAGI is under $100k (phasing out to $0 by $150k); unused losses carry forward. On sale, claimed depreciation is recaptured at up to 25%, and gains may owe capital-gains tax (a 1031 exchange can defer both). Figures are a year-1 estimate at your 24.0% rate — not tax advice; consult a CPA.
Schools (NCES district)
- District
- Beaufort 01
- NCES district ID
- 4501110
- Math proficiency
- 42% ▼ -8.00%
- Reading proficiency
- 51% ▲ 2.00%
- Median HH income
- $57,430
- Composite
- 40.56/100
- National rank
- #3699
- State rank
- #17 of 80 in SC
Livability — Beaufort
- Score
- 69/100
- State rank
- #76
- US rank
- #8748
Category grades
Schools grade is shown separately in the Schools card above.
Census & demographics
- Census place
- Beaufort, SC
- County
- Beaufort County · 163,770 people
- City population
- 42,992
- Metro
- Hilton Head Island-Bluffton, SC
- Population (ZIP)
- 17,650
- Household income
- $69,752
- Rent vs Own
- Severe rent burden
- 672.0
Population outlook (Beaufort County) Hauer SSP2
- Today (2025)
- 211,915 people
- By 2030
- 227,272 · +7.2%
- By 2040
- 253,861 · +19.8%
- By 2050
- 275,126 · +29.8%
- By 2075
- 311,022 · +46.8%
- By 2100
- 321,286 · +51.6%
Race, ethnicity, and origin ACS 2023
- Neighborhood character
- Majority White (64%)
- Race & ethnicity
- White 64% Black 18% Two or more races 8% Hispanic / Latino 8% Asian 3%
- Hispanic origin (detail)
- Mexican 3% Puerto Rican 2%
- Common ancestry
- Lithuanian 3% Slovak 3% Serbian 2%
- Foreign-born
- 6% · Canada, Vietnam, Jamaica
- Languages at home
- 90% English-only · Spanish 6% Vietnamese 2%
Political lean MEDSL · Beaufort
- 2024 margin
- R (+14.5) · D 42.1% · R 56.6% · Other 1.2%
- 2008→2024 swing
- -3.7pp toward R · 2008: -10.8pp · 2024: -14.5pp
- All cycles
- 2024: R+14.5 2020: R+10.0 2016: R+14.3 2012: R+17.5 2008: R+10.8
Not yet ingested
- Civics
- —
Market trends
- HPI YoY
- ▼ -146.81%
- Current HPI
- 343.9292
- Rent YoY
- ▼ -1.95%
- Metro
- Hilton Head Island-Bluffton, SC
- State GDP YoY
- ▲ 4.51%
- F500 in state
- 2
Industry mix (Fortune 500 HQ in SC)
| Industry | F500 HQs | Revenue |
|---|---|---|
| Packaging | 1 | $7B |
|
||
Price history
+243.8% since first listed4 events — show timeline
- 2026-05-21 Listed $275,000 Charleston Trident MLS
- 2026-05-20 Coming Soon $275,000 Charleston Trident MLS
- 2017-06-09 Listed $80,000 RSMLS
- 2017-06-08 Listed $80,000 LRMLS
Property tax history
+3.9%/yrLatest (2025): $2,101 · +1.2% YoY. Source: county tax records.
Cash-flow waterfall
monthlySold comps — $/sqft
last 12 mo · ≤1 miLoading sold comps…