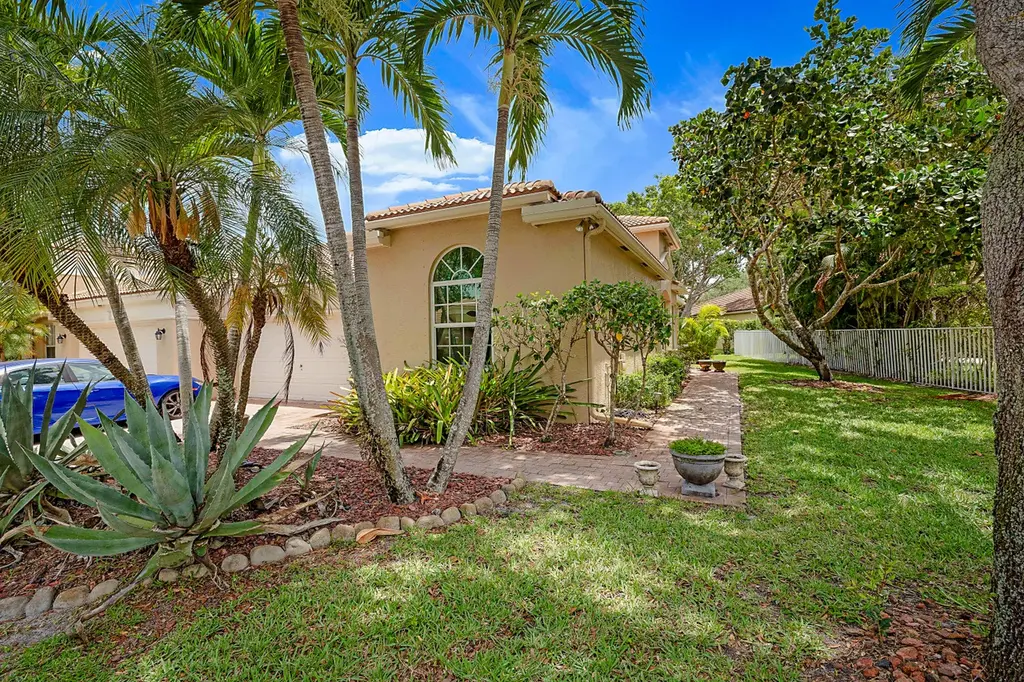
2568 Sandy Cay · West Palm Beach, FL
Flood risk 1/10 · Minimal
- FEMA flood zone
- X (unshaded)
- Chance of flooding over 30 yrs
- 0.0%
- Est. flood insurance / yr
- $507 – $1,088
Fire risk 6/10 · Moderate
- Est. fire insurance / yr
- $947 – $1,759
Heat risk 9/10 · Severe
- Hot days now (above 106°F)
- 7 days/yr
- Hot days in 30 yrs
- 25 days/yr
Wind risk 10/10 · Severe
- Chance of severe wind over 30 yrs
- 99.0%
Air-quality risk 2/10 · Minimal
- Unhealthy air days now
- 0 days/yr
- Unhealthy air days in 30 yrs
- 1 days/yr
Risk factors via First Street. Map © Google.
Why this score? — see what drove the F grade
The composite is a weighted blend of 9 inputs, each scored 0–100. Each bar is that input's sub-score; the figure is the points it added to the 100-point composite (weight × sub-score).
- Appreciation +10.0/10.0
- Cash flow +6.4/30.0
- Schools +4.3/10.0
- Livability +4.1/5.0
- Rent growth +2.7/5.0
- Condition / age +2.5/5.0
- 1% rule +1.6/10.0
- ARV discount +1.0/15.0
- DSCR +0.7/10.0
$469,000
🖨 Deal sheet (PDF) 📄 Offer letter ✓ Due diligence
Listing remarks
This extended Malibu corner model is situated on a spacious lot in Brittany Bay. including Patio with brick pavers and fenced in yard. Open & bright layout, featuring hardwood flooring in the master bedroom and den, which can also serve as a third bedroom. Additional highlights include Hunter Douglas blinds, a built-in wall unit in the living room, extra high-hat lighting, and upgraded mirrors in the master bath.
Key facts
- Hardwood flooring
- Built-in wall unit
- Fenced in yard
Tags
Property features AI
Finance
- Other: Pets allowed (restrictions possible)
- HOA & community: HOA with amenities including clubhouse, fitness center, pool, spa/hot tub, parking, and maintained community; HOA fee $361 monthly (includes common area maintenance)
Exterior
- Parking: Attached 2-car garage; Driveway; 2 covered parking spaces
- Utilities: Public water; Public sewer; Electricity connected; Cable connected; Phone available
- Home design: Villa; Single-story; Faces southwest; Resale condition; Builder model: Malibu
- Construction: Concrete block with stucco construction; Barrel tile roof
- Exterior features: Corner lot; Private maintained road; Not waterfront
Interior
- Kitchen: Dishwasher; Microwave; Refrigerator; Electric cooktop
- Bedrooms: 3 bedrooms on the main level
- Flooring: Tile
- Bathrooms: 2 full bathrooms (main level)
- Heating & cooling: Central heating; Central air conditioning
- Interior features: Walk-in closets; Unfurnished
- Laundry & utility: Dedicated laundry room
Neighborhood map
What this means for you Summary
Snapshot
- This is a 3-bed/2.0-bath townhouse listed at $469k.
Deal economics
- At list price, monthly cash flow is $-814 ($-10k/yr) — negative.
- To cash-flow at today's rent, offer at most $325k (30.6% below list).
- To meet the 1% rule (rent ≥ 1% of price), the offer needs to be $308k (34.4% below list).
- Recommended offer: $308k (34.4% below list) — sets the bar for 1% rule.
Location & tenants
- Location reads 82/100 on livability (#75 in FL, #1,255 nationally) — a professional / high-income tenant draw. Strengths: commute A+, housing A+, health & safety A+; Watch: employment C-, crime F.
- Palm Beach (suburban): math 46% / reading 53% proficiency, ranked #34 of 73 in FL (top 47%) — families likely to look elsewhere, expect single-tenant / working-renter base with shorter leases.
- Zoned schools: Benoist Farms Elementary School (math 22% / reading 28%, grade F, #2,030 of 2,144 statewide, top 95%, 421 students, 80% FRL); Jeaga Middle School (math 18% / reading 30%, grade F, #532 of 571 statewide, top 94%, 941 students, 78% FRL); Palm Beach Lakes High School (math 17% / reading 26%, grade F, #546 of 667 statewide, top 82%, 2,688 students, 70% FRL) — zoned schools average 76% FRL vs 52% district-wide (24 pts higher); higher-poverty schools than district average — tighter screening recommended.
- Zoned-school proficiency averages 24% at this address vs 50% district-wide (-26 pts) — the specific schools serving this property underperform the Palm Beach average; the district grade overstates school quality for this exact location.
- Market conditions: Rents flat; 583 active listings in the ZIP; 21 comparable units currently listed for rent nearby; rentals at typical pace (median 19d on market — plan ~3-4 weeks tenant-placement turnaround); solid renter incomes; 3,974 units permitted in Palm Beach County in 2024 (1,012 in 5+ unit buildings).
- This rent runs 40% of the median local income ($93k/yr) — at the standard rent-burdened threshold; future hikes will face affordability resistance.
Forward outlook
- In year one you build about $50k of equity ($3k loan paydown + $47k appreciation (10.0% local appreciation)).
- Palm Beach County population projected at +30% by 2050 — long-run rental-demand tailwind backs the buy-and-hold thesis.
- By year 2, paydown + projected appreciation supports a ~$81k cash-out refi (75% LTV) — recoverable capital for the next deal without selling this one.
Negotiation context
- It's been on market 69 days — a 6% lower offer ($441k) is reasonable based on typical stale-listing flexibility.
- Current owner paid $303k; list at $469k implies a 55% gain — meaningful room to come down on a strong offer.
Risks & watch-outs
- Climate carrying-cost: severe wind risk, 99% chance of damaging wind over 30y; major wildfire risk; extreme-heat days projected 7→25/yr by 2055 (HVAC capex compounding) — expect insurance premiums to compound above CPI over the hold.
Questions for the listing agent
- What do current leases actually rent for vs. the listed asking? Can we see a recent rent roll and the last 12 months of T-12 income?
- It's been on market 69 days. Have you received any prior offers? Is the seller open to a 34% concession, seller financing, or rate buy-down credit?
- What does the HOA fee cover, when was the last increase, and are there any pending special assessments or reserve-fund shortfalls?
- Why hasn't it sold? Are there any deal-killer items the seller is aware of (foundation, flood, title, zoning, code violations)?
- Is there a deadline driving the sale (1031 exchange, divorce, estate, relocation)? That informs how much negotiation room exists.
- Crime grade is F in this area — have there been break-ins, vandalism, or insurance claims at this property in the last 3 years? What carrier currently insures it and at what premium?
- The area grade is low — what's the realistic commute time and amenity access for the typical tenant pool here? Any planned neighborhood developments (good or bad) we should know about?
- What's the average days-on-market for RENTAL listings here right now (not sales)? A rising rental-DOM trend means longer vacancies and softer asking-rent achievability than the comps imply.
- What's the recent tenant-quality profile in this submarket — average credit score on applications, eviction rate, late-payment / NSF rate, and stable-employment percentage? A property-management company in the area should have these aggregated.
- How much new for-sale + rental construction is in the pipeline within 1–3 miles? Heavy new supply typically softens prices + rents 12–24 months out; constrained supply supports both.
Investment metrics
- 1% rule
- 0.66% ✗
- Cap rate
- 4.21%
- Cash-on-cash
- -7.44%
- DSCR
- 0.67
- GRM
- 12.7
CMA / ARV
- ARV (on-the-fly)
- $409,640
- Comps found
- 2
Show comp detail 2 sales within ~0.75 mi
| Address | Dist | Beds/Ba | Sqft | Sold | Price | $/sf | Match |
|---|---|---|---|---|---|---|---|
| 2131 Man Of War | 0.68mi | 3/2.0 | 1,550 (+1%) | 2mo | $377,000 | $243 | 66 |
| 8597 Mangrove Cay | 0.52mi | 3/2.0 | 1,429 (-7%) | 2mo | $380,000 | $266 | 62 |
Match score weights: distance 35% · size 25% · config 20% · recency 20%. Top-matched comps best support the ARV.
Projected returns pro-forma
10.0% appreciation · 0.85% rent growth · sell at horizon
- IRR
- 18.5%
- Equity multiple
- 2.50×
- Total profit
- $197,137
- Equity at exit
- $422,512
- IRR
- 16.8%
- Equity multiple
- 5.64×
- Total profit
- $609,287
- Equity at exit
- $911,164
Cash invested: $131,320 (down + closing). Projections, not guarantees.
Landlord ↔ Tenant lean methodology
- Overall (STATE)
- 87 Strongly Landlord-Friendly
- State Florida
- 87 Strongly Landlord-Friendly · R+3
- County
- — inherits STATE
- City
- — inherits STATE
ZIP-level market 33411
- Home prices YoY
- 1.9%
- Rents YoY
- 0.8%
- Active inventory
- 583
- Price-to-rent
- 12.7×
Monthly cashflow live
- Estimated rent
- $3,078 high interval (Pro) →
- Mortgage (P&I)
- −$2,459
- Tax from tax record
- −$229 /mo · $2,752/yr
- Insurance
- −$195
- HOA
- −$361
- Vacancy / Maint / Mgmt
- −$646
- Net cashflow
- $-814
Break-even live
Sensitivity live
| Price | -10% $-548 | -5% $-681 | +0% $-814 | +5% $-946 | +10% $-1,079 |
|---|---|---|---|---|---|
| Rent | -10% $-1,057 | -5% $-935 | +0% $-814 | +5% $-692 | +10% $-571 |
| Rate | -1.0pp $-577 | -0.5pp $-694 | base $-814 | +0.5pp $-935 | +1.0pp $-1,059 |
UW: 25.0% down · 7.5% · 30yr · 1.5% tax · 5.0% vac · 8.0% maint · 8.0% mgmt
Financing live
Cash to close
- Down payment
- $117,250
- Closing costs
- $14,070
- Reserves months
- —
- Total cash needed
- —
Loan-product check · same deal, 3 products live
Conventional
25% down · 7.5% · 30yr
- Down + closing
- —
- Monthly P&I
- —
- Monthly cashflow
- —
- DSCR
- —
- Eligible?
- —
Personal DTI + credit; lowest rate.
DSCR
20% down · 8.5% · 30yr
- Down + closing
- —
- Monthly P&I
- —
- Monthly cashflow
- —
- DSCR
- —
- Eligible?
- —
No personal income docs; deal must DSCR.
Hard money
10% down · 12.0% · 12mo
- Down + closing
- —
- Monthly P&I
- —
- Monthly cashflow
- —
- DSCR
- —
- Eligible?
- —
Short-term bridge; refi at stabilization.
Rent comps 21 comps
| Address | Beds | Baths | Sqft | Rent | $/sqft | DOM | Units | Dist |
|---|---|---|---|---|---|---|---|---|
| 2564 Sandy Cay West Palm Beach, FL | 3.0 | 2.0 | 1974 | $4,000 | $2.03 | 26d | 1 | 0.03mi |
| 3910 Sandy Cay West Palm Beach, FL | 3.0 | 2.0 | 1280 | $2,140 | $1.67 | 4d | 1 | 0.13mi |
| 2425 Pigeon Cay West Palm Beach, FL | 3.0 | 2.0 | 1762 | $3,540 | $2.01 | 26d | 1 | 0.36mi |
| 8410 Cargill Pt West Palm Beach, FL | 3.0 | 2.0 | 1421 | $3,350 | $2.36 | 26d | 1 | 0.49mi |
| 2312 Curley Cut West Palm Beach, FL | 3.0 | 2.5 | 1972 | $5,000 | $2.54 | 26d | 1 | 0.61mi |
| 2146 Man of War West Palm Beach, FL | 2.0 | 2.0 | 1209 | $3,000 | $2.48 | 26d | 1 | 0.67mi |
| 1990 Augustine Rd West Palm Beach, FL | 1.0–2.0 | 1.0–2.0 | 1019 | $2,567 | $2.52 | 1d | 15 | 0.70mi |
| 2104 Tigris Dr Unit 2104 West Palm Beach, FL | 3.0 | 2.5 | 1298 | $2,990 | $2.30 | 9d | 1 | 0.70mi |
| 2675 Clipper Cir West Palm Beach, FL | 3.0 | 2.0 | 1984 | $3,500 | $1.76 | 9d | 1 | 0.87mi |
| 9041 Bay Harbour Cir West Palm Beach, FL | 3.0 | 2.0 | 2018 | $3,400 | $1.68 | 5d | 1 | 0.94mi |
| 9041 Bay Harbour Cir West Palm Beach, FL | 3.0 | 2.0 | 2018 | $3,400 | $1.68 | 18d | 1 | 0.94mi |
| 1566 Lake Crystal Dr West Palm Beach, FL | 2.0 | 2.0 | 1200 | $1,800 | $1.50 | 26d | 1 | 1.01mi |
| 1566 Lake Crystal Dr West Palm Beach, FL | 2.0 | 2.0 | 1200 | $1,800 | $1.50 | 20d | 1 | 1.01mi |
| 1561 Balfour Point Dr Unit B West Palm Beach, FL | 3.0 | 2.0 | 1156 | $2,250 | $1.95 | 3d | 1 | 1.02mi |
| 1600 Windorah Way Unit C West Palm Beach, FL | 3.0 | 2.0 | 1156 | $2,290 | $1.98 | 18d | 1 | 1.07mi |
| 7130 Okeechobee Blvd West Palm Beach, FL | 1.0–3.0 | 1.0–2.0 | 1086 | $2,853 | $2.63 | 0d | 8 | 1.14mi |
| 9315 Bridgeport Dr West Palm Beach, FL | 2.0 | 2.0 | 1368 | $2,600 | $1.90 | 26d | 1 | 1.19mi |
| 9363 Bridgeport Dr West Palm Beach, FL | 2.0 | 2.0 | 1368 | $2,750 | $2.01 | 6d | 1 | 1.21mi |
| 9391 Bridgeport Dr West Palm Beach, FL | 3.0 | 2.0 | 1508 | $4,200 | $2.79 | 26d | 1 | 1.23mi |
| 125 Lake Nancy Dr #241 West Palm Beach, FL | 2.0 | 2.0 | 1193 | $1,900 | $1.59 | 12d | 1 | 1.34mi |
| 2325 Sailfish Cove Dr West Palm Beach, FL | 2.0 | 2.0 | 2008 | $3,600 | $1.79 | 26d | 1 | 1.41mi |
HOA detail
- Monthly dues
- $361 · $4,332/yr
Listing history 17 events
-
2026-06-21days on market $469,000 Active 69 DOM
-
2026-06-18days on market $469,000 Active 66 DOM
-
2026-06-17days on market $469,000 Active 65 DOM
-
2026-06-16days on market $469,000 Active 64 DOM
-
2026-06-15days on market $469,000 Active 63 DOM
-
2026-06-13days on market $469,000 Active 61 DOM
-
2026-06-09days on market $469,000 Active 57 DOM
-
2026-06-08days on market $469,000 Active 56 DOM
-
2026-06-07days on market $469,000 Active 55 DOM
-
2026-06-04days on market $469,000 Active 52 DOM
-
2026-06-03days on market $469,000 Active 51 DOM
-
2026-06-02days on market $469,000 Active 50 DOM
-
2026-06-01days on market $469,000 Active 49 DOM
-
2026-05-31days on market $469,000 Active 48 DOM
-
2026-04-11$478,000 Active
-
2005-08-05soldstatus $303,000
-
2001-05-14soldstatus $4,880,952
ⓘ Source: listings_history table (triggers on properties + properties_extension) + one-shot
backfill from property_details.listing_events for pre-trigger history.
Tax reassessment forecast FL · Resets to sale price
- Current annual tax
- $2,752 · $229/mo
- Projected year-2 tax
- $3,893 · $324/mo
- Expected delta
- +$1,141/yr (+$95/mo · 41.5%)
ⓘ Screening estimate from a state-policy table — verify with the county assessor before closing.
Climate risk First Street
- Flood 1/10 Low FEMA zone X (unshaded) · 0% chance over 30 yrs
- Wildfire 6/10 Major
- Heat 9/10 Extreme 7 d/yr ≥106°F today · 25 d/yr by 30 yrs out
- Wind 10/10 Extreme 99% chance of damaging wind over 30 yrs
- Air quality 2/10 Low 0 unhealthy d/yr today · 1 by 30 yrs out
Nearby sold comps map
Loading sold comps map…
Walkable amenities ~0.75 mi
Loading nearby amenities…
Taxation est. · year 1
- Rental income
- $36,935
- − Mortgage interest
- −$26,271
- − Property taxes
- −$2,752
- − Insurance
- −$2,345
- − Repairs & maintenance
- −$2,955
- − Management
- −$2,955
- − HOA
- −$4,332
- − Depreciation
- −$13,644
- Taxable loss
- −$18,318
- Est. tax savings @ 24.0%
- +$4,396
- After-tax cash flow
- $-5,368/yr
For passive investors: Depreciation is non-cash, so a rental often shows a tax loss while cash-flowing — sheltering income. Rental losses are passive: they offset passive income freely, and up to $25,000/yr can offset ordinary (W-2) income if you actively participate and your MAGI is under $100k (phasing out to $0 by $150k); unused losses carry forward. On sale, claimed depreciation is recaptured at up to 25%, and gains may owe capital-gains tax (a 1031 exchange can defer both). Figures are a year-1 estimate at your 24.0% rate — not tax advice; consult a CPA.
Schools (NCES district)
- District
- Palm Beach
- NCES district ID
- 1201500
- Math proficiency
- 46% ▼ -16.00%
- Reading proficiency
- 53% ▼ -4.00%
- Median HH income
- $53,943
- Composite
- 42.72/100
- National rank
- #3160
- State rank
- #34 of 73 in FL
Livability — West Palm Beach
- Score
- 82/100
- State rank
- #75
- US rank
- #1255
Category grades
Schools grade is shown separately in the Schools card above.
Census & demographics
- Census place
- West Palm Beach, FL
- County
- Palm Beach County · 1,438,312 people
- City population
- 222,012
- Metro
- Miami-Fort Lauderdale-Pompano Beach, FL
- Population (ZIP)
- 76,863
- Household income
- $92,591
- Rent vs Own
- Severe rent burden
- 1870.0
Population outlook (Palm Beach County) Hauer SSP2
- Today (2025)
- 1,637,487 people
- By 2030
- 1,743,255 · +6.5%
- By 2040
- 1,948,712 · +19.0%
- By 2050
- 2,132,979 · +30.3%
- By 2075
- 2,530,027 · +54.5%
- By 2100
- 2,706,979 · +65.3%
Race, ethnicity, and origin ACS 2023
- Neighborhood character
- Diverse neighborhood (Simpson 0.70)
- Race & ethnicity
- White 44% Hispanic / Latino 24% Black 23% Two or more races 16% Asian 5%
- Hispanic origin (detail)
- Mexican 2% Puerto Rican 5% Cuban 4% Dominican 2%
- Common ancestry
- Hispanic 6% Romanian 2% Italian 1%
- Foreign-born
- 26% · Canada, Jamaica, China
- Languages at home
- 73% English-only · Spanish 17% French/Haitian/Cajun 4% Other Indo-European 2%
Political lean MEDSL · Palm Beach
- 2024 margin
- Toss-up / Even · D 50.0% · R 49.2%
- 2008→2024 swing
- -22.1pp toward R · 2008: 22.9pp · 2024: 0.8pp
- All cycles
- 2024: D+0.8 2020: D+12.8 2016: D+15.3 2012: D+17.0 2008: D+22.9
Not yet ingested
- Civics
- —
Market trends
- HPI YoY
- ▲ 17.04%
- Current HPI
- 903.78
- Rent YoY
- ▲ 0.85%
- Metro
- Miami-Fort Lauderdale-Pompano Beach, FL
- State GDP YoY
- ▲ 3.28%
- F500 in state
- 36
Industry mix (Fortune 500 HQ in FL)
| Industry | F500 HQs | Revenue |
|---|---|---|
| Industrial Technology | 2 | $29B |
|
||
| Insurance | 2 | $17B |
|
||
| Retail | 1 | $60B |
|
||
| Technology Distribution | 1 | $58B |
|
||
| Homebuilding | 1 | $35B |
|
||
| Technology Manufacturing | 1 | $35B |
|
||
Price history
-90.2% since first listed3 events — show timeline
- 2026-04-11 Listed $478,000 Beaches MLS
- 2005-08-05 Sold (Public Records) $303,000 Public Records
- 2001-05-14 Sold (Public Records) $4,880,952 Public Records
Property tax history
+0.4%/yrLatest (2025): $2,752 · +3.8% YoY. Source: county tax records.
Cash-flow waterfall
monthlySold comps — $/sqft
last 12 mo · ≤1 miLoading sold comps…