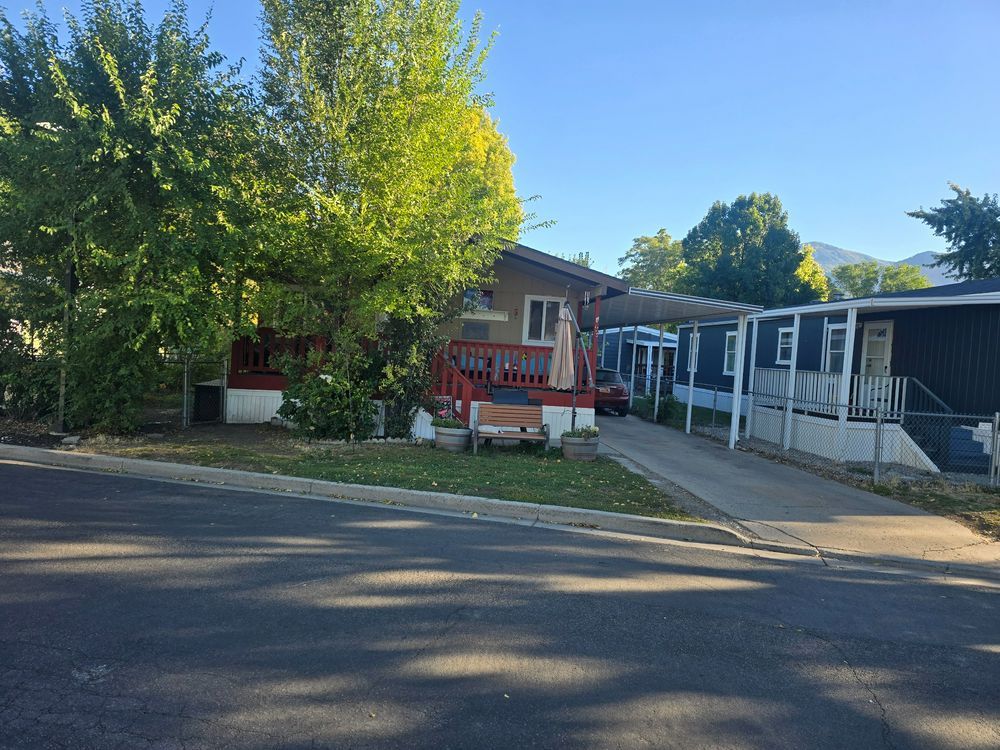
900 Century Dr · Ogden, UT
Flood risk No data
- FEMA flood zone
- —
- Chance of flooding over 30 yrs
- —
- Est. flood insurance / yr
- —
Fire risk No data
- Est. fire insurance / yr
- —
Heat risk No data
- Hot days now (above threshold)
- —
- Hot days in 30 yrs
- —
Wind risk No data
- Chance of severe wind over 30 yrs
- —
Air-quality risk No data
- Unhealthy air days now
- —
- Unhealthy air days in 30 yrs
- —
Risk factors via First Street. Map © Google.
Why this score? — see what drove the B- grade
The composite is a weighted blend of 9 inputs, each scored 0–100. Each bar is that input's sub-score; the figure is the points it added to the 100-point composite (weight × sub-score).
- Cash flow +30.0/30.0
- 1% rule +10.0/10.0
- DSCR +10.0/10.0
- ARV discount +7.5/15.0
- Livability +4.2/5.0
- Rent growth +3.1/5.0
- Condition / age +2.5/5.0
- Schools +2.4/10.0
- Appreciation +0.0/10.0
$50,000
🖨 Deal sheet (PDF) 📄 Offer letter ✓ Due diligence
Key facts
- Built 1998
- Listed 239 days
Neighborhood map
What this means for you Summary
Snapshot
- This is a 3-bed/2.0-bath manufactured listed at $50k.
Deal economics
- At list price, monthly cash flow is $1k ($13k/yr) — positive.
- The deal already cash-flows at list — no discount required.
- Meets the 1% rule at list price ($2k rent vs $50k).
- Recommended offer: $44k (12.0% below list) — sets the bar for market timing.
Location & tenants
- Location reads 84/100 on livability (#19 in UT, #810 nationally) — a professional / high-income tenant draw. Strengths: amenities A+, commute A+, cost of living A+; Watch: crime F.
- Ogden City District (urban): math 25% / reading 31% proficiency, ranked #72 of 80 in UT (top 90%) — low school quality limits family demand, transient renter base, plan for 1-2y turnover; 75% free/reduced lunch — lower-income household profile, screen leases tightly.
- Zoned schools: Heritage School (math 21% / reading 25%, grade F, #501 of 585 statewide, top 86%, 638 students, 100% FRL); Highland Junior High (math 12% / reading 18%, grade F, #135 of 138 statewide, top 98%, 715 students, 0% FRL); Ben Lomond High (math 11% / reading 28%, grade F, #158 of 171 statewide, top 94%, 1,169 students, 44% FRL) — zoned schools average 48% FRL vs 75% district-wide (27 pts lower); this property's tenant base skews higher-income than the district average.
- Market conditions: Rents rising (+2.3%/yr); 625 active listings in the ZIP; 20 comparable units currently listed for rent nearby; rentals at typical pace (median 25d on market — plan ~3-4 weeks tenant-placement turnaround); solid renter incomes; 1,630 units permitted in Weber County in 2024 (521 in 5+ unit buildings).
Forward outlook
- Local home prices are declining (-3.0%/yr); year-one equity from $346 of loan paydown is wiped out by about $2k of value loss. Plan a longer hold.
- Weber County population projected at +24% by 2050 — long-run rental-demand tailwind backs the buy-and-hold thesis.
- At projected returns (-3.0% appreciation + 2.3% rent growth), your $14k cash investment doubles in ~2 years — after that, you're playing with house money.
Negotiation context
- It's been on market 239 days — a 12% lower offer ($44k) is reasonable based on typical stale-listing flexibility.
- 9 sale attempts since 28y ago with the ask held roughly flat each time — persistent listings suggest the price (not the market) is what's stuck; bring a comps-based counter.
Questions for the listing agent
- It's been on market 239 days. Have you received any prior offers? Is the seller open to a 12% concession, seller financing, or rate buy-down credit?
- Why hasn't it sold? Are there any deal-killer items the seller is aware of (foundation, flood, title, zoning, code violations)?
- Is there a deadline driving the sale (1031 exchange, divorce, estate, relocation)? That informs how much negotiation room exists.
- Crime grade is F in this area — have there been break-ins, vandalism, or insurance claims at this property in the last 3 years? What carrier currently insures it and at what premium?
- What's the average days-on-market for RENTAL listings here right now (not sales)? A rising rental-DOM trend means longer vacancies and softer asking-rent achievability than the comps imply.
- What's the recent tenant-quality profile in this submarket — average credit score on applications, eviction rate, late-payment / NSF rate, and stable-employment percentage? A property-management company in the area should have these aggregated.
- How much new for-sale + rental construction is in the pipeline within 1–3 miles? Heavy new supply typically softens prices + rents 12–24 months out; constrained supply supports both.
Investment metrics
- 1% rule
- 3.66% ✓
- Cap rate
- 32.66%
- Cash-on-cash
- 94.17%
- DSCR
- 5.19
- GRM
- 2.3
CMA / ARV
No comps found within radius.
Projected returns pro-forma
-3.0% appreciation · 2.33% rent growth · sell at horizon
- IRR
- 94.3%
- Equity multiple
- 5.33×
- Total profit
- $60,678
- Equity at exit
- $7,455
- IRR
- 96.9%
- Equity multiple
- 10.86×
- Total profit
- $138,100
- Equity at exit
- $4,323
Cash invested: $14,000 (down + closing). Projections, not guarantees.
Landlord ↔ Tenant lean methodology
- Overall (STATE)
- 86 Strongly Landlord-Friendly
- State Utah
- 86 Strongly Landlord-Friendly · R+15
- County
- — inherits STATE
- City
- — inherits STATE
ZIP-level market 84404
- Rents YoY
- 2.3%
- Active inventory
- 625
- Price-to-rent
- 2.3×
Monthly cashflow live
- Estimated rent
- $1,828 high interval (Pro) →
- Mortgage (P&I)
- −$262
- Tax est. 1.5%
- −$62 /mo · $750/yr
- Insurance
- −$21
- HOA
- −$0
- Vacancy / Maint / Mgmt
- −$384
- Net cashflow
- $1,099
Break-even live
Sensitivity live
| Price | -10% $1,133 | -5% $1,116 | +0% $1,099 | +5% $1,081 | +10% $1,064 |
|---|---|---|---|---|---|
| Rent | -10% $954 | -5% $1,026 | +0% $1,099 | +5% $1,171 | +10% $1,243 |
| Rate | -1.0pp $1,124 | -0.5pp $1,111 | base $1,099 | +0.5pp $1,086 | +1.0pp $1,073 |
UW: 25.0% down · 7.5% · 30yr · 1.5% tax · 5.0% vac · 8.0% maint · 8.0% mgmt
Financing live
Cash to close
- Down payment
- $12,500
- Closing costs
- $1,500
- Reserves months
- —
- Total cash needed
- —
Loan-product check · same deal, 3 products live
Conventional
25% down · 7.5% · 30yr
- Down + closing
- —
- Monthly P&I
- —
- Monthly cashflow
- —
- DSCR
- —
- Eligible?
- —
Personal DTI + credit; lowest rate.
DSCR
20% down · 8.5% · 30yr
- Down + closing
- —
- Monthly P&I
- —
- Monthly cashflow
- —
- DSCR
- —
- Eligible?
- —
No personal income docs; deal must DSCR.
Hard money
10% down · 12.0% · 12mo
- Down + closing
- —
- Monthly P&I
- —
- Monthly cashflow
- —
- DSCR
- —
- Eligible?
- —
Short-term bridge; refi at stabilization.
Rent comps 20 comps
| Address | Beds | Baths | Sqft | Rent | $/sqft | DOM | Units | Dist |
|---|---|---|---|---|---|---|---|---|
| 801 Century Dr Ogden, UT | 2.0 | 2.5 | 1357 | $1,800 | $1.33 | 25d | 1 | 0.09mi |
| 1075 Century Dr Ogden, UT | 2.0 | 1.0–2.0 | 731 | $1,599 | $2.19 | 25d | 1 | 0.28mi |
| 561 S 375 W Ogden, UT | 4.0 | 2.0 | 1112 | $2,200 | $1.98 | 15d | 1 | 0.28mi |
| 407 W 12th St Ogden, UT | 2.0 | 1.0–2.0 | 694 | $1,650 | $2.38 | 25d | 1 | 0.41mi |
| 231 W 12th St Ogden, UT | 1.0–2.0 | 1.0–2.0 | 813 | $1,544 | $1.90 | 15d | 14 | 0.50mi |
| 117 4th St S Unit 119 Ogden, UT | 3.0 | 2.5 | 1500 | $1,899 | $1.27 | 25d | 1 | 0.66mi |
| 348 8th St Ogden, UT | 2.0 | 1.0 | 1037 | $1,695 | $1.63 | 25d | 1 | 0.82mi |
| 940 Kiesel Ave Ogden, UT | 2.0 | 1.0 | 708 | $1,200 | $1.69 | 25d | 1 | 0.83mi |
| 1658 Gibson Ave Ogden, UT | 2.0 | 2.0 | 1057 | $1,800 | $1.70 | 22d | 1 | 0.87mi |
| 1690 S 250 W Ogden, UT | 1.0–3.0 | 1.0–2.5 | 1145 | $2,314 | $2.02 | 25d | 14 | 0.93mi |
| 324 14th St Ogden, UT | 2.0 | 2.0 | 936 | $1,495 | $1.60 | 25d | 1 | 0.97mi |
| 1324 Washington Blvd Ogden, UT | 2.0 | 1.0 | 1152 | $1,200 | $1.04 | 25d | 1 | 1.06mi |
| 455 2nd St Ogden, UT | 1.0–2.0 | 1.0–2.0 | 838 | $1,499 | $1.79 | 15d | 5 | 1.16mi |
| 200 N Harrisville Rd Ogden, UT | 2.0 | 1.0 | 750 | $1,400 | $1.87 | 25d | 1 | 1.23mi |
| 260 West Ogden, UT | 1.0–3.0 | 1.0–2.0 | 970 | $1,880 | $1.94 | 25d | 1 | 1.26mi |
| 462 Canyon Rd Ogden, UT | 2.0 | 1.0 | 900 | $930 | $1.03 | 25d | 1 | 1.28mi |
| 381 N Washington Blvd Ogden, UT | 1.0–3.0 | 1.0–2.0 | 1062 | $1,683 | $1.58 | 15d | 15 | 1.29mi |
| 643 12th St Ogden, UT | 3.0 | 2.5 | 1385 | $1,935 | $1.40 | 25d | 1 | 1.31mi |
| 662 4th St Ogden, UT | 3.0 | 1.0 | 1382 | $1,950 | $1.41 | 25d | 1 | 1.34mi |
| 615 15th St Ogden, UT | 2.0 | 1.0 | 1097 | $1,000 | $0.91 | 25d | 1 | 1.41mi |
Listing history 23 events
-
2026-06-03days on market $50,000 Active 239 DOM
-
2026-06-02days on market $50,000 Active 238 DOM
-
2026-06-01days on market $50,000 Active 237 DOM
-
2026-05-31days on market $50,000 Active 236 DOM
-
2026-05-31days on market $50,000 Active 235 DOM
-
2025-10-07$50,000 Active
-
2017-10-13historical
-
2017-06-28status Under Contract
-
2017-05-29historical
-
2017-04-21$35,000 Active
-
2016-12-04$50,000 Active
-
2006-05-08historical
-
2005-11-07$44,900
-
2005-10-31historical
-
2005-04-21$45,000
-
2001-11-06soldstatus
-
2001-07-10$29,900
-
1999-12-29historical
-
1999-11-11historical
-
1999-07-11$29,000
-
1999-05-30historical
-
1999-05-26$20,000
-
1998-06-22$23,000
ⓘ Source: listings_history table (triggers on properties + properties_extension) + one-shot
backfill from property_details.listing_events for pre-trigger history.
Nearby sold comps map
Loading sold comps map…
Walkable amenities ~0.75 mi
Loading nearby amenities…
Taxation est. · year 1
- Rental income
- $21,938
- − Mortgage interest
- −$2,801
- − Property taxes
- −$750
- − Insurance
- −$250
- − Repairs & maintenance
- −$1,755
- − Management
- −$1,755
- − Depreciation
- −$1,455
- Taxable income
- $13,173
- Est. tax owed @ 24.0%
- −$3,161
- After-tax cash flow
- $10,023/yr
For passive investors: Depreciation is non-cash, so a rental often shows a tax loss while cash-flowing — sheltering income. Rental losses are passive: they offset passive income freely, and up to $25,000/yr can offset ordinary (W-2) income if you actively participate and your MAGI is under $100k (phasing out to $0 by $150k); unused losses carry forward. On sale, claimed depreciation is recaptured at up to 25%, and gains may owe capital-gains tax (a 1031 exchange can defer both). Figures are a year-1 estimate at your 24.0% rate — not tax advice; consult a CPA.
Schools (NCES district)
- District
- Ogden City District
- NCES district ID
- 4900720
- Math proficiency
- 25% ▼ -2.00%
- Reading proficiency
- 31% ▼ -5.00%
- Median HH income
- $41,974
- Composite
- 23.76/100
- National rank
- #7818
- State rank
- #72 of 80 in UT
Livability — Ogden
- Score
- 84/100
- State rank
- #19
- US rank
- #810
Category grades
Schools grade is shown separately in the Schools card above.
Census & demographics
- Census place
- Ogden, UT
- County
- Weber County · 260,557 people
- City population
- 152,611
- Metro
- Ogden-Clearfield, UT
- Population (ZIP)
- 66,587
- Household income
- $85,057
- Rent vs Own
- Severe rent burden
- 1201.0
Population outlook (Weber County) Hauer SSP2
- Today (2025)
- 274,329 people
- By 2030
- 288,577 · +5.2%
- By 2040
- 314,848 · +14.8%
- By 2050
- 338,710 · +23.5%
- By 2075
- 384,412 · +40.1%
- By 2100
- 409,305 · +49.2%
Race, ethnicity, and origin ACS 2023
- Neighborhood character
- Predominantly White (70%)
- Race & ethnicity
- White 70% Hispanic / Latino 24% Two or more races 7% Asian 1%
- Hispanic origin (detail)
- Mexican 20%
- Common ancestry
- Italian 5% Slovak 4% Iranian 3%
- Foreign-born
- 8% · Canada
- Languages at home
- 83% English-only · Spanish 15% Other Indo-European 1%
Political lean MEDSL · Weber
- 2024 margin
- Strong R (+23.5) · D 36.8% · R 60.3% · Other 2.9%
- 2008→2024 swing
- +4.1pp toward D · 2008: -27.6pp · 2024: -23.5pp
- All cycles
- 2024: R+23.5 2020: R+22.7 2016: R+20.0 2012: R+46.0 2008: R+27.6
Not yet ingested
- Civics
- —
Market trends
- HPI YoY
- ▼ -317.85%
- Current HPI
- 323.2499
- Rent YoY
- ▲ 2.33%
- Metro
- Ogden-Clearfield, UT
- State GDP YoY
- ▲ 3.54%
- F500 in state
- 2
Industry mix (Fortune 500 HQ in UT)
| Industry | F500 HQs | Revenue |
|---|---|---|
| Financial Services | 1 | $3B |
|
||
Price history
+117.4% since first listed18 events — show timeline
- 2025-10-07 Listed $50,000 ForSaleByOwner.com
- 2017-10-13 Listing Removed — WFRMLS
- 2017-06-28 Pending — WFRMLS
- 2017-05-29 Listing Removed — WFRMLS
- 2017-04-21 Listed $35,000 WFRMLS
- 2016-12-04 Listed $50,000 WFRMLS
- 2006-05-08 Listing Removed — WFRMLS
- 2005-11-07 Listed $44,900 WFRMLS
- 2005-10-31 Listing Removed — WFRMLS
- 2005-04-21 Listed $45,000 WFRMLS
- 2001-11-06 Sold (MLS) — WFRMLS
- 2001-07-10 Listed $29,900 WFRMLS
- 1999-12-29 Listing Removed — WFRMLS
- 1999-11-11 Listing Removed — WFRMLS
- 1999-07-11 Listed $29,000 WFRMLS
- 1999-05-30 Listing Removed — WFRMLS
- 1999-05-26 Listed $20,000 WFRMLS
- 1998-06-22 Listed $23,000 WFRMLS
Cash-flow waterfall
monthlySold comps — $/sqft
last 12 mo · ≤1 miLoading sold comps…