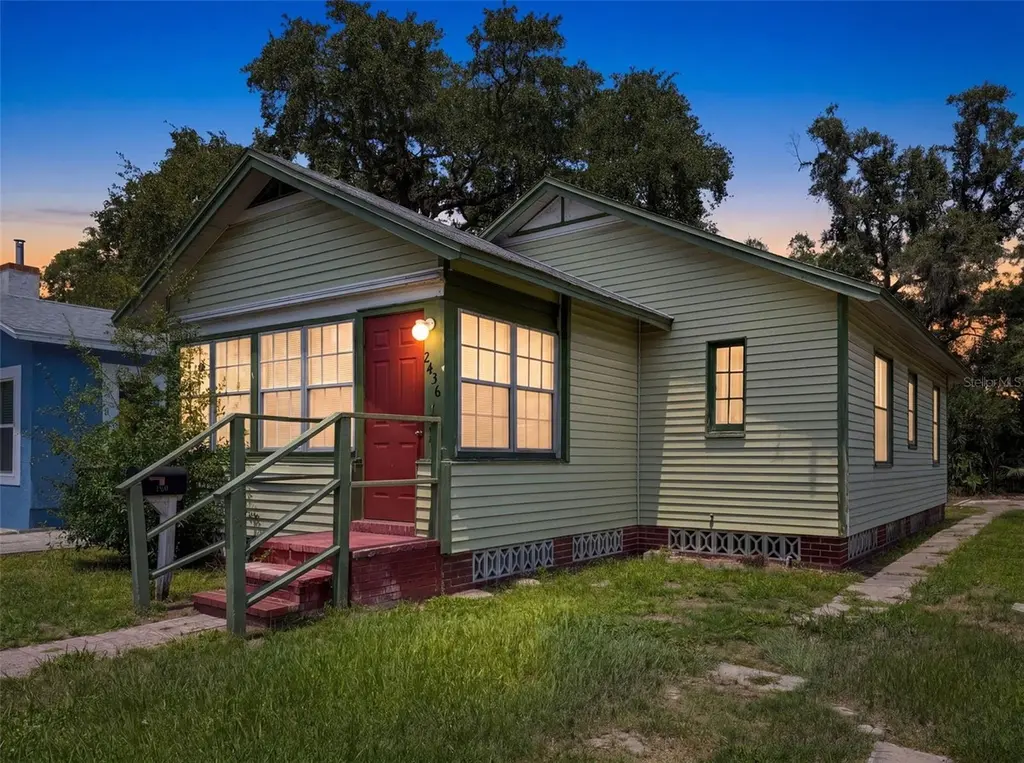
2436 10th St S · St. Petersburg, FL
Flood risk 8/10 · Major
- FEMA flood zone
- X (shaded)
- Chance of flooding over 30 yrs
- 0.97%
- Est. flood insurance / yr
- $507 – $1,088
Fire risk 1/10 · Minimal
- Est. fire insurance / yr
- $947 – $1,759
Heat risk 10/10 · Severe
- Hot days now (above 106°F)
- 7 days/yr
- Hot days in 30 yrs
- 24 days/yr
Wind risk 10/10 · Severe
- Chance of severe wind over 30 yrs
- 99.0%
Air-quality risk 3/10 · Minor
- Unhealthy air days now
- 3 days/yr
- Unhealthy air days in 30 yrs
- 4 days/yr
Risk factors via First Street. Map © Google.
Why this score? — see what drove the C- grade
The composite is a weighted blend of 9 inputs, each scored 0–100. Each bar is that input's sub-score; the figure is the points it added to the 100-point composite (weight × sub-score).
- Cash flow +16.4/30.0
- ARV discount +12.7/15.0
- DSCR +5.1/10.0
- 1% rule +4.5/10.0
- Schools +4.3/10.0
- Rent growth +2.5/5.0
- Livability +2.5/5.0
- Condition / age +2.5/5.0
- Appreciation +0.0/10.0
$185,000
🖨 Deal sheet 📄 Offer letter ✓ Due diligence
Listing remarks
Rare opportunity for investors, builders, and owner-occupants. This property offers multiple paths to value creation, whether renovating the existing home, building a new custom residence, or developing a primary home with a detached income producing ADU. The property is zoned to allow both single family residence and a detached accessory dwelling unit (ADU), creating the potential for two residential structures on one parcel. Seller has conceptual plans available for both: * New 4-bedroom, 2-bath single-family residence * Detached income-producing ADU. These plans provide buyers with a significant head start in the development process and help illustrate the property's highest and best
Key facts
- 5,127 sq ft lot
- Built 1925
- Listed 11 days
Property features AI
Finance
- Other: Lot approximately 0.11 acre (40 x 124); Zoned R (residential); Living area approximately 810 sq ft (public records); Total building area approximately 975 sq ft (public records)
- Financial info: No lease restrictions; Unfurnished
- HOA & community: No HOA/association
Exterior
- Parking: No parking information listed
- Security: No security features listed
- Utilities: Public water; Public sewer; Electricity available; Cable available; Broadband/high-speed internet available
- Home design: Single-family residence; One story; Faces south
- Construction: Built with frame construction and vinyl siding; Other construction materials noted; Shingle roof; Other foundation details
- Exterior features: Rear porch; Sidewalk; Property located inside city limits; Paved road access; Publicly maintained road
Interior
- Kitchen: No kitchen appliances listed
- Bedrooms: 2 bedrooms
- Flooring: Linoleum; Tile
- Bathrooms: 1 full bathroom
- Heating & cooling: No heating; No cooling
- Interior features: No interior amenities listed; Wood-burning fireplace in the family room; 9 total rooms
- Laundry & utility: Laundry room inside the home
Neighborhood map
What this means for you Summary
Snapshot
- This is a 2-bed/1.0-bath single-family listed at $185k.
Deal economics
- At list price, monthly cash flow is $40 ($480/yr) — positive.
- The deal already cash-flows at list — no discount required.
- To meet the 1% rule (rent ≥ 1% of price), the offer needs to be $177k (4.5% below list).
- Recommended offer: $177k (4.5% below list) — sets the bar for 1% rule.
- Cap rate 7.0% vs local median 2.6% in St. Petersburg — top-decile yield for the area; either an underpriced asset or a hidden risk that comps aren't pricing in. Stress-test before assuming the spread holds.
Location & tenants
- Location reads: area grade C — affects rentability + tenant quality, not the cash-flow math above.
- Pinellas (suburban): math 51% / reading 51% proficiency, ranked #31 of 73 in FL (top 42%) — acceptable for families but not a draw, mixed tenant base, ~2y average lease.
- Zoned schools: Campbell Park Elementary School (math 19% / reading 19%, grade F, #2,111 of 2,144 statewide, top 99%, 462 students, 87% FRL); Gibbs High School (math 26% / reading 41%, grade F, #400 of 667 statewide, top 61%, 1,160 students, 64% FRL) — zoned schools average 76% FRL vs 48% district-wide (28 pts higher); higher-poverty schools than district average — tighter screening recommended.
- Zoned-school proficiency averages 26% at this address vs 51% district-wide (-25 pts) — the specific schools serving this property underperform the Pinellas average; the district grade overstates school quality for this exact location.
- Market conditions: Rents soft (-0.1%/yr); 308 active listings in the ZIP; 40 comparable units currently listed for rent nearby; rentals at typical pace (median 20d on market — plan ~3-4 weeks tenant-placement turnaround); 2,676 units permitted in Pinellas County in 2024 (1,422 in 5+ unit buildings).
Forward outlook
- Local home prices are declining (-3.0%/yr); year-one equity from $1k of loan paydown is wiped out by about $6k of value loss. Plan a longer hold.
- Pinellas County population projected at +14% by 2050 — modest demand growth; plan on rents tracking national, not racing it.
Negotiation context
- Only 11 days on market — expect competitive offers; lowballing is unlikely to land.
Risks & watch-outs
- Watch-outs: flood insurance adds $66/mo; built in 1925 — expect roof / HVAC / electrical / plumbing capex.
- Climate carrying-cost: severe flood risk; severe wind risk, 99% chance of damaging wind over 30y; extreme-heat days projected 7→24/yr by 2055 (HVAC capex compounding) — expect insurance premiums to compound above CPI over the hold.
Questions for the listing agent
- Built in 1925 — when were the roof, HVAC, electrical panel, plumbing, and water heater last replaced?
- What's the actual annual flood-insurance premium (NFIP or private), and is the property in a SFHA with mandatory coverage?
- Is there a deadline driving the sale (1031 exchange, divorce, estate, relocation)? That informs how much negotiation room exists.
- What's the average days-on-market for RENTAL listings here right now (not sales)? A rising rental-DOM trend means longer vacancies and softer asking-rent achievability than the comps imply.
- What's the recent tenant-quality profile in this submarket — average credit score on applications, eviction rate, late-payment / NSF rate, and stable-employment percentage? A property-management company in the area should have these aggregated.
- How much new for-sale + rental construction is in the pipeline within 1–3 miles? Heavy new supply typically softens prices + rents 12–24 months out; constrained supply supports both.
Investment metrics
- 1% rule
- 0.95% ✗
- Cap rate
- 6.98%
- Cash-on-cash
- 2.47%
- DSCR
- 1.11
- GRM
- 8.7
CMA / ARV
- ARV (on-the-fly)
- $208,980
- Comps found
- 12
Show comp detail 12 sales within ~0.75 mi
| Address | Dist | Beds/Ba | Sqft | Sold | Price | $/sf | Match |
|---|---|---|---|---|---|---|---|
| 610 28th Ave S | 0.50mi | 2/1.0 | 814 (+0%) | 1mo | $143,000 | $176 | 75 |
| 2045 11th St S | 0.26mi | 2/1.0 | 814 (+0%) | 15mo | $210,000 | $258 | 75 |
| 828 20th Ave S | 0.36mi | 2/1.0 | 834 (+3%) | 12mo | $280,000 | $336 | 68 |
| 1214 20th Ave S | 0.32mi | 2/1.0 | 852 (+5%) | 14mo | $72,000 | $85 | 65 |
| 869 21st Ave S | 0.32mi | 2/1.0 | 894 (+10%) | 8mo | $206,500 | $231 | 61 |
| 1708 Preston St S | 0.69mi | 3/1.0 (+1) | 795 (-2%) | 9mo | $140,000 | $176 | 52 |
| 2510 Queen St S | 0.50mi | 3/2.0 (+1) | 775 (-4%) | 10mo | $247,000 | $319 | 52 |
| 870 18th Ave S | 0.46mi | 2/1.0 | 702 (-13%) | 6mo | $175,000 | $249 | 52 |
| 650 Paris Ave S | 0.72mi | 2/2.0 | 768 (-5%) | 5mo | $107,500 | $140 | 50 |
| 2344 Oakdale St S | 0.68mi | 2/2.0 | 812 (+0%) | 18mo | $319,000 | $393 | 49 |
| 753 16th Ave S | 0.72mi | 2/1.0 | 909 (+12%) | 3mo | $345,000 | $380 | 44 |
| 1441 14th St S | 0.74mi | 3/1.0 (+1) | 929 (+15%) | 18mo | $265,000 | $285 | 21 |
Match score weights: distance 35% · size 25% · config 20% · recency 20%. Top-matched comps best support the ARV.
Projected returns pro-forma
-3.0% appreciation · 0.0% rent growth · sell at horizon
- IRR
- -18.4%
- Equity multiple
- 0.37×
- Total profit
- $-32,533
- Equity at exit
- $27,584
- IRR
- -18.8%
- Equity multiple
- 0.14×
- Total profit
- $-44,753
- Equity at exit
- $15,995
Cash invested: $51,800 (down + closing). Projections, not guarantees.
Landlord ↔ Tenant lean methodology
- Overall (STATE)
- 87 Strongly Landlord-Friendly
- State Florida
- 87 Strongly Landlord-Friendly · R+3
- County
- — inherits STATE
- City
- — inherits STATE
ZIP-level market 33705
- Rents YoY
- -0.1%
- Active inventory
- 308
- Price-to-rent
- 8.7×
Monthly cashflow live
- Estimated rent
- $1,766 high interval (Pro) →
- Mortgage (P&I)
- −$970
- Tax from tax record
- −$242 /mo · $2,900/yr
- Insurance
- −$77
- Flood insurance flood zone
- −$66 /mo · $798/yr
- HOA
- −$0
- Vacancy / Maint / Mgmt
- −$371
- Net cashflow
- $40
Break-even live
UW: 25.0% down · 7.5% · 30yr · 1.5% tax · 5.0% vac · 8.0% maint · 8.0% mgmt
Financing live
Cash to close
- Down payment
- $46,250
- Closing costs
- $5,550
- Reserves months
- —
- Total cash needed
- —
Loan-product check · same deal, 3 products live
Conventional
25% down · 7.5% · 30yr
- Down + closing
- —
- Monthly P&I
- —
- Monthly cashflow
- —
- DSCR
- —
- Eligible?
- —
Personal DTI + credit; lowest rate.
DSCR
20% down · 8.5% · 30yr
- Down + closing
- —
- Monthly P&I
- —
- Monthly cashflow
- —
- DSCR
- —
- Eligible?
- —
No personal income docs; deal must DSCR.
Hard money
10% down · 12.0% · 12mo
- Down + closing
- —
- Monthly P&I
- —
- Monthly cashflow
- —
- DSCR
- —
- Eligible?
- —
Short-term bridge; refi at stabilization.
Rent comps 40 comps
| Address | Beds | Baths | Sqft | Rent | $/sqft | DOM | Units | Dist |
|---|---|---|---|---|---|---|---|---|
| 2222 10th St S Unit B St. Petersburg, FL | 2.0 | 1.0 | 600 | $1,800 | $3.00 | 24d | 1 | 0.14mi |
| 966 22nd Ave S Unit 109 St. Petersburg, FL | 2.0 | 2.0 | 900 | $1,795 | $1.99 | 7d | 1 | 0.15mi |
| 986 22nd Ave S #3 St. Petersburg, FL | 2.0 | 2.0 | 850 | $1,350 | $1.59 | 13d | 1 | 0.16mi |
| 2227 Highland St S Unit 2 St. Petersburg, FL | 1.0 | 1.0 | 550 | $1,200 | $2.18 | 14d | 1 | 0.23mi |
| 2219 Highland St S Unit 3 St. Petersburg, FL | 1.0 | 1.0 | 550 | $1,250 | $2.27 | 24d | 1 | 0.23mi |
| 2219 Highland St S Unit 1 St. Petersburg, FL | 2.0 | 1.0 | 850 | $1,650 | $1.94 | 24d | 1 | 0.23mi |
| 2219 Highland St S #7 St. Petersburg, FL | 1.0 | 1.0 | 550 | $1,200 | $2.18 | 14d | 1 | 0.23mi |
| 2835 Dr Martin Luther King Jr St S Saint Petersburg, FL | 2.0 | 1.0 | 780 | $1,450 | $1.86 | 24d | 1 | 0.29mi |
| 1931 10th St S St. Petersburg, FL | 2.0 | 1.0 | 625 | $1,675 | $2.68 | 14d | 1 | 0.32mi |
| 1919 Doctor Martin Luther King Junior St S Unit 1/2 St. Petersburg, FL | 3.0 | 1.0 | 892 | $2,580 | $2.89 | 20d | 1 | 0.35mi |
| 1919 Doctor Martin Luther King Junior St S Unit 1/2 St. Petersburg, FL | 3.0 | 1.0 | 892 | $2,200 | $2.47 | 2d | 1 | 0.35mi |
| 832 20th Ave S #830 St. Petersburg, FL | 1.0 | 1.0 | 648 | $1,300 | $2.01 | 7d | 1 | 0.36mi |
| 2230 Grove St S Saint Petersburg, FL | 2.0 | 1.0 | 1108 | $1,750 | $1.58 | 4d | 1 | 0.37mi |
| 840 30th Ave S Unit 2 St. Petersburg, FL | 1.0 | 1.0 | 690 | $1,100 | $1.59 | 24d | 1 | 0.41mi |
| 944 18th Ave S Unit A St. Petersburg, FL | 3.0 | 1.0 | 1013 | $2,100 | $2.07 | 17d | 1 | 0.42mi |
| 725 21st Ave S Unit A St. Petersburg, FL | 2.0 | 1.0 | 750 | $1,750 | $2.33 | 17d | 1 | 0.44mi |
| 1320 18th Ave S Saint Petersburg, FL | 2.0 | 1.0 | 750 | $1,550 | $2.07 | 17d | 1 | 0.46mi |
| 672 28th Ave S Saint Petersburg, FL | 3.0 | 1.0 | 1032 | $1,820 | $1.76 | 24d | 1 | 0.47mi |
| 767 19th Ave S Saint Petersburg, FL | 2.0 | 1.0 | 800 | $1,875 | $2.34 | 4d | 1 | 0.49mi |
| 626 23rd Ave S Apt A St. Petersburg, FL | 1.0 | 1.0 | 750 | $1,250 | $1.67 | 24d | 1 | 0.49mi |
| 1715 14th St S St. Petersburg, FL | 2.0 | 1.0 | 1000 | $1,850 | $1.85 | 24d | 1 | 0.52mi |
| 626 29th Ave S Saint Petersburg, FL | 2.0 | 1.0 | 540 | $1,615 | $2.99 | 24d | 1 | 0.53mi |
| 1701 14th St S Unit A St. Petersburg, FL | 2.0 | 1.0 | 1100 | $1,950 | $1.77 | 24d | 1 | 0.53mi |
| 825 32nd Ave S Saint Petersburg, FL | 1.0–3.0 | 1.0–2.5 | 1518 | $2,898 | $1.91 | 2d | 17 | 0.54mi |
| 711 18th Ave S Unit 2 St. Petersburg, FL | 2.0 | 1.0 | 896 | $1,295 | $1.45 | 3d | 1 | 0.58mi |
| 1717 Grove St S Unit 1719 St. Petersburg, FL | 1.0 | 1.0 | 552 | $1,395 | $2.53 | 7d | 1 | 0.60mi |
| 2621 18th St S Saint Petersburg, FL | 3.0 | 1.0 | 1114 | $2,200 | $1.97 | 24d | 1 | 0.60mi |
| 1529 12th St S Unit A St. Petersburg, FL | 2.0 | 1.5 | 700 | $1,550 | $2.21 | 24d | 1 | 0.62mi |
| 2609 4th St S Saint Petersburg, FL | 3.0 | 1.5 | 1095 | $1,595 | $1.46 | 4d | 1 | 0.63mi |
| 1828 20th Ave S Saint Petersburg, FL | 3.0 | 1.0 | 1015 | $1,650 | $1.63 | 24d | 1 | 0.65mi |
| 2729 4th St S Saint Petersburg, FL | 1.0–3.0 | 1.0 | 565 | $1,648 | $2.92 | 23d | 4 | 0.65mi |
| 2410 4th St S Saint Petersburg, FL | 3.0 | 1.0 | 575 | $1,717 | $2.99 | 4d | 1 | 0.65mi |
| 2800 4th St S Saint Petersburg, FL | 1.0 | 1.0 | 580 | $1,450 | $2.50 | 24d | 4 | 0.68mi |
| 1650 Prescott St S Saint Petersburg, FL | 3.0 | 1.0 | 960 | $2,100 | $2.19 | 4d | 1 | 0.68mi |
| 675 17th Ave S Unit 1 St. Petersburg, FL | 2.0 | 1.0 | 1000 | $1,950 | $1.95 | 24d | 1 | 0.69mi |
| 1428 12th St S Saint Petersburg, FL | 2.0 | 1.0 | 575 | $1,400 | $2.43 | 21d | 1 | 0.70mi |
| 1760 Queen St S Saint Petersburg, FL | 3.0 | 1.0 | 1004 | $2,000 | $1.99 | 4d | 1 | 0.70mi |
| 800 15th Ave S Unit 1a St. Petersburg, FL | 1.0 | 1.0 | 550 | $1,600 | $2.91 | 24d | 1 | 0.71mi |
| 2651 Bayside Dr S Saint Petersburg, FL | 1.0 | 1.0 | 747 | $1,750 | $2.34 | 4d | 1 | 0.74mi |
| 726 35th Ave S Saint Petersburg, FL | 2.0 | 1.0 | 972 | $2,020 | $2.08 | 24d | 2 | 0.74mi |
Listing history 8 events
-
2026-06-18days on market $185,000 Active 11 DOM
-
2026-06-17days on market $185,000 Active 10 DOM
-
2026-06-16days on market $185,000 Active 9 DOM
-
2026-06-15days on market $185,000 Active 8 DOM
-
2026-06-13days on market $185,000 Active 6 DOM
-
2026-06-09days on market $185,000 Active 2 DOM
-
2026-06-08remarks 699-char remark
-
2026-06-08$185,000 Active 1 DOM
ⓘ Source: listings_history table (triggers on properties + properties_extension) + one-shot
backfill from property_details.listing_events for pre-trigger history.
Tax reassessment forecast FL · Resets to sale price
- Current annual tax
- $2,900 · $242/mo
- Projected year-2 tax
- $2,900 · $242/mo
- Expected delta
- $0/yr ($0/mo · 0.0%)
ⓘ Screening estimate from a state-policy table — verify with the county assessor before closing.
Climate risk First Street
- Flood 8/10 Severe FEMA zone X (shaded) · 97% chance over 30 yrs
- Wildfire 1/10 Low
- Heat 10/10 Extreme 7 d/yr ≥106°F today · 24 d/yr by 30 yrs out
- Wind 10/10 Extreme 99% chance of damaging wind over 30 yrs
- Air quality 3/10 Moderate 3 unhealthy d/yr today · 4 by 30 yrs out
Nearby sold comps map
Loading sold comps map…
Walkable amenities ~0.75 mi
Loading nearby amenities…
Taxation est. · year 1
- Rental income
- $21,196
- − Mortgage interest
- −$10,363
- − Property taxes
- −$2,900
- − Insurance
- −$1,722
- − Repairs & maintenance
- −$1,696
- − Management
- −$1,696
- − Depreciation
- −$5,382
- Taxable loss
- −$2,563
- Est. tax savings @ 24.0%
- +$615
- After-tax cash flow
- $1,095/yr
For passive investors: Depreciation is non-cash, so a rental often shows a tax loss while cash-flowing — sheltering income. Rental losses are passive: they offset passive income freely, and up to $25,000/yr can offset ordinary (W-2) income if you actively participate and your MAGI is under $100k (phasing out to $0 by $150k); unused losses carry forward. On sale, claimed depreciation is recaptured at up to 25%, and gains may owe capital-gains tax (a 1031 exchange can defer both). Figures are a year-1 estimate at your 24.0% rate — not tax advice; consult a CPA.
Schools (NCES district)
- District
- Pinellas
- NCES district ID
- 1201560
- Math proficiency
- 51% ▼ -5.00%
- Reading proficiency
- 51% ▼ -3.00%
- Median HH income
- $46,270
- Composite
- 43.27/100
- National rank
- #3046
- State rank
- #31 of 73 in FL
Livability — St. Petersburg
No livability data for this city. (Only ~50 U.S. cities are tracked.)
Census & demographics
- Census place
- St. Petersburg, FL
- County
- Pinellas County · 939,478 people
- City population
- 249,151
- Metro
- Tampa-St. Petersburg-Clearwater, FL
- Population (ZIP)
- 27,939
- Household income
- $73,027
- Rent vs Own
- Severe rent burden
- 1386.0
Population outlook (Pinellas County) Hauer SSP2
- Today (2025)
- 1,027,532 people
- By 2030
- 1,063,586 · +3.5%
- By 2040
- 1,125,020 · +9.5%
- By 2050
- 1,168,637 · +13.7%
- By 2075
- 1,265,188 · +23.1%
- By 2100
- 1,260,357 · +22.7%
Race, ethnicity, and origin ACS 2023
- Neighborhood character
- Diverse neighborhood (Simpson 0.64)
- Race & ethnicity
- Black 44% White 41% Two or more races 10% Hispanic / Latino 5%
- Hispanic origin (detail)
- Puerto Rican 1%
- Common ancestry
- Lithuanian 2% Italian 1% Slovak 1%
- Foreign-born
- 9% · Canada, Dominican Republic
- Languages at home
- 92% English-only · Spanish 4% Other Indo-European 1% Russian/Polish/Slavic 1%
Political lean MEDSL · Pinellas
- 2024 margin
- Lean R (+5.2) · D 46.9% · R 52.1%
- 2008→2024 swing
- -13.5pp toward R · 2008: 8.3pp · 2024: -5.2pp
- All cycles
- 2024: R+5.2 2020: D+0.2 2016: R+1.1 2012: D+5.6 2008: D+8.3
Not yet ingested
- Civics
- —
Market trends
- HPI YoY
- ▼ -540.28%
- Current HPI
- 388.3086
- Rent YoY
- ▼ -0.13%
- Metro
- Tampa-St. Petersburg-Clearwater, FL
- State GDP YoY
- ▲ 3.28%
- F500 in state
- 36
Industry mix (Fortune 500 HQ in FL)
| Industry | F500 HQs | Revenue |
|---|---|---|
| Industrial Technology | 2 | $29B |
|
||
| Insurance | 2 | $17B |
|
||
| Retail | 1 | $60B |
|
||
| Technology Distribution | 1 | $58B |
|
||
| Homebuilding | 1 | $35B |
|
||
| Technology Manufacturing | 1 | $35B |
|
||
Price history
1 event — show timeline
- 2026-06-07 Listed $185,000 Stellar MLS as Distributed by MLS Grid
Property tax history
+19.6%/yrLatest (2025): $2,900 · +0.9% YoY. Source: county tax records.
Cash-flow waterfall
monthlySold comps — $/sqft
last 12 mo · ≤1 miLoading sold comps…