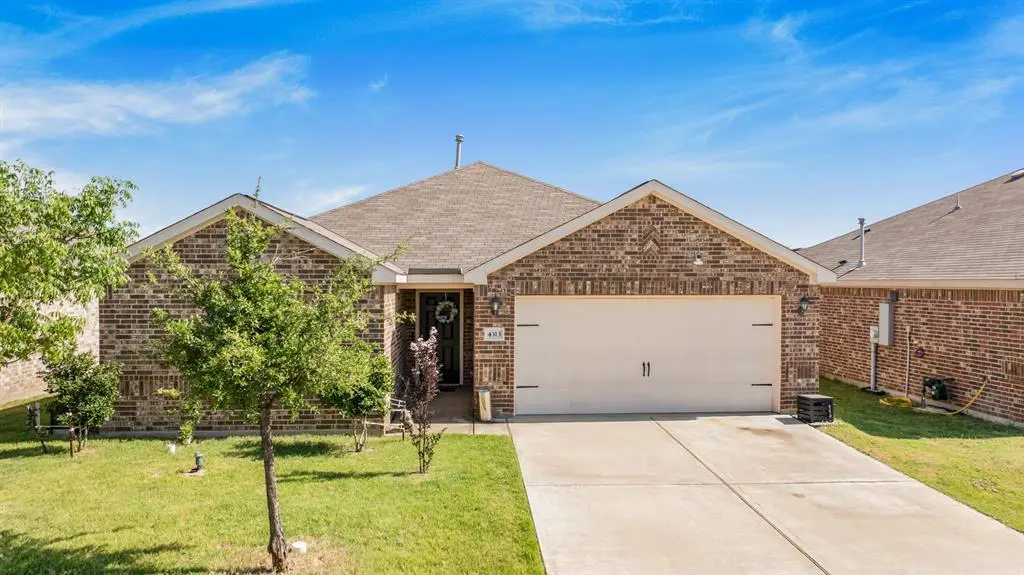
4313 Cat Tail Way · Forney, TX
Flood risk 1/10 · Minimal
- FEMA flood zone
- X (unshaded)
- Chance of flooding over 30 yrs
- 0.0%
- Est. flood insurance / yr
- $507 – $1,088
Fire risk 3/10 · Minor
- Est. fire insurance / yr
- $1,222 – $2,270
Heat risk 8/10 · Major
- Hot days now (above 110°F)
- 7 days/yr
- Hot days in 30 yrs
- 25 days/yr
Wind risk 6/10 · Moderate
- Chance of severe wind over 30 yrs
- 27.0%
Air-quality risk 2/10 · Minimal
- Unhealthy air days now
- 1 days/yr
- Unhealthy air days in 30 yrs
- 1 days/yr
Risk factors via First Street. Map © Google.
Why this score? — see what drove the D- grade
The composite is a weighted blend of 9 inputs, each scored 0–100. Each bar is that input's sub-score; the figure is the points it added to the 100-point composite (weight × sub-score).
- ARV discount +12.8/15.0
- Cash flow +7.8/30.0
- 1% rule +4.0/10.0
- Schools +4.0/10.0
- Livability +3.8/5.0
- Rent growth +2.9/5.0
- Condition / age +2.5/5.0
- DSCR +1.9/10.0
- Appreciation +0.0/10.0
$252,500
🖨 Deal sheet (PDF) 📄 Offer letter ✓ Due diligence
Listing remarks MLS
Assumable VA Loan at 3.375%! Welcome to this charming single-story home located in the highly sought-after Windmill Farms community in Forney, built in 2019. Thoughtfully designed with modern features and a functional open-concept layout, this home is ideal for families, first-time buyers, or anyone seeking the convenience of single-level living. Step inside to a spacious, light-filled living area that seamlessly connects to the dining space and kitchen perfect for everyday living and entertaining. The kitchen features ample cabinetry, a large pantry, and an inviting breakfast bar for casual dining. The primary suite offers a private retreat with a generously sized walk-in closet. Two additional bedrooms and a full bath provide plenty of space for family or guests. A dedicated study adds flexibility and can easily be used as a fourth bedroom or home office. Enjoy outdoor living in your own private backyard oasis, complete with a covered patio and fully fenced yard, ideal for relaxing or entertaining. Backing to a serene greenbelt with no rear neighbors, this home offers the perfect blend of comfort, privacy, and style. This home also features a whole-house water filtration system, adding comfort and convenience to everyday living. Energy efficiency is another major highlight, with a full solar system in place to help reduce reliance on the grid while offering dependable power during outages. The solar system is leased and will transfer to the new owner at closing. Conveniently located just minutes from the new HEB and Costco in Forney, providing easy access to shopping, dining, and everyday essentials. Schedule your showing today!
Key facts
- 6,011 sq ft lot
- 2 garage spots
- Built 2019
Neighborhood map
What this means for you Summary
Snapshot
- This is a 4-bed/2.0-bath single-family listed at $252k.
Deal economics
- At list price, monthly cash flow is $-282 ($-3k/yr) — negative.
- To cash-flow at today's rent, offer at most $203k (19.7% below list).
- To meet the 1% rule (rent ≥ 1% of price), the offer needs to be $227k (10.1% below list).
- Recommended offer: $203k (19.7% below list) — sets the bar for cash-flow.
- Cap rate 5.0% vs local median 4.1% in Forney — meaningfully above typical; check what's discounted (condition, days-on-market, listing class) to confirm the premium yield is real.
Location & tenants
- Location reads 76/100 on livability (#98 in TX, #3,339 nationally) — a middle-class / working-renter tenant base. Strengths: crime A+, employment A+, cost of living A+; Watch: amenities C-, commute F.
- Forney ISD (rural): math 41% / reading 44% proficiency, ranked #234 of 826 in TX (top 28%) — families likely to look elsewhere, expect single-tenant / working-renter base with shorter leases.
- Market conditions: Rents rising (+1.4%/yr); 2200 active listings in the ZIP; 40 comparable units currently listed for rent nearby; rentals at typical pace (median 25d on market — plan ~3-4 weeks tenant-placement turnaround); 45% of comp listings sitting > 30 days — soft ceiling on asking rent; solid renter incomes; 1,747 units permitted in Kaufman County in 2024 (180 in 5+ unit buildings).
Forward outlook
- Local home prices are declining (-3.0%/yr); year-one equity from $2k of loan paydown is wiped out by about $8k of value loss. Plan a longer hold.
- Kaufman County population projected at +43% by 2050 — long-run rental-demand tailwind backs the buy-and-hold thesis.
Negotiation context
- It's been on market 87 days — a 6% lower offer ($237k) is reasonable based on typical stale-listing flexibility.
- 3 sale attempts since 6y ago; this cycle's ask has dropped $2.52M (91%) from the opening price — seller is motivated, your offer sets the floor, not the list.
Risks & watch-outs
- Watch-outs: property tax is 2.9% of price.
- Climate carrying-cost: major wind risk, 27% chance of damaging wind over 30y; extreme-heat days projected 7→25/yr by 2055 (HVAC capex compounding) — expect insurance premiums to compound above CPI over the hold.
Questions for the listing agent
- What do current leases actually rent for vs. the listed asking? Can we see a recent rent roll and the last 12 months of T-12 income?
- It's been on market 87 days. Have you received any prior offers? Is the seller open to a 20% concession, seller financing, or rate buy-down credit?
- Property tax is high relative to price — has the assessment been appealed recently, and will the sale trigger a re-assessment?
- What does the HOA fee cover, when was the last increase, and are there any pending special assessments or reserve-fund shortfalls?
- Why hasn't it sold? Are there any deal-killer items the seller is aware of (foundation, flood, title, zoning, code violations)?
- Is there a deadline driving the sale (1031 exchange, divorce, estate, relocation)? That informs how much negotiation room exists.
- Schools are B-rated — typically a magnet for longer-tenancy family renters. What's the average tenant stay here, and is there a school-zone premium baked into asking?
- The area grade is low — what's the realistic commute time and amenity access for the typical tenant pool here? Any planned neighborhood developments (good or bad) we should know about?
- What's the average days-on-market for RENTAL listings here right now (not sales)? A rising rental-DOM trend means longer vacancies and softer asking-rent achievability than the comps imply.
- What's the recent tenant-quality profile in this submarket — average credit score on applications, eviction rate, late-payment / NSF rate, and stable-employment percentage? A property-management company in the area should have these aggregated.
- How much new for-sale + rental construction is in the pipeline within 1–3 miles? Heavy new supply typically softens prices + rents 12–24 months out; constrained supply supports both.
Investment metrics
- 1% rule
- 0.90% ✗
- Cap rate
- 4.95%
- Cash-on-cash
- -4.78%
- DSCR
- 0.79
- GRM
- 9.3
CMA / ARV
- ARV (median comp)
- $285,996
- List price
- $252,500
- Delta
- -11.71%
- Verdict
- UNDERPRICED
- Comps
- 20 within 1.0 mi
Show comp detail 12 sales within ~0.75 mi
| Address | Dist | Beds/Ba | Sqft | Sold | Price | $/sf | Match |
|---|---|---|---|---|---|---|---|
| 2110 Preston Trl | 0.27mi | 4/2.0 | 1,743 (+3%) | 4mo | $259,900 | $149 | 78 |
| 2115 Rose May Dr | 0.32mi | 4/2.0 | 1,743 (+3%) | 2mo | $255,000 | $146 | 78 |
| 2009 Brook Meadow Dr | 0.42mi | 3/2.0 (-1) | 1,714 (+2%) | 4mo | $205,000 | $120 | 70 |
| 1016 Halifax Ln | 0.61mi | 3/2.0 (-1) | 1,678 (-0%) | 0mo | $240,000 | $143 | 66 |
| 2142 Bluebell | 0.57mi | 4/2.0 | 1,790 (+6%) | 2mo | $250,000 | $140 | 61 |
| 2015 Natchez Dr | 0.47mi | 3/2.0 (-1) | 1,596 (-5%) | 4mo | $254,000 | $159 | 61 |
| 2016 Brook Meadow Dr | 0.39mi | 3/2.0 (-1) | 1,810 (+7%) | 4mo | $161,160 | $89 | 61 |
| 2010 Misty Hollow Ct | 0.62mi | 3/2.0 (-1) | 1,714 (+2%) | 3mo | $205,900 | $120 | 60 |
| 2114 Foxglove Ct | 0.47mi | 3/2.0 (-1) | 1,556 (-8%) | 1mo | $260,000 | $167 | 60 |
| 2114 Rose May Dr | 0.35mi | 3/2.0 (-1) | 1,930 (+14%) | 1mo | $245,000 | $127 | 54 |
| 3235 Clear Springs Dr | 0.43mi | 3/2.0 (-1) | 1,886 (+12%) | 3mo | $224,900 | $119 | 53 |
| 1108 Halifax Ln | 0.49mi | 3/2.0 (-1) | 1,502 (-11%) | 5mo | $220,000 | $146 | 50 |
Match score weights: distance 35% · size 25% · config 20% · recency 20%. Top-matched comps best support the ARV.
Projected returns pro-forma
-3.0% appreciation · 1.42% rent growth · sell at horizon
- IRR
- -26.4%
- Equity multiple
- 0.12×
- Total profit
- $-62,169
- Equity at exit
- $37,649
- IRR
- -31.1%
- Equity multiple
- -0.28×
- Total profit
- $-90,392
- Equity at exit
- $21,832
Cash invested: $70,700 (down + closing). Projections, not guarantees.
Landlord ↔ Tenant lean methodology
- Overall (STATE)
- 87 Strongly Landlord-Friendly
- State Texas
- 87 Strongly Landlord-Friendly · R+5
- County
- — inherits STATE
- City
- — inherits STATE
ZIP-level market 75126
- Rents YoY
- 1.4%
- Active inventory
- 2200
- Price-to-rent
- 9.3×
Monthly cashflow live
- Estimated rent
- $2,270 high interval (Pro) →
- Mortgage (P&I)
- −$1,324
- Tax from tax record
- −$604 /mo · $7,253/yr
- Insurance
- −$105
- HOA
- −$41
- Vacancy / Maint / Mgmt
- −$477
- Net cashflow
- $-282
Break-even live
Sensitivity live
| Price | -10% $-139 | -5% $-210 | +0% $-282 | +5% $-353 | +10% $-425 |
|---|---|---|---|---|---|
| Rent | -10% $-461 | -5% $-371 | +0% $-282 | +5% $-192 | +10% $-102 |
| Rate | -1.0pp $-154 | -0.5pp $-217 | base $-282 | +0.5pp $-347 | +1.0pp $-414 |
UW: 25.0% down · 7.5% · 30yr · 1.5% tax · 5.0% vac · 8.0% maint · 8.0% mgmt
Financing live
Cash to close
- Down payment
- $63,125
- Closing costs
- $7,575
- Reserves months
- —
- Total cash needed
- —
Loan-product check · same deal, 3 products live
Conventional
25% down · 7.5% · 30yr
- Down + closing
- —
- Monthly P&I
- —
- Monthly cashflow
- —
- DSCR
- —
- Eligible?
- —
Personal DTI + credit; lowest rate.
DSCR
20% down · 8.5% · 30yr
- Down + closing
- —
- Monthly P&I
- —
- Monthly cashflow
- —
- DSCR
- —
- Eligible?
- —
No personal income docs; deal must DSCR.
Hard money
10% down · 12.0% · 12mo
- Down + closing
- —
- Monthly P&I
- —
- Monthly cashflow
- —
- DSCR
- —
- Eligible?
- —
Short-term bridge; refi at stabilization.
Rent comps 40 comps
| Address | Beds | Baths | Sqft | Rent | $/sqft | DOM | Units | Dist |
|---|---|---|---|---|---|---|---|---|
| 4222 Calla Dr Forney, TX | 4.0 | 2.0 | 1981 | $1,950 | $0.98 | 18d | 1 | 0.13mi |
| 4432 Thalia Way Forney, TX | 3.0 | 2.0 | 1816 | $2,100 | $1.16 | 44d | 1 | 0.21mi |
| 3010 Sweetwater Trl Forney, TX | 3.0 | 2.0 | 2200 | $2,200 | $1.00 | 44d | 1 | 0.23mi |
| 4254 Calla Dr Forney, TX | 4.0 | 2.0 | 1983 | $2,400 | $1.21 | 44d | 1 | 0.23mi |
| 3111 Flint Rock Dr Forney, TX | 4.0 | 2.0 | 2185 | $2,295 | $1.05 | 8d | 1 | 0.27mi |
| 3018 Sweetwater Trl Forney, TX | 3.0 | 2.0 | 1532 | $1,950 | $1.27 | 7d | 1 | 0.27mi |
| 3125 Granite Rock Trl Forney, TX | 4.0 | 2.0 | 2090 | $2,350 | $1.12 | 19d | 1 | 0.29mi |
| 3005 Guadalupe Dr Forney, TX | 4.0 | 2.0 | 2169 | $2,195 | $1.01 | 44d | 1 | 0.34mi |
| 2026 Gardenia Dr Forney, TX | 4.0 | 2.5 | 2160 | $2,315 | $1.07 | 44d | 1 | 0.36mi |
| 2015 Gardenia Dr Forney, TX | 3.0 | 2.0 | 1598 | $1,850 | $1.16 | 21d | 1 | 0.37mi |
| 3100 Marble Falls Dr Forney, TX | 4.0 | 2.0 | 2124 | $2,195 | $1.03 | 44d | 1 | 0.37mi |
| 2029 Cone Flower Dr Forney, TX | 3.0 | 2.0 | 1604 | $1,816 | $1.13 | 8d | 1 | 0.38mi |
| 3111 Marble Falls Dr Forney, TX | 3.0 | 2.0 | 1943 | $2,145 | $1.10 | 44d | 1 | 0.39mi |
| 2006 Brook Meadow Dr Forney, TX | 4.0 | 2.5 | 1912 | $2,050 | $1.07 | 44d | 1 | 0.39mi |
| 2004 Chisolm Trl Forney, TX | 3.0 | 2.0 | 1708 | $2,150 | $1.26 | 19d | 1 | 0.41mi |
| 2121 Juniper Dr Forney, TX | 4.0 | 2.0 | 1935 | $2,249 | $1.16 | 3d | 1 | 0.42mi |
| 2009 Brook Meadow Dr Forney, TX | 3.0 | 2.0 | 1714 | $1,800 | $1.05 | 44d | 1 | 0.42mi |
| 2000 Natchez Dr Forney, TX | 3.0 | 2.0 | 1551 | $1,819 | $1.17 | 44d | 1 | 0.44mi |
| 1108 Halifax Ln Forney, TX | 3.0 | 2.0 | 1502 | $1,835 | $1.22 | 8d | 1 | 0.49mi |
| 1108 Halifax Ln Forney, TX | 3.0 | 2.0 | 1502 | $1,835 | $1.22 | 18d | 1 | 0.49mi |
| 2214 Sumac Dr Forney, TX | 4.0 | 2.5 | 2055 | $2,070 | $1.01 | 44d | 1 | 0.49mi |
| 2101 Wildwood Dr Forney, TX | 3.0 | 2.0 | 1558 | $1,900 | $1.22 | 44d | 1 | 0.51mi |
| 4620 Elderberry St Forney, TX | 3.0 | 2.0 | 1856 | $1,850 | $1.00 | 21d | 1 | 0.54mi |
| 2027 Fair Crest Trl Forney, TX | 4.0 | 2.0 | 2108 | $1,975 | $0.94 | 44d | 1 | 0.58mi |
| 3039 Boran Dr Forney, TX | 3.0 | 2.0 | 1690 | $2,000 | $1.18 | 44d | 1 | 0.60mi |
| 5015 Royal Springs Dr Forney, TX | 3.0 | 2.5 | 2066 | $2,125 | $1.03 | 44d | 1 | 0.62mi |
| 3007 Boran Dr Forney, TX | 3.0 | 2.0 | 1650 | $2,200 | $1.33 | 25d | 1 | 0.62mi |
| 2106 Bluebell Forney, TX | 3.0 | 2.0 | 1541 | $1,950 | $1.27 | 6d | 1 | 0.63mi |
| 3016 Boran Dr Forney, TX | 3.0 | 2.0 | 1681 | $2,100 | $1.25 | 44d | 1 | 0.63mi |
| 10900 Reeder Ln Forney, TX | 3.0 | 1.5 | 1186 | $3,200 | $2.70 | 23d | 1 | 0.65mi |
| 4315 Elderberry St Forney, TX | 4.0 | 2.5 | 2160 | $2,950 | $1.37 | 44d | 1 | 0.65mi |
| 8050 Privet St Forney, TX | 4.0 | 2.0 | 2045 | $2,100 | $1.03 | 25d | 1 | 0.67mi |
| 3017 Villegas Way Forney, TX | 4.0 | 2.5 | 2153 | $2,150 | $1.00 | 44d | 1 | 0.68mi |
| 3095 Barzona Rd Forney, TX | 4.0 | 2.0 | 1683 | $1,850 | $1.10 | 18d | 1 | 0.69mi |
| 3023 Villegas Way Forney, TX | 4.0 | 2.0 | 1683 | $1,875 | $1.11 | 25d | 1 | 0.69mi |
| 3013 McCoy Rd Forney, TX | 3.0 | 2.0 | 1643 | $1,895 | $1.15 | 25d | 1 | 0.70mi |
| 1300 N Gateway Blvd Forney, TX | 1.0–3.0 | 1.0–2.0 | 1039 | $2,492 | $2.40 | 0d | 22 | 0.71mi |
| 9105 Switchgrass Ln Forney, TX | 3.0 | 2.0 | 1962 | $2,800 | $1.43 | 11d | 1 | 0.71mi |
| 1112 Alexandria Dr Forney, TX | 3.0 | 2.0 | 1477 | $1,880 | $1.27 | 0d | 1 | 0.72mi |
| 1019 Chelsea Ln Forney, TX | 4.0 | 2.0 | 1840 | $2,205 | $1.20 | 0d | 1 | 0.73mi |
HOA detail
- Monthly dues
- $41 · $492/yr
- Likely covers
- water
Listing history 23 events
-
2026-06-21days on market $252,500 Active 87 DOM
-
2026-06-18days on market $252,500 Active 84 DOM
-
2026-06-17days on market $252,500 Active 83 DOM
-
2026-06-16days on market $252,500 Active 82 DOM
-
2026-06-16price $252,500 Active 81 DOM
-
2026-06-15days on market $267,900 Active 81 DOM
-
2026-06-13days on market $267,900 Active 79 DOM
-
2026-06-13days on market $267,900 Active 78 DOM
-
2026-06-09days on market $267,900 Active 75 DOM
-
2026-06-08days on market $267,900 Active 74 DOM
-
2026-06-07days on market $267,900 Active 73 DOM
-
2026-06-04days on market $267,900 Active 70 DOM
-
2026-06-03days on market $267,900 Active 69 DOM
-
2026-06-02days on market $267,900 Active 68 DOM
-
2026-06-01days on market $267,900 Active 67 DOM
-
2026-05-31days on market $267,900 Active 66 DOM
-
2026-03-27price $267,900 1683-char remark
Show marketing remark (1683 chars)
Assumable VA Loan at 3.375%! Welcome to this charming single-story home located in the highly sought-after Windmill Farms community in Forney, built in 2019. Thoughtfully designed with modern features and a functional open-concept layout, this home is ideal for families, first-time buyers, or anyone seeking the convenience of single-level living. Step inside to a spacious, light-filled living area that seamlessly connects to the dining space and kitchen perfect for everyday living and entertaining. The kitchen features ample cabinetry, a large pantry, and an inviting breakfast bar for casual dining. The primary suite offers a private retreat with a generously sized walk-in closet. Two additional bedrooms and a full bath provide plenty of space for family or guests. A dedicated study adds flexibility and can easily be used as a fourth bedroom or home office. Enjoy outdoor living in your own private backyard oasis, complete with a covered patio and fully fenced yard, ideal for relaxing or entertaining. Backing to a serene greenbelt with no rear neighbors, this home offers the perfect blend of comfort, privacy, and style. This home also features a whole-house water filtration system, adding comfort and convenience to everyday living. Energy efficiency is another major highlight, with a full solar system in place to help reduce reliance on the grid while offering dependable power during outages. The solar system is leased and will transfer to the new owner at closing. Conveniently located just minutes from the new HEB and Costco in Forney, providing easy access to shopping, dining, and everyday essentials. Schedule your showing today!
-
2026-03-26$2,767,900 Active 1683-char remark
Show marketing remark (1683 chars)
Assumable VA Loan at 3.375%! Welcome to this charming single-story home located in the highly sought-after Windmill Farms community in Forney, built in 2019. Thoughtfully designed with modern features and a functional open-concept layout, this home is ideal for families, first-time buyers, or anyone seeking the convenience of single-level living. Step inside to a spacious, light-filled living area that seamlessly connects to the dining space and kitchen perfect for everyday living and entertaining. The kitchen features ample cabinetry, a large pantry, and an inviting breakfast bar for casual dining. The primary suite offers a private retreat with a generously sized walk-in closet. Two additional bedrooms and a full bath provide plenty of space for family or guests. A dedicated study adds flexibility and can easily be used as a fourth bedroom or home office. Enjoy outdoor living in your own private backyard oasis, complete with a covered patio and fully fenced yard, ideal for relaxing or entertaining. Backing to a serene greenbelt with no rear neighbors, this home offers the perfect blend of comfort, privacy, and style. This home also features a whole-house water filtration system, adding comfort and convenience to everyday living. Energy efficiency is another major highlight, with a full solar system in place to help reduce reliance on the grid while offering dependable power during outages. The solar system is leased and will transfer to the new owner at closing. Conveniently located just minutes from the new HEB and Costco in Forney, providing easy access to shopping, dining, and everyday essentials. Schedule your showing today!
-
2025-10-07price $270,000
-
2025-08-12$280,000 Active
-
2020-03-27soldstatus Sold
-
2020-02-17status Pending
-
2020-02-13$237,900 Active
ⓘ Source: listings_history table (triggers on properties + properties_extension) + one-shot
backfill from property_details.listing_events for pre-trigger history.
Tax reassessment forecast TX · Resets to sale price
- Current annual tax
- $7,253 · $604/mo
- Projected year-2 tax
- $7,253 · $604/mo
- Expected delta
- $0/yr ($0/mo · 0.0%)
ⓘ Screening estimate from a state-policy table — verify with the county assessor before closing.
Climate risk First Street
- Flood 1/10 Low FEMA zone X (unshaded) · 0% chance over 30 yrs
- Wildfire 3/10 Moderate
- Heat 8/10 Severe 7 d/yr ≥110°F today · 25 d/yr by 30 yrs out
- Wind 6/10 Major 27% chance of damaging wind over 30 yrs
- Air quality 2/10 Low 1 unhealthy d/yr today · 1 by 30 yrs out
Nearby sold comps map
Loading sold comps map…
Walkable amenities ~0.75 mi
Loading nearby amenities…
Taxation est. · year 1
- Rental income
- $27,237
- − Mortgage interest
- −$14,144
- − Property taxes
- −$7,253
- − Insurance
- −$1,262
- − Repairs & maintenance
- −$2,179
- − Management
- −$2,179
- − HOA
- −$492
- − Depreciation
- −$7,345
- Taxable loss
- −$7,617
- Est. tax savings @ 24.0%
- +$1,828
- After-tax cash flow
- $-1,551/yr
For passive investors: Depreciation is non-cash, so a rental often shows a tax loss while cash-flowing — sheltering income. Rental losses are passive: they offset passive income freely, and up to $25,000/yr can offset ordinary (W-2) income if you actively participate and your MAGI is under $100k (phasing out to $0 by $150k); unused losses carry forward. On sale, claimed depreciation is recaptured at up to 25%, and gains may owe capital-gains tax (a 1031 exchange can defer both). Figures are a year-1 estimate at your 24.0% rate — not tax advice; consult a CPA.
Schools (NCES district)
- District
- Forney ISD
- NCES district ID
- 4819560
- Math proficiency
- 41% ▼ -20.00%
- Reading proficiency
- 44% ▼ -12.00%
- Median HH income
- $86,679
- Composite
- 40.07/100
- National rank
- #3812
- State rank
- #234 of 826 in TX
Livability — Forney
- Score
- 76/100
- State rank
- #98
- US rank
- #3339
Category grades
Schools grade is shown separately in the Schools card above.
Census & demographics
- County
- Kaufman County · 122,338 people
- City population
- 84,799
- Metro
- Dallas-Fort Worth-Arlington, TX
- Population (ZIP)
- 84,799
- Household income
- $103,673
- Rent vs Own
- Severe rent burden
- 1306.0
Population outlook (Kaufman County) Hauer SSP2
- Today (2025)
- 138,716 people
- By 2030
- 150,815 · +8.7%
- By 2040
- 174,877 · +26.1%
- By 2050
- 198,020 · +42.8%
- By 2075
- 251,908 · +81.6%
- By 2100
- 285,325 · +105.7%
Race, ethnicity, and origin ACS 2023
- Neighborhood character
- Diverse neighborhood (Simpson 0.68)
- Race & ethnicity
- White 45% Black 25% Hispanic / Latino 23% Two or more races 14% Asian 3%
- Hispanic origin (detail)
- Mexican 18% Puerto Rican 1%
- Common ancestry
- Italian 2% Slovak 1% Portuguese 1%
- Foreign-born
- 12% · Canada, Vietnam
- Languages at home
- 79% English-only · Spanish 14% Arabic 1% Vietnamese 1%
Political lean MEDSL · Kaufman
- 2024 margin
- Strong R (+27.9) · D 35.6% · R 63.5%
- 2008→2024 swing
- +7.9pp toward D · 2008: -35.8pp · 2024: -27.9pp
- All cycles
- 2024: R+27.9 2020: R+33.9 2016: R+47.0 2012: R+44.4 2008: R+35.8
Not yet ingested
- Civics
- —
Market trends
- HPI YoY
- ▼ -102.93%
- Current HPI
- 148.5749
- Rent YoY
- ▲ 1.42%
- Metro
- Dallas-Fort Worth-Arlington, TX
- State GDP YoY
- ▲ 3.95%
- F500 in state
- 110
Industry mix (Fortune 500 HQ in TX)
| Industry | F500 HQs | Revenue |
|---|---|---|
| Energy | 16 | $1,198B |
|
||
| Technology | 5 | $198B |
|
||
| Engineering / Construction | 4 | $72B |
|
||
| Energy Services | 3 | $60B |
|
||
| Utilities | 3 | $41B |
|
||
| Healthcare | 2 | $330B |
|
||
Price history
+12.6% since first listed7 events — show timeline
- 2026-03-27 Price Changed $267,900 NTREIS
- 2026-03-26 Listed $2,767,900 NTREIS
- 2025-10-07 Price Changed $270,000 NTREIS
- 2025-08-12 Listed $280,000 NTREIS
- 2020-03-27 Sold (MLS) — NTREIS
- 2020-02-17 Pending — NTREIS
- 2020-02-13 Listed $237,900 NTREIS
Property tax history
+4.2%/yrLatest (2025): $7,253 · -3.7% YoY. Source: county tax records.
Cash-flow waterfall
monthlySold comps — $/sqft
last 12 mo · ≤1 miLoading sold comps…