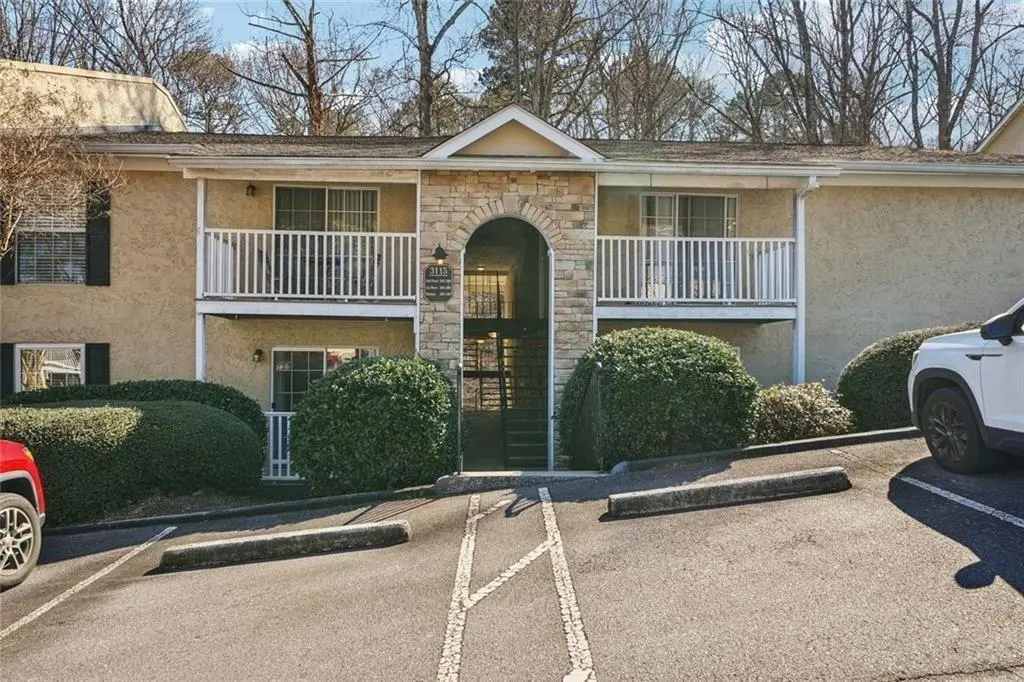
3115 Seven Pines Ct #207 · Vinings, GA
Flood risk 5/10 · Moderate
- FEMA flood zone
- X (unshaded)
- Chance of flooding over 30 yrs
- 0.24%
- Est. flood insurance / yr
- $507 – $1,088
Fire risk 1/10 · Minimal
- Est. fire insurance / yr
- $963 – $1,789
Heat risk 6/10 · Moderate
- Hot days now (above 104°F)
- 7 days/yr
- Hot days in 30 yrs
- 19 days/yr
Wind risk 5/10 · Moderate
- Chance of severe wind over 30 yrs
- 25.0%
Air-quality risk 4/10 · Minor
- Unhealthy air days now
- 6 days/yr
- Unhealthy air days in 30 yrs
- 7 days/yr
Risk factors via First Street. Map © Google.
Why this score? — see what drove the D grade
The composite is a weighted blend of 9 inputs, each scored 0–100. Each bar is that input's sub-score; the figure is the points it added to the 100-point composite (weight × sub-score).
- ARV discount +11.9/15.0
- Cash flow +9.2/30.0
- 1% rule +4.6/10.0
- Schools +3.8/10.0
- Condition / age +3.8/5.0
- Livability +3.6/5.0
- DSCR +2.6/10.0
- Rent growth +2.5/5.0
- Appreciation +0.0/10.0
$158,000
🖨 Deal sheet 📄 Offer letter ✓ Due diligence
Listing remarks MLS
Move-in ready condo in the heart of Vinings now available! Nestled in an unbeatable location just minutes from the Battery and Truist park, Vinings Jubilee, and Silver Comet trail. This one bedroom condo offers a spacious open-concept living area, a walk-in closet, and private patio. The community features convenient amenities including a swimming pool, tennis courts, and dog park. With easy access to both I-75 and I-285, this is an ideal opportunity for comfortable living in one of the area's most sought-after locations.
Key facts
- Move-in ready
- Dog park
- Swimming pool
Tags
Neighborhood map
What this means for you Summary
Snapshot
- This is a 1-bed/1.0-bath condo listed at $158k. Condition is rated good.
Deal economics
- At list price, monthly cash flow is $-119 ($-1k/yr) — negative.
- To cash-flow at today's rent, offer at most $141k (10.9% below list).
- To meet the 1% rule (rent ≥ 1% of price), the offer needs to be $152k (4.0% below list).
- Recommended offer: $139k (12.0% below list) — sets the bar for market timing.
- Cap rate 5.4% vs local median 2.3% in Vinings — top-decile yield for the area; either an underpriced asset or a hidden risk that comps aren't pricing in. Stress-test before assuming the spread holds.
Location & tenants
- Location reads 71/100 on livability (#78 in GA) — a middle-class / working-renter tenant base. Strengths: crime A+, employment A+, health & safety A-; Watch: amenities D, commute F, cost of living F.
- Cobb County (suburban): math 39% / reading 45% proficiency, ranked #25 of 174 in GA (top 14%) — families likely to look elsewhere, expect single-tenant / working-renter base with shorter leases.
- Market conditions: Rents flat; 263 active listings in the ZIP; 24 comparable units currently listed for rent nearby; rentals leasing fast (median 2d on market — plan ~1-2 weeks tenant-placement turnaround); solid renter incomes; 1,625 units permitted in Cobb County in 2024 (389 in 5+ unit buildings).
- This rent is only 18% of the median local income ($103k/yr) — well below the 30% rent-burden line; pricing power to push rent on renewal without tenant pushback.
Forward outlook
- Local home prices are declining (-3.0%/yr); year-one equity from $1k of loan paydown is wiped out by about $5k of value loss. Plan a longer hold.
- Cobb County population projected at +33% by 2050 — long-run rental-demand tailwind backs the buy-and-hold thesis.
Negotiation context
- It's been on market 126 days — a 12% lower offer ($139k) is reasonable based on typical stale-listing flexibility.
- 6 sale attempts since 8y ago; this cycle's ask has dropped $10k (6%) from the opening price — seller is motivated, your offer sets the floor, not the list.
Risks & watch-outs
- Climate carrying-cost: moderate flood risk; moderate wind risk, 25% chance of damaging wind over 30y; extreme-heat days projected 7→19/yr by 2055 (HVAC capex compounding) — expect insurance premiums to compound above CPI over the hold.
Questions for the listing agent
- What do current leases actually rent for vs. the listed asking? Can we see a recent rent roll and the last 12 months of T-12 income?
- It's been on market 126 days. Have you received any prior offers? Is the seller open to a 12% concession, seller financing, or rate buy-down credit?
- Built in 1975 — when were the roof, HVAC, electrical panel, plumbing, and water heater last replaced?
- What does the HOA fee cover, when was the last increase, and are there any pending special assessments or reserve-fund shortfalls?
- Any open or pending special assessments — roof, HVAC, plumbing, elevator, façade? What's the per-unit balance and payoff schedule, and is the seller paying it off at close or rolling it to the buyer?
- Why hasn't it sold? Are there any deal-killer items the seller is aware of (foundation, flood, title, zoning, code violations)?
- Is there a deadline driving the sale (1031 exchange, divorce, estate, relocation)? That informs how much negotiation room exists.
- The area grade is low — what's the realistic commute time and amenity access for the typical tenant pool here? Any planned neighborhood developments (good or bad) we should know about?
- What's the average days-on-market for RENTAL listings here right now (not sales)? A rising rental-DOM trend means longer vacancies and softer asking-rent achievability than the comps imply.
- What's the recent tenant-quality profile in this submarket — average credit score on applications, eviction rate, late-payment / NSF rate, and stable-employment percentage? A property-management company in the area should have these aggregated.
- How much new apartment / multifamily construction is in the pipeline within 1–3 miles? Heavy new supply (>2% of stock underway) typically softens rents 12–24 months out; light construction supports rent growth.
Investment metrics
- 1% rule
- 0.96% ✗
- Cap rate
- 5.39%
- Cash-on-cash
- -3.22%
- DSCR
- 0.86
- GRM
- 8.7
CMA / ARV
- ARV (median comp)
- $175,099
- List price
- $158,000
- Delta
- -9.77%
- Verdict
- FAIR
- Comps
- 20 within 1.0 mi
Projected returns pro-forma
-3.0% appreciation · 0.05% rent growth · sell at horizon
- IRR
- -25.7%
- Equity multiple
- 0.16×
- Total profit
- $-37,366
- Equity at exit
- $23,558
- IRR
- -40.0%
- Equity multiple
- -0.32×
- Total profit
- $-58,525
- Equity at exit
- $13,661
Cash invested: $44,240 (down + closing). Projections, not guarantees.
Landlord ↔ Tenant lean methodology
- Overall (STATE)
- 90 Strongly Landlord-Friendly
- State Georgia
- 90 Strongly Landlord-Friendly · R+3
- County
- — inherits STATE
- City
- — inherits STATE
ZIP-level market 30339
- Rents YoY
- 0.1%
- Active inventory
- 263
- Price-to-rent
- 8.7×
Monthly cashflow live
- Estimated rent
- $1,517 high interval (Pro) →
- Mortgage (P&I)
- −$829
- Tax est. 1.5%
- −$198 /mo · $2,370/yr
- Insurance
- −$66
- HOA
- −$225
- Vacancy / Maint / Mgmt
- −$319
- Net cashflow
- $-119
Break-even live
UW: 25.0% down · 7.5% · 30yr · 1.5% tax · 5.0% vac · 8.0% maint · 8.0% mgmt
Financing live
Cash to close
- Down payment
- $39,500
- Closing costs
- $4,740
- Reserves months
- —
- Total cash needed
- —
Loan-product check · same deal, 3 products live
Conventional
25% down · 7.5% · 30yr
- Down + closing
- —
- Monthly P&I
- —
- Monthly cashflow
- —
- DSCR
- —
- Eligible?
- —
Personal DTI + credit; lowest rate.
DSCR
20% down · 8.5% · 30yr
- Down + closing
- —
- Monthly P&I
- —
- Monthly cashflow
- —
- DSCR
- —
- Eligible?
- —
No personal income docs; deal must DSCR.
Hard money
10% down · 12.0% · 12mo
- Down + closing
- —
- Monthly P&I
- —
- Monthly cashflow
- —
- DSCR
- —
- Eligible?
- —
Short-term bridge; refi at stabilization.
Rent comps 24 comps
| Address | Beds | Baths | Sqft | Rent | $/sqft | DOM | Units | Dist |
|---|---|---|---|---|---|---|---|---|
| 3160 7 Pines Ct #305 Atlanta, GA | 1.0 | 1.0 | 625 | $1,275 | $2.04 | 43d | 1 | 0.09mi |
| 100 Pinhurst Dr Atlanta, GA | 1.0–3.0 | 1.0–2.0 | 1060 | $1,131 | $1.07 | 2d | 54 | 0.22mi |
| 50 Adams Lake Blvd SE Atlanta, GA | 1.0–3.0 | 1.0–2.0 | 1109 | $1,289 | $1.16 | 1d | 44 | 0.26mi |
| 3158 Stillhouse Creek Dr Atlanta, GA | 3.0 | 1.0–2.0 | 1188 | $2,068 | $1.74 | 1d | 18 | 0.42mi |
| 2735 Paces Ferry Rd SE Atlanta, GA | 3.0 | 1.0–2.0 | 1111 | $2,556 | $2.30 | 1d | 18 | 0.43mi |
| 2945 Cumberland Mall Atlanta, GA | 3.0 | 1.0–2.0 | 995 | $2,073 | $2.08 | 1d | 54 | 0.48mi |
| 3205 Cumberland Blvd SE Atlanta, GA | 1.0–3.0 | 1.0–2.0 | 1068 | $1,640 | $1.53 | 1d | 17 | 0.52mi |
| 3375 Spring Hill Pkwy SE Smyrna, GA | 3.0 | 1.0–2.0 | 1007 | $1,690 | $1.68 | 1d | 45 | 0.68mi |
| 3270 Walton Riverwood Ln SE Atlanta, GA | 1.0–3.0 | 1.0–2.0 | 1064 | $1,614 | $1.52 | 2d | 12 | 0.69mi |
| 800 Galleria Pkwy SE Atlanta, GA | 3.0 | 1.0–2.0 | 1128 | $2,404 | $2.13 | 1d | 29 | 0.72mi |
| 2800 Paces Ferry Rd SE Atlanta, GA | 1.0–3.0 | 1.0–2.0 | 1034 | $1,189 | $1.15 | 1d | 44 | 0.78mi |
| 3290 Cobb Galleria Pkwy Atlanta, GA | 3.0 | 1.0–3.0 | 1103 | $2,123 | $1.92 | 2d | 31 | 0.95mi |
| 3200 Post Woods Dr Atlanta, GA | 1.0–3.0 | 1.0–2.0 | 1014 | $1,141 | $1.13 | 1d | 37 | 0.96mi |
| 900 Battery Ave SE Atlanta, GA | 1.0–3.0 | 1.0–3.0 | 1073 | $1,783 | $1.66 | 1d | 61 | 1.11mi |
| 4403 Northside Pkwy NW Atlanta, GA | 3.0 | 1.0–2.0 | 1100 | $2,030 | $1.85 | 1d | 31 | 1.17mi |
| 2801 Windy Ridge Pkwy SE Atlanta, GA | 1.0–3.0 | 1.0–2.0 | 1077 | $1,630 | $1.51 | 1d | 30 | 1.18mi |
| 3300 Overton Park Dr SE Atlanta, GA | 3.0 | 1.0–2.5 | 1054 | $2,123 | $2.01 | 1d | 34 | 1.18mi |
| 5000 S Lincoln Trace Ave SE Smyrna, GA | 1.0–3.0 | 1.0–2.5 | 1075 | $1,025 | $0.95 | 1d | 6 | 1.27mi |
| 2101 Paces Ferry Rd SE Smyrna, GA | 1.0–2.0 | 1.0–2.0 | 976 | $1,200 | $1.23 | 1d | 23 | 1.32mi |
| 5900 Suffex Green Ln NW Vinings, GA | 1.0–2.0 | 1.0–2.5 | 921 | $1,151 | $1.25 | 1d | 34 | 1.39mi |
| 3385 Atlanta Rd SE Smyrna, GA | 3.0 | 1.0–2.0 | 1074 | $1,316 | $1.22 | 1d | 25 | 1.44mi |
| 2855 Crescent Pkwy Atlanta, GA | 3.0 | 1.0–2.0 | 1027 | $2,248 | $2.19 | 2d | 10 | 1.45mi |
| 2875 Crescent Pkwy Atlanta, GA | 3.0 | 1.0–2.0 | 1114 | $2,136 | $1.92 | 1d | 26 | 1.48mi |
| 2395 Herodian Way SE Smyrna, GA | 3.0 | 1.0–2.0 | 1071 | $2,231 | $2.08 | 1d | 17 | 1.49mi |
HOA detail condo
- Monthly dues
- $225 · $2,700/yr
- Likely covers
- pool
- Assessments
- None detected in remarks — confirm with the listing agent.
Listing history 29 events
-
2026-06-18days on market $158,000 Active 126 DOM
-
2026-06-17days on market $158,000 Active 125 DOM
-
2026-06-16days on market $158,000 Active 124 DOM
-
2026-06-15days on market $158,000 Active 123 DOM
-
2026-06-13days on market $158,000 Active 121 DOM
-
2026-06-13days on market $158,000 Active 120 DOM
-
2026-06-09days on market $158,000 Active 117 DOM
-
2026-06-08days on market $158,000 Active 116 DOM
-
2026-06-07pricedays on market $158,000 Active 115 DOM
-
2026-06-04days on market $168,000 Active 112 DOM
-
2026-06-03days on market $168,000 Active 111 DOM
-
2026-06-02days on market $168,000 Active 110 DOM
-
2026-06-01days on market $168,000 Active 109 DOM
-
2026-05-31days on market $168,000 Active 108 DOM
-
2026-02-12$168,000 New 527-char remark
Show marketing remark (533 chars)
Move-in ready condo in the heart of Vinings now available! Nestled in an unbeatable location just minutes from the Battery and Truist park, Vinings Jubilee, and Silver Comet trail. This one bedroom condo offers a spacious open-concept living area, a walk-in closet, and private patio. The community features convenient amenities including a swimming pool, tennis courts, and dog park. With easy access to both I-75 and I-285, this is an ideal opportunity for comfortable living in one of the area’s most sought-after locations.
-
2026-02-12$168,000 Active 533-char remark
Show marketing remark (533 chars)
Move-in ready condo in the heart of Vinings now available! Nestled in an unbeatable location just minutes from the Battery and Truist park, Vinings Jubilee, and Silver Comet trail. This one bedroom condo offers a spacious open-concept living area, a walk-in closet, and private patio. The community features convenient amenities including a swimming pool, tennis courts, and dog park. With easy access to both I-75 and I-285, this is an ideal opportunity for comfortable living in one of the area’s most sought-after locations.
-
2022-03-31soldstatus $160,000 Closed
-
2022-03-31soldstatus $160,000 Sold
-
2022-03-22historical Active Under Contract
-
2022-03-22status Under Contract
-
2022-03-15$155,900 Active
-
2022-03-15$155,900 New
-
2018-02-22soldstatus $110,000 Sold
-
2018-02-22soldstatus $110,000 Sold
-
2018-01-28status Pending
-
2018-01-24historical Contingent - Due Diligence
-
2018-01-22status Under Contract
-
2018-01-17$110,000 Active
-
2018-01-17$110,000 New
ⓘ Source: listings_history table (triggers on properties + properties_extension) + one-shot
backfill from property_details.listing_events for pre-trigger history.
Climate risk First Street
- Flood 5/10 Major FEMA zone X (unshaded) · 24% chance over 30 yrs
- Wildfire 1/10 Low
- Heat 6/10 Major 7 d/yr ≥104°F today · 19 d/yr by 30 yrs out
- Wind 5/10 Major 25% chance of damaging wind over 30 yrs
- Air quality 4/10 Moderate 6 unhealthy d/yr today · 7 by 30 yrs out
Nearby sold comps map
Loading sold comps map…
Walkable amenities ~0.75 mi
Loading nearby amenities…
Taxation est. · year 1
- Rental income
- $18,203
- − Mortgage interest
- −$8,850
- − Property taxes
- −$2,370
- − Insurance
- −$790
- − Repairs & maintenance
- −$1,456
- − Management
- −$1,456
- − HOA
- −$2,700
- − Depreciation
- −$4,596
- Taxable loss
- −$4,017
- Est. tax savings @ 24.0%
- +$964
- After-tax cash flow
- $-459/yr
For passive investors: Depreciation is non-cash, so a rental often shows a tax loss while cash-flowing — sheltering income. Rental losses are passive: they offset passive income freely, and up to $25,000/yr can offset ordinary (W-2) income if you actively participate and your MAGI is under $100k (phasing out to $0 by $150k); unused losses carry forward. On sale, claimed depreciation is recaptured at up to 25%, and gains may owe capital-gains tax (a 1031 exchange can defer both). Figures are a year-1 estimate at your 24.0% rate — not tax advice; consult a CPA.
Condition & rehab AI · 1 photo
This move-in ready condo is in good condition with no major repairs needed. It offers a good return on investment with potential for both resale and rental value through minor updates and improvements.
Value-add opportunities
- Both Painting the exterior and interior walls — Fresh paint can enhance the home's curb appeal and interior aesthetics.
- Both Updating the flooring — New flooring can improve the home's appearance and increase its value.
- Both Upgrading the kitchen appliances — Modern appliances can attract more buyers and renters.
- Both Installing smart home features — Smart home features can increase the home's appeal and marketability.
- Both Landscaping improvements — Enhanced landscaping can boost curb appeal and attract more potential buyers and renters.
Renovation cost estimate screening
Value-add ROI direction
- Both Painting the exterior and interior walls — Fresh paint can enhance the home's curb appeal and interior aesthetics. ↑
- Both Updating the flooring — New flooring can improve the home's appearance and increase its value. ↑
- Both Upgrading the kitchen appliances — Modern appliances can attract more buyers and renters. ↑
- Both Installing smart home features — Smart home features can increase the home's appeal and marketability. ↑
- Both Landscaping improvements — Enhanced landscaping can boost curb appeal and attract more potential buyers and renters. ↑
ⓘ Cost ranges are severity-bucket heuristics (US national rule-of-thumb). Get contractor quotes + a written scope before underwriting a rehab budget.
Schools (NCES district)
- District
- Cobb County
- NCES district ID
- 1301290
- Math proficiency
- 39% ▼ -15.00%
- Reading proficiency
- 45% ▼ -10.00%
- Median HH income
- $68,845
- Composite
- 37.93/100
- National rank
- #4308
- State rank
- #25 of 174 in GA
Livability — Vinings
- Score
- 71/100
- State rank
- #78
- US rank
- #6839
Category grades
Schools grade is shown separately in the Schools card above.
Census & demographics
- Census place
- Vinings, GA
- County
- Cobb County · 777,758 people
- City population
- 35,372
- Metro
- Atlanta-Sandy Springs-Alpharetta, GA
- Population (ZIP)
- 35,372
- Household income
- $103,277
- Rent vs Own
- Severe rent burden
- 1977.0
Population outlook (Cobb County) Hauer SSP2
- Today (2025)
- 868,385 people
- By 2030
- 929,614 · +7.1%
- By 2040
- 1,047,533 · +20.6%
- By 2050
- 1,155,537 · +33.1%
- By 2075
- 1,405,030 · +61.8%
- By 2100
- 1,555,058 · +79.1%
Race, ethnicity, and origin ACS 2023
- Neighborhood character
- Diverse neighborhood (Simpson 0.68)
- Race & ethnicity
- White 48% Black 29% Two or more races 11% Hispanic / Latino 9% Asian 8%
- Hispanic origin (detail)
- Mexican 1% Cuban 1% Salvadoran 1%
- Common ancestry
- Italian 3% Slovak 2% Romanian 1%
- Foreign-born
- 16% · Canada, China, Jamaica
- Languages at home
- 83% English-only · Spanish 8% Other Indo-European 3% Other Asian/Pacific 3%
Political lean MEDSL · Cobb
- 2024 margin
- D (+14.9) · D 56.9% · R 42.0% · Other 1.1%
- 2008→2024 swing
- +24.3pp toward D · 2008: -9.4pp · 2024: 14.9pp
- All cycles
- 2024: D+14.9 2020: D+14.3 2016: D+2.1 2012: R+12.6 2008: R+9.4
Not yet ingested
- Civics
- —
Market trends
- HPI YoY
- ▼ -168.82%
- Current HPI
- 193.9998
- Rent YoY
- ▬ 0.05%
- Metro
- Atlanta-Sandy Springs-Alpharetta, GA
- State GDP YoY
- ▲ 2.66%
- F500 in state
- 28
Industry mix (Fortune 500 HQ in GA)
| Industry | F500 HQs | Revenue |
|---|---|---|
| Paper / Packaging | 2 | $29B |
|
||
| Retail | 1 | $160B |
|
||
| Transportation / Logistics | 1 | $91B |
|
||
| Airlines | 1 | $62B |
|
||
| Consumer Goods | 1 | $47B |
|
||
| Utilities | 1 | $25B |
|
||
Price history
+52.7% since first listed15 events — show timeline
- 2026-02-12 Listed $168,000 FMLS
- 2026-02-12 Listed $168,000 GAMLS
- 2022-03-31 Sold (MLS) $160,000 GAMLS
- 2022-03-31 Sold (MLS) $160,000 FMLS
- 2022-03-22 Contingent — FMLS
- 2022-03-22 Pending — GAMLS
- 2022-03-15 Listed $155,900 GAMLS
- 2022-03-15 Listed $155,900 FMLS
- 2018-02-22 Sold (MLS) $110,000 GAMLS
- 2018-02-22 Sold (MLS) $110,000 FMLS
- 2018-01-28 Pending — FMLS
- 2018-01-24 Contingent — FMLS
- 2018-01-22 Pending — GAMLS
- 2018-01-17 Listed $110,000 GAMLS
- 2018-01-17 Listed $110,000 FMLS
Cash-flow waterfall
monthlySold comps — $/sqft
last 12 mo · ≤1 miLoading sold comps…