304 W Lee St · Chickasaw, AL
Flood risk 1/10 · Minimal
- FEMA flood zone
- X (unshaded)
- Chance of flooding over 30 yrs
- 0.0%
- Est. flood insurance / yr
- $507 – $1,088
Fire risk 3/10 · Minor
- Est. fire insurance / yr
- $916 – $1,700
Heat risk 9/10 · Severe
- Hot days now (above 104°F)
- 7 days/yr
- Hot days in 30 yrs
- 22 days/yr
Wind risk 9/10 · Severe
- Chance of severe wind over 30 yrs
- 99.0%
Air-quality risk 2/10 · Minimal
- Unhealthy air days now
- 1 days/yr
- Unhealthy air days in 30 yrs
- 2 days/yr
Risk factors via First Street. Map © Google.
Why this score? — see what drove the C+ grade
The composite is a weighted blend of 9 inputs, each scored 0–100. Each bar is that input's sub-score; the figure is the points it added to the 100-point composite (weight × sub-score).
- Cash flow +18.8/30.0
- Appreciation +10.0/10.0
- ARV discount +9.9/15.0
- DSCR +5.9/10.0
- Schools +5.0/10.0
- 1% rule +4.0/10.0
- Livability +3.1/5.0
- Rent growth +2.5/5.0
- Condition / age +2.5/5.0
$117,500
🖨 Deal sheet 📄 Offer letter ✓ Due diligence
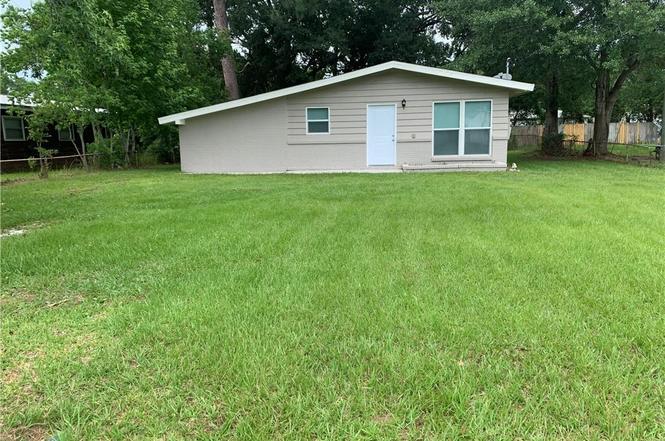
Listing remarks
This charming 3 bedroom 1 bath home has been freshly updated and is ready for its new family. New updates per seller: freshly painted inside, new vinyl plank flooring in the living room, freshly painted cabinets, new fixtures, new front door, 2 new window units. Located conveniently to the interstate for quick & easy access. Inside you will find durable vinyl plank flooring throughout along with ceramic tile. No carpet anywhere!! An extra bonus room provides plenty of options for a den, game room, playroom, home office or flex space to fit your needs. The home features central heat, 4 window units for cooling (2 are brand new), and a shady backyard perfect for relaxing or entertaini
Key facts
- New window units
- New front door
- New fixtures
Tags
Property features AI
Finance
- Other: Located in the Norwood subdivision
- Financial info: No investor or income/expense information listed
- HOA & community: No land lease
Exterior
- Parking: No designated parking
- Security: No security features listed
- Utilities: Electricity available (110 volts); Natural gas available; Public sewer; Public water
- Home design: Single family residence; Residential property
- Construction: Wood siding construction; Shingle roof; Slab foundation
- Exterior features: No notable exterior features listed; Chain link fencing; Property has a view
Interior
- Kitchen: Gas range; Refrigerator
- Bedrooms: 3 bedrooms
- Flooring: Ceramic tile; Laminate
- Bathrooms: 1 full bathroom
- Heating & cooling: Central heating; Window air conditioning units
- Interior features: Other interior features; Breakfast room off the kitchen
- Laundry & utility: No specific laundry details provided
Neighborhood map
What this means for you Summary
Snapshot
- This is a 3-bed/1.0-bath single-family listed at $118k.
Deal economics
- At list price, monthly cash flow is $118 ($1k/yr) — positive.
- The deal already cash-flows at list — no discount required.
- To meet the 1% rule (rent ≥ 1% of price), the offer needs to be $106k (9.9% below list).
- Recommended offer: $106k (9.9% below list) — sets the bar for 1% rule.
Location & tenants
- Location reads 61/100 on livability (#237 in AL) — a middle-class / working-renter tenant base. Strengths: cost of living A+, housing A-, health & safety B; Watch: crime D-, amenities F, commute F.
- Zoned schools: Chickasaw City Elementary School (math 7% / reading 30%, grade F, #480 of 627 statewide, top 77%, 550 students, 80% FRL); Chickasaw City High School (math 5% / reading 15%, grade F, #248 of 305 statewide, top 82%, 224 students, 91% FRL).
- Market conditions: 45 active listings in the ZIP; 7 comparable units currently listed for rent nearby; rentals at typical pace (median 21d on market — plan ~3-4 weeks tenant-placement turnaround); 1,678 units permitted in Mobile County in 2024 (264 in 5+ unit buildings).
Forward outlook
- In year one you build about $13k of equity ($812 loan paydown + $12k appreciation (10.0% local appreciation)).
- Mobile County population projected to shrink 8% by 2050 — rents likely to lag national; underwrite the cash flow, not the appreciation.
- At projected returns (10.0% appreciation + 3.0% rent growth), your $33k cash investment doubles in ~3 years — after that, you're playing with house money.
- By year 3, paydown + projected appreciation supports a ~$32k cash-out refi (75% LTV) — recoverable capital for the next deal without selling this one.
Negotiation context
- Only 2 days on market — expect competitive offers; lowballing is unlikely to land.
- Current owner paid $20k; list at $118k implies a 488% gain — meaningful room to come down on a strong offer.
Risks & watch-outs
- Climate carrying-cost: severe wind risk, 99% chance of damaging wind over 30y; extreme-heat days projected 7→22/yr by 2055 (HVAC capex compounding) — expect insurance premiums to compound above CPI over the hold.
Questions for the listing agent
- Is there a deadline driving the sale (1031 exchange, divorce, estate, relocation)? That informs how much negotiation room exists.
- Schools are F-rated, which usually means shorter tenancies and higher turnover. Who's the typical renter profile here, and what's been the actual vacancy rate?
- Crime grade is D in this area — have there been break-ins, vandalism, or insurance claims at this property in the last 3 years? What carrier currently insures it and at what premium?
- What's the average days-on-market for RENTAL listings here right now (not sales)? A rising rental-DOM trend means longer vacancies and softer asking-rent achievability than the comps imply.
- What's the recent tenant-quality profile in this submarket — average credit score on applications, eviction rate, late-payment / NSF rate, and stable-employment percentage? A property-management company in the area should have these aggregated.
- How much new for-sale + rental construction is in the pipeline within 1–3 miles? Heavy new supply typically softens prices + rents 12–24 months out; constrained supply supports both.
Investment metrics
- 1% rule
- 0.90% ✗
- Cap rate
- 7.50%
- Cash-on-cash
- 4.30%
- DSCR
- 1.19
- GRM
- 9.3
CMA / ARV
- ARV (on-the-fly)
- $124,080
- Comps found
- 12
Show comp detail 12 sales within ~0.75 mi
| Address | Dist | Beds/Ba | Sqft | Sold | Price | $/sf | Match |
|---|---|---|---|---|---|---|---|
| 9 Elizabeth Ave | 0.10mi | 3/1.0 | 1,080 (-4%) | 6mo | $96,000 | $89 | 84 |
| 714 Townsend Cir | 0.23mi | 3/1.5 | 1,161 (+3%) | 1mo | $137,000 | $118 | 81 |
| 364 3rd Pl | 0.47mi | 3/1.0 | 1,106 (-2%) | 1mo | $149,900 | $136 | 74 |
| 300 Geronimo St | 0.41mi | 3/1.0 | 1,076 (-5%) | 2mo | $110,000 | $102 | 72 |
| 521 Holiday Ave | 0.44mi | 3/1.0 | 1,189 (+5%) | 1mo | $42,000 | $35 | 70 |
| 419 Sutherland Cir | 0.37mi | 3/1.0 | 1,196 (+6%) | 6mo | $144,900 | $121 | 67 |
| 419 Geronimo St | 0.23mi | 3/1.0 | 1,000 (-11%) | 4mo | $139,900 | $140 | 67 |
| 104 8th Ave | 0.58mi | 2/1.0 (-1) | 1,071 (-5%) | 0mo | $94,000 | $88 | 59 |
| 305 11th Ave | 0.71mi | 3/2.0 | 1,152 (+2%) | 1mo | $65,000 | $56 | 59 |
| 97 Grant St | 0.64mi | 2/1.0 (-1) | 1,032 (-8%) | 1mo | $137,500 | $133 | 50 |
| 206 1st St | 0.70mi | 2/1.5 (-1) | 1,049 (-7%) | 3mo | $115,000 | $110 | 46 |
| 108 11th Ave | 0.75mi | 2/1.0 (-1) | 1,003 (-11%) | 0mo | $77,000 | $77 | 42 |
Match score weights: distance 35% · size 25% · config 20% · recency 20%. Top-matched comps best support the ARV.
Projected returns pro-forma
10.0% appreciation · 3.0% rent growth · sell at horizon
- IRR
- 27.4%
- Equity multiple
- 3.17×
- Total profit
- $71,466
- Equity at exit
- $105,853
- IRR
- 23.9%
- Equity multiple
- 7.21×
- Total profit
- $204,463
- Equity at exit
- $228,277
Cash invested: $32,900 (down + closing). Projections, not guarantees.
Landlord ↔ Tenant lean methodology
- Overall (STATE)
- 90 Strongly Landlord-Friendly
- State Alabama
- 90 Strongly Landlord-Friendly · R+15
- County
- — inherits STATE
- City
- — inherits STATE
ZIP-level market 36611
- Home prices YoY
- 7.0%
- Active inventory
- 45
- Price-to-rent
- 9.3×
Monthly cashflow live
- Estimated rent
- $1,058 high interval (Pro) →
- Mortgage (P&I)
- −$616
- Tax from tax record
- −$53 /mo · $636/yr
- Insurance
- −$49
- HOA
- −$0
- Vacancy / Maint / Mgmt
- −$222
- Net cashflow
- $118
Break-even live
UW: 25.0% down · 7.5% · 30yr · 1.5% tax · 5.0% vac · 8.0% maint · 8.0% mgmt
Financing live
Cash to close
- Down payment
- $29,375
- Closing costs
- $3,525
- Reserves months
- —
- Total cash needed
- —
Loan-product check · same deal, 3 products live
Conventional
25% down · 7.5% · 30yr
- Down + closing
- —
- Monthly P&I
- —
- Monthly cashflow
- —
- DSCR
- —
- Eligible?
- —
Personal DTI + credit; lowest rate.
DSCR
20% down · 8.5% · 30yr
- Down + closing
- —
- Monthly P&I
- —
- Monthly cashflow
- —
- DSCR
- —
- Eligible?
- —
No personal income docs; deal must DSCR.
Hard money
10% down · 12.0% · 12mo
- Down + closing
- —
- Monthly P&I
- —
- Monthly cashflow
- —
- DSCR
- —
- Eligible?
- —
Short-term bridge; refi at stabilization.
Rent comps 7 comps
| Address | Beds | Baths | Sqft | Rent | $/sqft | DOM | Units | Dist |
|---|---|---|---|---|---|---|---|---|
| 78 Lee St Chickasaw, AL | 3.0 | 1.0 | 1412 | $1,100 | $0.78 | 44d | 1 | 0.49mi |
| 55 Thompson Blvd Chickasaw, AL | 3.0 | 1.0 | 939 | $1,500 | $1.60 | 21d | 1 | 0.56mi |
| 156 9th Ave Chickasaw, AL | 2.0 | 1.0 | 720 | $950 | $1.32 | 21d | 1 | 0.58mi |
| 101 Grant St Chickasaw, AL | 3.0 | 1.0 | 1383 | $895 | $0.65 | 13d | 1 | 0.67mi |
| 311 Grant St Chickasaw, AL | 2.0 | 1.0 | 1000 | $850 | $0.85 | 44d | 1 | 0.84mi |
| 3 Southern St Chickasaw, AL | 3.0 | 1.0 | 1108 | $795 | $0.72 | 13d | 1 | 1.19mi |
| 408 Rawls Ave Mobile, AL | 2.0 | 1.0 | 1032 | $1,100 | $1.07 | 13d | 1 | 1.47mi |
Listing history 3 events
-
2026-06-18days on market $117,500 Active 2 DOM
-
2026-06-16remarks 695-char remark
-
2026-06-16$117,500 Active 1 DOM
ⓘ Source: listings_history table (triggers on properties + properties_extension) + one-shot
backfill from property_details.listing_events for pre-trigger history.
Tax reassessment forecast AL · Resets to sale price
- Current annual tax
- $636 · $53/mo
- Projected year-2 tax
- $636 · $53/mo
- Expected delta
- $0/yr ($0/mo · 0.0%)
ⓘ Screening estimate from a state-policy table — verify with the county assessor before closing.
Climate risk First Street
- Flood 1/10 Low FEMA zone X (unshaded) · 0% chance over 30 yrs
- Wildfire 3/10 Moderate
- Heat 9/10 Extreme 7 d/yr ≥104°F today · 22 d/yr by 30 yrs out
- Wind 9/10 Extreme 99% chance of damaging wind over 30 yrs
- Air quality 2/10 Low 1 unhealthy d/yr today · 2 by 30 yrs out
Nearby sold comps map
Loading sold comps map…
Walkable amenities ~0.75 mi
Loading nearby amenities…
Taxation est. · year 1
- Rental income
- $12,701
- − Mortgage interest
- −$6,582
- − Property taxes
- −$636
- − Insurance
- −$588
- − Repairs & maintenance
- −$1,016
- − Management
- −$1,016
- − Depreciation
- −$3,418
- Taxable loss
- −$555
- Est. tax savings @ 24.0%
- +$133
- After-tax cash flow
- $1,549/yr
For passive investors: Depreciation is non-cash, so a rental often shows a tax loss while cash-flowing — sheltering income. Rental losses are passive: they offset passive income freely, and up to $25,000/yr can offset ordinary (W-2) income if you actively participate and your MAGI is under $100k (phasing out to $0 by $150k); unused losses carry forward. On sale, claimed depreciation is recaptured at up to 25%, and gains may owe capital-gains tax (a 1031 exchange can defer both). Figures are a year-1 estimate at your 24.0% rate — not tax advice; consult a CPA.
Schools (NCES district)
No district data.
Livability — Chickasaw
- Score
- 61/100
- State rank
- #237
- US rank
- #17438
Category grades
Schools grade is shown separately in the Schools card above.
Census & demographics
- Census place
- Chickasaw, AL
- City population
- 6,367
- Population (ZIP)
- 6,367
Population outlook (Mobile County) Hauer SSP2
- Today (2025)
- 415,303 people
- By 2030
- 411,755 · -0.9%
- By 2040
- 399,670 · -3.8%
- By 2050
- 382,616 · -7.9%
- By 2075
- 337,353 · -18.8%
- By 2100
- 283,391 · -31.8%
Race, ethnicity, and origin ACS 2023
- Neighborhood character
- Diverse neighborhood (Simpson 0.56)
- Race & ethnicity
- Black 55% White 38% Two or more races 4% Hispanic / Latino 2% Asian 2%
- Common ancestry
- Lithuanian 2% Serbian 1% Italian 1%
- Foreign-born
- 3% · Canada, China
- Languages at home
- 98% English-only · Spanish 1% French/Haitian/Cajun 1%
Political lean MEDSL · Mobile
- 2024 margin
- R (+16.4) · D 41.3% · R 57.7%
- 2008→2024 swing
- -7.7pp toward R · 2008: -8.7pp · 2024: -16.4pp
- All cycles
- 2024: R+16.4 2020: R+11.9 2016: R+13.9 2012: R+9.3 2008: R+8.7
Not yet ingested
- Civics
- —
Market trends
- HPI YoY
- ▲ 12.90%
- Current HPI
- 196.621
- Rent YoY
- —
- Metro
- —
- State GDP YoY
- ▲ 2.94%
- F500 in state
- 4
Industry mix (Fortune 500 HQ in AL)
| Industry | F500 HQs | Revenue |
|---|---|---|
| Financial Services | 1 | $8B |
|
||
| Healthcare | 1 | $5B |
|
||
Price history
+487.5% since first listed2 events — show timeline
- 2026-06-16 Listed $117,500 GCMLS AL
- 2015-06-08 Sold (Public Records) $20,000 Public Records
Property tax history
+1.9%/yrLatest (2025): $636 · +12.8% YoY. Source: county tax records.
Cash-flow waterfall
monthlySold comps — $/sqft
last 12 mo · ≤1 miLoading sold comps…