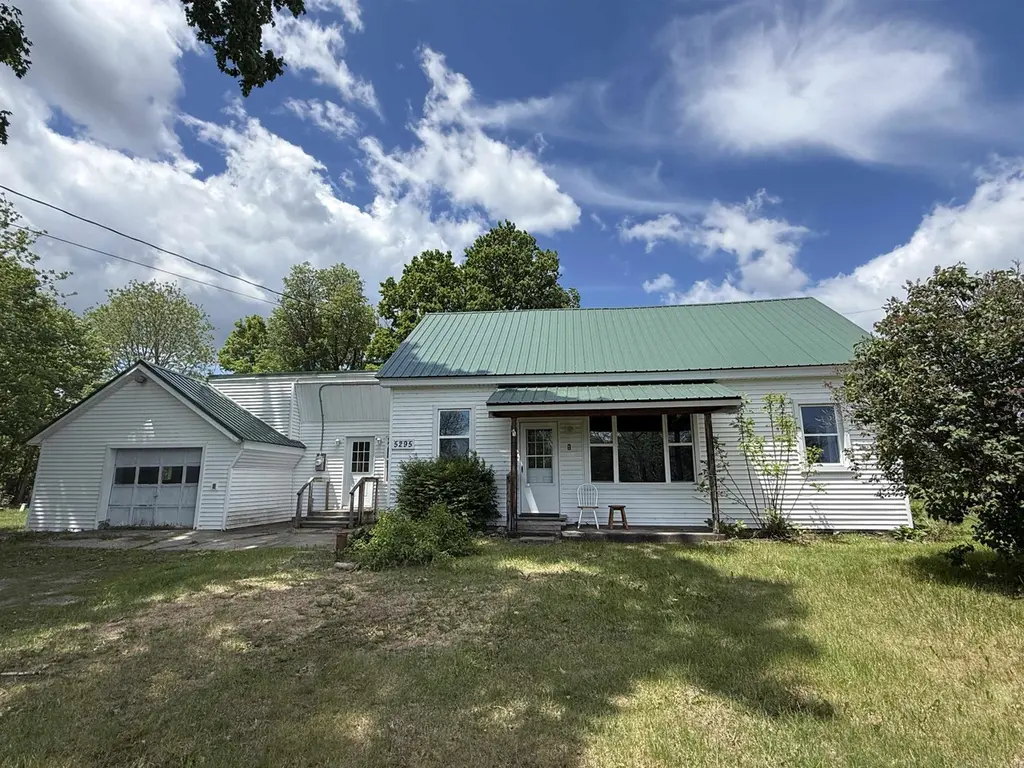
5295 County Route 14 · Norfolk, NY
Flood risk 1/10 · Minimal
- FEMA flood zone
- —
- Chance of flooding over 30 yrs
- 0.0%
- Est. flood insurance / yr
- —
Fire risk 3/10 · Minor
- Est. fire insurance / yr
- $691 – $1,283
Heat risk 2/10 · Minimal
- Hot days now (above 93°F)
- 7 days/yr
- Hot days in 30 yrs
- 15 days/yr
Wind risk 1/10 · Minimal
- Chance of severe wind over 30 yrs
- —
Air-quality risk 2/10 · Minimal
- Unhealthy air days now
- 1 days/yr
- Unhealthy air days in 30 yrs
- 1 days/yr
Risk factors via First Street. Map © Google.
Why this score? — see what drove the D+ grade
The composite is a weighted blend of 9 inputs, each scored 0–100. Each bar is that input's sub-score; the figure is the points it added to the 100-point composite (weight × sub-score).
- Cash flow +11.6/30.0
- ARV discount +7.5/15.0
- Appreciation +7.2/10.0
- Schools +4.5/10.0
- DSCR +3.4/10.0
- Livability +3.2/5.0
- 1% rule +2.8/10.0
- Rent growth +2.5/5.0
- Condition / age +2.5/5.0
$145,000
🖨 Deal sheet (PDF) 📄 Offer letter ✓ Due diligence
Listing remarks
5295 County Route 14 is an affordable 2-bedroom, 1-bath home located in the quiet hamlet of Chase Mills, NY. Offering a practical and efficient layout, this partially renovated home is an excellent opportunity for first-time buyers, downsizers, or anyone seeking a year-round residence close to some of the area's best outdoor recreation. Recent updates have already been completed, including new windows, updated flooring, a new electrical entrance, and an energy-efficient mini-split system for heating and cooling. These improvements provide a solid foundation while still allowing the next owner the opportunity to add their own finishing touches and personal style. The home also features a lar
Key facts
- Updated flooring
- Partially renovated
- New windows
Tags
Property features AI
Exterior
- Parking: Attached garage with 1 garage space
- Utilities: Private well water; Septic tank
- Home design: Single-story residential home; Vinyl siding; Metal roof
- Construction: Vinyl siding construction; Metal roof; Built on a crawl space foundation
- Exterior features: Covered patio/porch; Workshop on the property
Interior
- Kitchen: Electric cooktop; Refrigerator
- Bedrooms: Total of 5 rooms (bedroom count not specified)
- Flooring: Carpet; Laminate; Vinyl
- Bathrooms: 1 full bathroom
- Interior features: Insulated windows; Crawl space basement
- Laundry & utility: Washer and dryer on the main level; Electric water heater
Neighborhood map
What this means for you Summary
Snapshot
- This is a 3-bed/1.0-bath single-family listed at $145k.
Deal economics
- At list price, monthly cash flow is $-46 ($-555/yr) — negative.
- To cash-flow at today's rent, offer at most $137k (5.6% below list).
- To meet the 1% rule (rent ≥ 1% of price), the offer needs to be $113k (21.8% below list).
- Recommended offer: $113k (21.8% below list) — sets the bar for 1% rule.
Location & tenants
- Location reads 64/100 on livability (#737 in NY) — a middle-class / working-renter tenant base. Strengths: cost of living A+, housing A+; Watch: health & safety C-, crime F, amenities F.
- Madrid-Waddington Central School District (rural): math 50% / reading 56% proficiency, ranked #332 of 590 in NY (top 56%) — acceptable for families but not a draw, mixed tenant base, ~2y average lease.
- Zoned schools: Madrid-Waddington Elementary School (math 52% / reading 52%, grade C-, #988 of 2,108 statewide, top 49%, 327 students, 43% FRL); Madrid-Waddington Junior-Senior High School (math 52% / reading 62%, grade C, #887 of 1,100 statewide, top 82%, 328 students, 49% FRL).
- Market conditions: 6 active listings in the ZIP; 215 units permitted in St. Lawrence County in 2024 (0 in 5+ unit buildings).
Forward outlook
- In year one you build about $7k of equity ($1k loan paydown + $6k appreciation (4.4% local appreciation)).
- St. Lawrence County population projected at -14% by 2050 — secular population decline; favor cash flow + early exit over multi-decade hold.
- At projected returns (4.4% appreciation + 3.0% rent growth), your $41k cash investment doubles in ~6 years — after that, you're playing with house money.
- By year 5, paydown + projected appreciation supports a ~$32k cash-out refi (75% LTV) — recoverable capital for the next deal without selling this one.
Negotiation context
- It's been on market 22 days — a 2% lower offer ($143k) is reasonable based on typical stale-listing flexibility.
Risks & watch-outs
- Watch-outs: built in 1900 — expect roof / HVAC / electrical / plumbing capex.
Questions for the listing agent
- What do current leases actually rent for vs. the listed asking? Can we see a recent rent roll and the last 12 months of T-12 income?
- Built in 1900 — when were the roof, HVAC, electrical panel, plumbing, and water heater last replaced?
- Is there a deadline driving the sale (1031 exchange, divorce, estate, relocation)? That informs how much negotiation room exists.
- Schools are D-rated, which usually means shorter tenancies and higher turnover. Who's the typical renter profile here, and what's been the actual vacancy rate?
- Crime grade is F in this area — have there been break-ins, vandalism, or insurance claims at this property in the last 3 years? What carrier currently insures it and at what premium?
- The area grade is low — what's the realistic commute time and amenity access for the typical tenant pool here? Any planned neighborhood developments (good or bad) we should know about?
- What's the average days-on-market for RENTAL listings here right now (not sales)? A rising rental-DOM trend means longer vacancies and softer asking-rent achievability than the comps imply.
- What's the recent tenant-quality profile in this submarket — average credit score on applications, eviction rate, late-payment / NSF rate, and stable-employment percentage? A property-management company in the area should have these aggregated.
- How much new for-sale + rental construction is in the pipeline within 1–3 miles? Heavy new supply typically softens prices + rents 12–24 months out; constrained supply supports both.
Investment metrics
- 1% rule
- 0.78% ✗
- Cap rate
- 5.91%
- Cash-on-cash
- -1.37%
- DSCR
- 0.94
- GRM
- 10.7
CMA / ARV
No comps found within radius.
Projected returns pro-forma
4.37% appreciation · 3.0% rent growth · sell at horizon
- IRR
- 10.1%
- Equity multiple
- 1.62×
- Total profit
- $25,291
- Equity at exit
- $76,676
- IRR
- 11.7%
- Equity multiple
- 3.01×
- Total profit
- $81,617
- Equity at exit
- $127,999
Cash invested: $40,600 (down + closing). Projections, not guarantees.
Landlord ↔ Tenant lean methodology
- Overall (STATE)
- 15 Strongly Tenant-Friendly
- State New York
- 15 Strongly Tenant-Friendly · D+10
- County
- — inherits STATE
- City
- — inherits STATE
ZIP-level market 13621
- Home prices YoY
- 1.5%
- Active inventory
- 6
- Price-to-rent
- 10.7×
Monthly cashflow live
- Estimated rent
- $1,133 medium interval (Pro) →
- Mortgage (P&I)
- −$760
- Tax from tax record
- −$121 /mo · $1,449/yr
- Insurance
- −$60
- HOA
- −$0
- Vacancy / Maint / Mgmt
- −$238
- Net cashflow
- $-46
Break-even live
Sensitivity live
| Price | -10% $36 | -5% $-5 | +0% $-46 | +5% $-87 | +10% $-128 |
|---|---|---|---|---|---|
| Rent | -10% $-136 | -5% $-91 | +0% $-46 | +5% $-1 | +10% $43 |
| Rate | -1.0pp $27 | -0.5pp $-9 | base $-46 | +0.5pp $-84 | +1.0pp $-122 |
UW: 25.0% down · 7.5% · 30yr · 1.5% tax · 5.0% vac · 8.0% maint · 8.0% mgmt
Financing live
Cash to close
- Down payment
- $36,250
- Closing costs
- $4,350
- Reserves months
- —
- Total cash needed
- —
Loan-product check · same deal, 3 products live
Conventional
25% down · 7.5% · 30yr
- Down + closing
- —
- Monthly P&I
- —
- Monthly cashflow
- —
- DSCR
- —
- Eligible?
- —
Personal DTI + credit; lowest rate.
DSCR
20% down · 8.5% · 30yr
- Down + closing
- —
- Monthly P&I
- —
- Monthly cashflow
- —
- DSCR
- —
- Eligible?
- —
No personal income docs; deal must DSCR.
Hard money
10% down · 12.0% · 12mo
- Down + closing
- —
- Monthly P&I
- —
- Monthly cashflow
- —
- DSCR
- —
- Eligible?
- —
Short-term bridge; refi at stabilization.
Listing history 17 events
-
2026-06-21days on market $145,000 Active 22 DOM
-
2026-06-21days on market $145,000 Active 21 DOM
-
2026-06-18days on market $145,000 Active 19 DOM
-
2026-06-17days on market $145,000 Active 18 DOM
-
2026-06-16days on market $145,000 Active 17 DOM
-
2026-06-15days on market $145,000 Active 16 DOM
-
2026-06-13days on market $145,000 Active 14 DOM
-
2026-06-12days on market $145,000 Active 13 DOM
-
2026-06-09days on market $145,000 Active 10 DOM
-
2026-06-08days on market $145,000 Active 9 DOM
-
2026-06-07days on market $145,000 Active 8 DOM
-
2026-06-07days on market $145,000 Active 7 DOM
-
2026-06-04days on market $145,000 Active 4 DOM
-
2026-06-02days on market $145,000 Active 3 DOM
-
2026-06-01days on market $145,000 Active 2 DOM
-
2026-05-31remarks 699-char remark
-
2026-05-31$145,000 Active 1 DOM
ⓘ Source: listings_history table (triggers on properties + properties_extension) + one-shot
backfill from property_details.listing_events for pre-trigger history.
Tax reassessment forecast NY · Partial reset (capped growth)
- Current annual tax
- $1,449 · $121/mo
- Projected year-2 tax
- $1,950 · $162/mo
- Expected delta
- +$501/yr (+$42/mo · 34.6%)
ⓘ Screening estimate from a state-policy table — verify with the county assessor before closing.
Climate risk First Street
- Flood 1/10 Low 0% chance over 30 yrs
- Wildfire 3/10 Moderate
- Heat 2/10 Low 7 d/yr ≥93°F today · 15 d/yr by 30 yrs out
- Wind 1/10 Low
- Air quality 2/10 Low 1 unhealthy d/yr today · 1 by 30 yrs out
Nearby sold comps map
Loading sold comps map…
Walkable amenities ~0.75 mi
Loading nearby amenities…
Taxation est. · year 1
- Rental income
- $13,599
- − Mortgage interest
- −$8,122
- − Property taxes
- −$1,449
- − Insurance
- −$725
- − Repairs & maintenance
- −$1,088
- − Management
- −$1,088
- − Depreciation
- −$4,218
- Taxable loss
- −$3,091
- Est. tax savings @ 24.0%
- +$742
- After-tax cash flow
- $187/yr
For passive investors: Depreciation is non-cash, so a rental often shows a tax loss while cash-flowing — sheltering income. Rental losses are passive: they offset passive income freely, and up to $25,000/yr can offset ordinary (W-2) income if you actively participate and your MAGI is under $100k (phasing out to $0 by $150k); unused losses carry forward. On sale, claimed depreciation is recaptured at up to 25%, and gains may owe capital-gains tax (a 1031 exchange can defer both). Figures are a year-1 estimate at your 24.0% rate — not tax advice; consult a CPA.
Schools (NCES district)
- District
- Madrid-Waddington Central School District
- NCES district ID
- 3618090
- Math proficiency
- 50% ▲ 6.00%
- Reading proficiency
- 56% ▲ 10.00%
- Median HH income
- $51,008
- Composite
- 45.35/100
- National rank
- #2635
- State rank
- #332 of 590 in NY
Livability — Norfolk
- Score
- 64/100
- State rank
- #737
- US rank
- #14031
Category grades
Schools grade is shown separately in the Schools card above.
Census & demographics
- Population (ZIP)
- 683
Population outlook (St. Lawrence County) Hauer SSP2
- Today (2025)
- 110,027 people
- By 2030
- 107,455 · -2.3%
- By 2040
- 100,492 · -8.7%
- By 2050
- 94,254 · -14.3%
- By 2075
- 80,175 · -27.1%
- By 2100
- 63,140 · -42.6%
Race, ethnicity, and origin ACS 2023
- Neighborhood character
- Predominantly White (100%)
- Race & ethnicity
- White 100%
- Common ancestry
- Lithuanian 18% Slovak 2% Romanian 2%
- Foreign-born
- 1% · Canada
- Languages at home
- 99% English-only · French/Haitian/Cajun 1%
Political lean MEDSL · St. Lawrence
- 2024 margin
- R (+18.0) · D 41.0% · R 59.0%
- 2008→2024 swing
- -34.3pp toward R · 2008: 16.3pp · 2024: -18.0pp
- All cycles
- 2024: R+18.0 2020: R+11.7 2016: R+10.8 2012: D+16.6 2008: D+16.3
Not yet ingested
- Civics
- —
Market trends
- HPI YoY
- ▲ 4.37%
- Current HPI
- 296.5202
- Rent YoY
- —
- Metro
- —
- State GDP YoY
- ▲ 2.60%
- F500 in state
- 92
Industry mix (Fortune 500 HQ in NY)
| Industry | F500 HQs | Revenue |
|---|---|---|
| Financial Services | 10 | $950B |
|
||
| Consumer Goods | 9 | $162B |
|
||
| Insurance | 4 | $225B |
|
||
| Telecommunications | 2 | $144B |
|
||
| Pharmaceuticals | 2 | $112B |
|
||
| Media / Entertainment | 2 | $69B |
|
||
Price history
1 event — show timeline
- 2026-05-30 Listed $145,000 SLCMLS
Property tax history
+14.1%/yrLatest (2025): $1,449 · +26.6% YoY. Source: county tax records.
Cash-flow waterfall
monthlySold comps — $/sqft
last 12 mo · ≤1 miLoading sold comps…