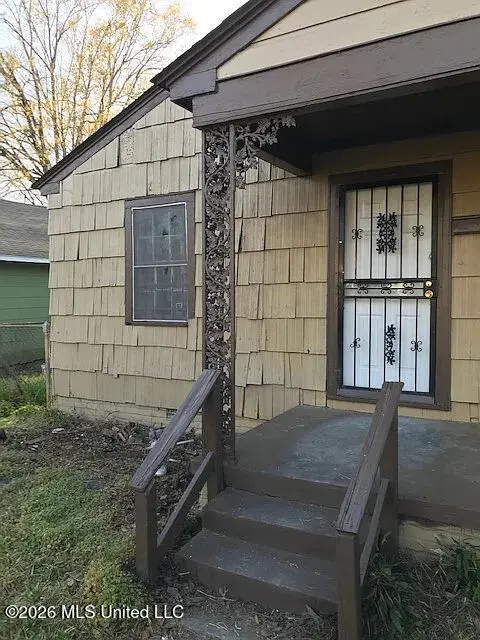
2307 Mobile Ave · Jackson, MS
Flood risk 1/10 · Minimal
- FEMA flood zone
- X (unshaded)
- Chance of flooding over 30 yrs
- 0.0%
- Est. flood insurance / yr
- $507 – $1,088
Fire risk 1/10 · Minimal
- Est. fire insurance / yr
- $1,241 – $2,305
Heat risk 7/10 · Major
- Hot days now (above 109°F)
- 7 days/yr
- Hot days in 30 yrs
- 20 days/yr
Wind risk 8/10 · Major
- Chance of severe wind over 30 yrs
- 80.0%
Air-quality risk 1/10 · Minimal
- Unhealthy air days now
- 0 days/yr
- Unhealthy air days in 30 yrs
- 0 days/yr
Risk factors via First Street. Map © Google.
Why this score? — see what drove the A- grade
The composite is a weighted blend of 9 inputs, each scored 0–100. Each bar is that input's sub-score; the figure is the points it added to the 100-point composite (weight × sub-score).
- Cash flow +30.0/30.0
- ARV discount +14.4/15.0
- 1% rule +10.0/10.0
- DSCR +10.0/10.0
- Appreciation +10.0/10.0
- Livability +3.4/5.0
- Rent growth +2.5/5.0
- Condition / age +2.5/5.0
- Schools +1.1/10.0
$29,000
🖨 Deal sheet 📄 Offer letter ✓ Due diligence
Listing remarks
This is part of a portfolio. It cannot be shown at this time. 📍 2307 Mobile Ave, Jackson, MS 39213 💰 Asking Price: $29,000 (AS-IS) 💵 Potential Rent: $900/month Calling all investors and savvy buyers! This property is a fantastic opportunity to add to your rental portfolio or start your real estate investing journey at an affordable price point. With strong rental potential and a price that leaves room for value-add improvements, this one is full of upside. ✨ Property Highlights: Solid rental income potential Great price for entry-level investment Opportunity to renovate and increase value Located in an area with steady rental demand Whether you're looking for a cash-flowing
Key facts
- 4,356 sq ft lot
- Built 1953
- Listed 7 days
Neighborhood map
What this means for you Summary
Snapshot
- This is a 2-bed/1.0-bath single-family listed at $29k.
Deal economics
- At list price, monthly cash flow is $665 ($8k/yr) — positive.
- The deal already cash-flows at list — no discount required.
- Meets the 1% rule at list price ($1k rent vs $29k).
- Cap rate 33.8% vs local median 9.9% in Jackson — top-decile yield for the area; either an underpriced asset or a hidden risk that comps aren't pricing in. Stress-test before assuming the spread holds.
Location & tenants
- Location reads 68/100 on livability (#66 in MS) — a middle-class / working-renter tenant base. Strengths: commute A+, cost of living A+, housing A+; Watch: schools F, amenities F, employment F.
- Jackson Public School District (urban): math 9% / reading 18% proficiency, ranked #112 of 130 in MS (top 86%) — low school quality limits family demand, transient renter base, plan for 1-2y turnover; 88% free/reduced lunch — lower-income household profile, screen leases tightly.
- Market conditions: 81 active listings in the ZIP; 18 comparable units currently listed for rent nearby; rentals at typical pace (median 23d on market — plan ~3-4 weeks tenant-placement turnaround); 44% of comp listings sitting > 30 days — soft ceiling on asking rent; lower-income renter base — watch delinquency; 167 units permitted in Hinds County in 2024 (0 in 5+ unit buildings).
- This rent runs 44% of the median local income ($30k/yr) — at the standard rent-burdened threshold; future hikes will face affordability resistance.
Forward outlook
- In year one you build about $3k of equity ($200 loan paydown + $3k appreciation (10.0% local appreciation)).
- Hinds County population projected to shrink 6% by 2050 — rents likely to lag national; underwrite the cash flow, not the appreciation.
- At projected returns (10.0% appreciation + 3.0% rent growth), your $8k cash investment doubles in ~1 year — after that, you're playing with house money.
- By year 9, paydown + projected appreciation supports a ~$32k cash-out refi (75% LTV) — recoverable capital for the next deal without selling this one.
Negotiation context
- Only 7 days on market — expect competitive offers; lowballing is unlikely to land.
Risks & watch-outs
- Watch-outs: built in 1953 — expect roof / HVAC / electrical / plumbing capex.
- Climate carrying-cost: severe wind risk, 80% chance of damaging wind over 30y; extreme-heat days projected 7→20/yr by 2055 (HVAC capex compounding) — expect insurance premiums to compound above CPI over the hold.
Questions for the listing agent
- Built in 1953 — when were the roof, HVAC, electrical panel, plumbing, and water heater last replaced?
- Is there a deadline driving the sale (1031 exchange, divorce, estate, relocation)? That informs how much negotiation room exists.
- Schools are F-rated, which usually means shorter tenancies and higher turnover. Who's the typical renter profile here, and what's been the actual vacancy rate?
- What's the average days-on-market for RENTAL listings here right now (not sales)? A rising rental-DOM trend means longer vacancies and softer asking-rent achievability than the comps imply.
- What's the recent tenant-quality profile in this submarket — average credit score on applications, eviction rate, late-payment / NSF rate, and stable-employment percentage? A property-management company in the area should have these aggregated.
- How much new for-sale + rental construction is in the pipeline within 1–3 miles? Heavy new supply typically softens prices + rents 12–24 months out; constrained supply supports both.
Investment metrics
- 1% rule
- 3.76% ✓
- Cap rate
- 33.80%
- Cash-on-cash
- 98.23%
- DSCR
- 5.37
- GRM
- 2.2
CMA / ARV
- ARV (on-the-fly)
- $34,272
- Comps found
- 5
Show comp detail 5 sales within ~0.75 mi
| Address | Dist | Beds/Ba | Sqft | Sold | Price | $/sf | Match |
|---|---|---|---|---|---|---|---|
| 2307 Mobile Ave | 0.00mi | 2/1.0 | 816 (0%) | 1mo | $29,000 | $36 | 99 |
| 2118 Powers Ave Ave | 0.22mi | 2/1.0 | 772 (-5%) | 16mo | $24,500 | $32 | 67 |
| 2115 Powers Ave | 0.24mi | 2/1.5 | 720 (-12%) | 10mo | $29,900 | $42 | 59 |
| 1311 Fernwood Dr | 0.60mi | 3/1.0 (+1) | 864 (+6%) | 12mo | $74,900 | $87 | 47 |
| 357 Dewitt Ave | 0.64mi | 2/1.0 | 877 (+8%) | 13mo | $43,950 | $50 | 46 |
Match score weights: distance 35% · size 25% · config 20% · recency 20%. Top-matched comps best support the ARV.
Projected returns pro-forma
10.0% appreciation · 3.0% rent growth · sell at horizon
- IRR
- —
- Equity multiple
- 8.16×
- Total profit
- $58,142
- Equity at exit
- $26,125
- IRR
- —
- Equity multiple
- 17.99×
- Total profit
- $137,956
- Equity at exit
- $56,341
Cash invested: $8,120 (down + closing). Projections, not guarantees.
Landlord ↔ Tenant lean methodology
- Overall (STATE)
- 90 Strongly Landlord-Friendly
- State Mississippi
- 90 Strongly Landlord-Friendly · R+11
- County
- — inherits STATE
- City
- — inherits STATE
ZIP-level market 39213
- Home prices YoY
- 7.0%
- Active inventory
- 81
- Price-to-rent
- 2.2×
Monthly cashflow live
- Estimated rent
- $1,090 high interval (Pro) →
- Mortgage (P&I)
- −$152
- Tax from tax record
- −$32 /mo · $389/yr
- Insurance
- −$12
- HOA
- −$0
- Vacancy / Maint / Mgmt
- −$229
- Net cashflow
- $665
Break-even live
UW: 25.0% down · 7.5% · 30yr · 1.5% tax · 5.0% vac · 8.0% maint · 8.0% mgmt
Financing live
Cash to close
- Down payment
- $7,250
- Closing costs
- $870
- Reserves months
- —
- Total cash needed
- —
Loan-product check · same deal, 3 products live
Conventional
25% down · 7.5% · 30yr
- Down + closing
- —
- Monthly P&I
- —
- Monthly cashflow
- —
- DSCR
- —
- Eligible?
- —
Personal DTI + credit; lowest rate.
DSCR
20% down · 8.5% · 30yr
- Down + closing
- —
- Monthly P&I
- —
- Monthly cashflow
- —
- DSCR
- —
- Eligible?
- —
No personal income docs; deal must DSCR.
Hard money
10% down · 12.0% · 12mo
- Down + closing
- —
- Monthly P&I
- —
- Monthly cashflow
- —
- DSCR
- —
- Eligible?
- —
Short-term bridge; refi at stabilization.
Rent comps 18 comps
| Address | Beds | Baths | Sqft | Rent | $/sqft | DOM | Units | Dist |
|---|---|---|---|---|---|---|---|---|
| 2157 Ludlow Ave Unit Na Jackson, MS | 3.0 | 2.0 | 1123 | $1,450 | $1.29 | 13d | 1 | 0.12mi |
| 2157 Ludlow Ave Jackson, MS | 3.0 | 2.0 | 1123 | $1,300 | $1.16 | 43d | 1 | 0.12mi |
| 3380 Shady Oaks St Unit D Jackson, MS | 2.0 | 1.0 | 721 | $832 | $1.15 | 43d | 1 | 0.83mi |
| 3380 Shady Oaks St Unit B Jackson, MS | 2.0 | 1.0 | 721 | $871 | $1.21 | 23d | 1 | 0.83mi |
| 3380 Shady Oaks St Jackson, MS | 2.0 | 1.0 | 721 | $871 | $1.21 | 13d | 1 | 0.83mi |
| 1225 Bailey Ave Jackson, MS | 2.0 | 1.0 | 990 | $750 | $0.76 | 43d | 1 | 0.95mi |
| 1240 Lawnview Pl Jackson, MS | 1.0–2.0 | 1.0 | 650 | $845 | $1.30 | 13d | 13 | 0.97mi |
| 2566 Williamson Ave Jackson, MS | 3.0 | 1.5 | 940 | $1,150 | $1.22 | 43d | 1 | 0.99mi |
| 1818 Saint Charles St Jackson, MS | 3.0 | 1.0 | 983 | $995 | $1.01 | 43d | 1 | 0.99mi |
| 255 S Prentiss St Jackson, MS | 2.0 | 1.0 | 729 | $1,000 | $1.37 | 43d | 1 | 1.07mi |
| 1204 First Ave Jackson, MS | 2.0 | 1.0 | 800 | $725 | $0.91 | 23d | 1 | 1.10mi |
| 3625 Liberty St Jackson, MS | 3.0 | 1.0 | 1056 | $1,190 | $1.13 | 13d | 1 | 1.36mi |
| 1633 Robinson St Unit 1633 Jackson, MS | 1.0 | 1.0 | 875 | $775 | $0.89 | 13d | 1 | 1.44mi |
| 1647 Robinson St Unit B Jackson, MS | 1.0 | 1.0 | 900 | $850 | $0.94 | 13d | 1 | 1.45mi |
| 1711 Robinson St Jackson, MS | 2.0 | 1.0 | 800 | $800 | $1.00 | 23d | 1 | 1.46mi |
| 1505 N West St Unit 101 Jackson, MS | 1.0 | 1.0 | 700 | $650 | $0.93 | 43d | 1 | 1.47mi |
| 1505 N West St Jackson, MS | 1.0 | 1.0 | 650 | $780 | $1.20 | 43d | 1 | 1.47mi |
| 1505 N West St Unit 110 Jackson, MS | 1.0 | 1.0 | 700 | $650 | $0.93 | 21d | 1 | 1.47mi |
Listing history 9 events
-
2026-04-02status Pending
-
2026-03-26$29,000 Active
-
2022-06-09price $695
-
2018-08-29soldstatus
-
2012-02-28soldstatus
-
2007-10-31soldstatus
-
2004-06-11soldstatus
-
2003-12-02soldstatus
-
1953-03-04soldstatus
ⓘ Source: listings_history table (triggers on properties + properties_extension) + one-shot
backfill from property_details.listing_events for pre-trigger history.
Tax reassessment forecast MS · Resets to sale price
- Current annual tax
- $389 · $32/mo
- Projected year-2 tax
- $389 · $32/mo
- Expected delta
- $0/yr ($0/mo · 0.0%)
ⓘ Screening estimate from a state-policy table — verify with the county assessor before closing.
Climate risk First Street
- Flood 1/10 Low FEMA zone X (unshaded) · 0% chance over 30 yrs
- Wildfire 1/10 Low
- Heat 7/10 Severe 7 d/yr ≥109°F today · 20 d/yr by 30 yrs out
- Wind 8/10 Severe 80% chance of damaging wind over 30 yrs
- Air quality 1/10 Low 0 unhealthy d/yr today · 0 by 30 yrs out
Nearby sold comps map
Loading sold comps map…
Walkable amenities ~0.75 mi
Loading nearby amenities…
Taxation est. · year 1
- Rental income
- $13,082
- − Mortgage interest
- −$1,624
- − Property taxes
- −$389
- − Insurance
- −$145
- − Repairs & maintenance
- −$1,047
- − Management
- −$1,047
- − Depreciation
- −$844
- Taxable income
- $7,987
- Est. tax owed @ 24.0%
- −$1,917
- After-tax cash flow
- $6,059/yr
For passive investors: Depreciation is non-cash, so a rental often shows a tax loss while cash-flowing — sheltering income. Rental losses are passive: they offset passive income freely, and up to $25,000/yr can offset ordinary (W-2) income if you actively participate and your MAGI is under $100k (phasing out to $0 by $150k); unused losses carry forward. On sale, claimed depreciation is recaptured at up to 25%, and gains may owe capital-gains tax (a 1031 exchange can defer both). Figures are a year-1 estimate at your 24.0% rate — not tax advice; consult a CPA.
Schools (NCES district)
- District
- Jackson Public School District
- NCES district ID
- 2802190
- Math proficiency
- 9% ▼ -14.00%
- Reading proficiency
- 18% ▼ -7.00%
- Median HH income
- $33,234
- Composite
- 10.89/100
- National rank
- #9755
- State rank
- #112 of 130 in MS
Livability — Jackson
- Score
- 68/100
- State rank
- #66
- US rank
- #9695
Category grades
Schools grade is shown separately in the Schools card above.
Census & demographics
- Census place
- Jackson, MS
- County
- Hinds County · 167,040 people
- City population
- 140,204
- Metro
- Jackson, MS
- Population (ZIP)
- 18,691
- Household income
- $29,541
- Rent vs Own
- Severe rent burden
- 1138.0
Population outlook (Hinds County) Hauer SSP2
- Today (2025)
- 242,528 people
- By 2030
- 241,113 · -0.6%
- By 2040
- 235,557 · -2.9%
- By 2050
- 226,946 · -6.4%
- By 2075
- 199,995 · -17.5%
- By 2100
- 164,165 · -32.3%
Race, ethnicity, and origin ACS 2023
- Neighborhood character
- Predominantly Black (95%)
- Race & ethnicity
- Black 95% White 2% Two or more races 1% Hispanic / Latino 1%
- Foreign-born
- 0% · Canada
- Languages at home
- 98% English-only · Spanish 2%
Political lean MEDSL · Hinds
- 2024 margin
- Solid D (+46.1) · D 72.4% · R 26.3% · Other 1.4%
- 2008→2024 swing
- +7.1pp toward D · 2008: 39.0pp · 2024: 46.1pp
- All cycles
- 2024: D+46.1 2020: D+48.3 2016: D+43.7 2012: D+45.1 2008: D+39.0
Not yet ingested
- Civics
- —
Market trends
- HPI YoY
- ▲ 21.42%
- Current HPI
- 329.1844
- Rent YoY
- —
- Metro
- Jackson, MS
- State GDP YoY
- —
- F500 in state
- 0
Price history
9 events — show timeline
- 2026-04-02 Pending — MLSU
- 2026-03-26 Listed $29,000 MLSU
- 2022-06-09 Price Changed $695 RENT.
- 2018-08-29 Sold (Public Records) — Public Records
- 2012-02-28 Sold (Public Records) — Public Records
- 2007-10-31 Sold (Public Records) — Public Records
- 2004-06-11 Sold (Public Records) — Public Records
- 2003-12-02 Sold (Public Records) — Public Records
- 1953-03-04 Sold (Public Records) — Public Records
Property tax history
-3.0%/yrLatest (2025): $389 · -0.8% YoY. Source: county tax records.
Cash-flow waterfall
monthlySold comps — $/sqft
last 12 mo · ≤1 miLoading sold comps…