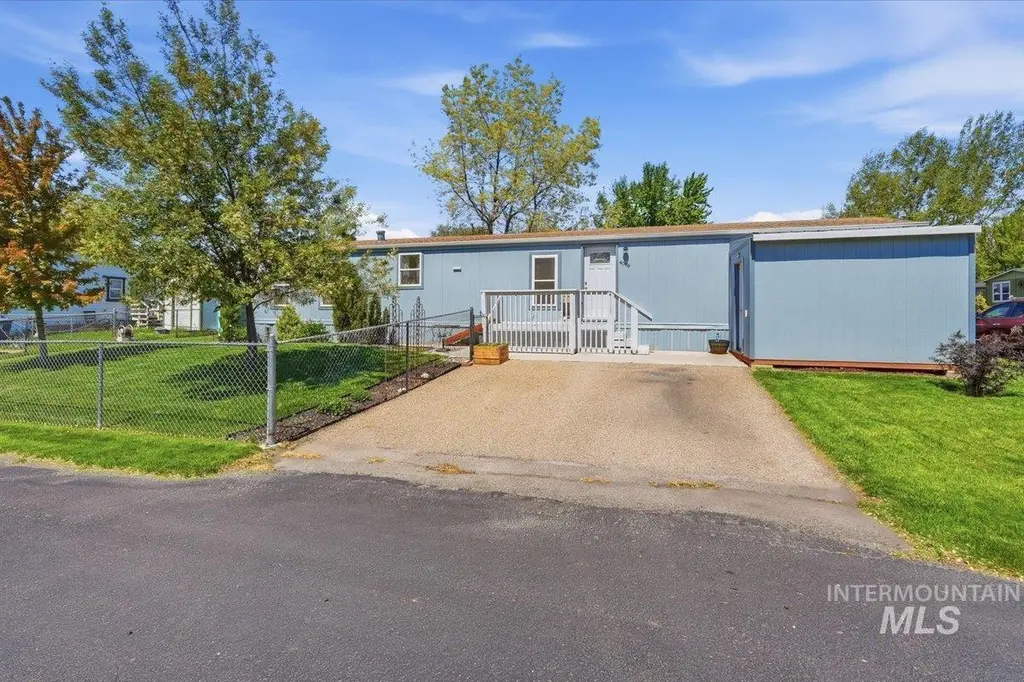
4018 Squall Valley Dr · Nampa, ID
Flood risk No data
- FEMA flood zone
- —
- Chance of flooding over 30 yrs
- —
- Est. flood insurance / yr
- —
Fire risk No data
- Est. fire insurance / yr
- —
Heat risk No data
- Hot days now (above threshold)
- —
- Hot days in 30 yrs
- —
Wind risk No data
- Chance of severe wind over 30 yrs
- —
Air-quality risk No data
- Unhealthy air days now
- —
- Unhealthy air days in 30 yrs
- —
Risk factors via First Street. Map © Google.
Why this score? — see what drove the C+ grade
The composite is a weighted blend of 9 inputs, each scored 0–100. Each bar is that input's sub-score; the figure is the points it added to the 100-point composite (weight × sub-score).
- Cash flow +30.0/30.0
- 1% rule +10.0/10.0
- DSCR +10.0/10.0
- Livability +3.6/5.0
- Rent growth +3.4/5.0
- Schools +2.7/10.0
- Condition / age +2.5/5.0
- ARV discount +0.0/15.0
- Appreciation +0.0/10.0
$125,000
🖨 Deal sheet 📄 Offer letter ✓ Due diligence
Listing remarks
Adorable and completely move-in ready! This beautifully updated home features LVP flooring throughout and a bright, open layout perfect for everyday living and entertaining. The kitchen has been thoughtfully remodeled with newer cabinets, countertops, appliances, and stylish lighting, and flows seamlessly into the living and dining areas. Both bathrooms have been tastefully updated with new vanities, toilets, and lighting. The Primary Bathroom has a new shower surround. The split-bedroom floor plan offers privacy and functionality. Step outside to a fully fenced yard with mature landscaping and vibrant flowers, creating a peaceful outdoor retreat. Additional highlights include two storage s
Key facts
- Built 1997
- Listed 7 days
Property features AI
Finance
- HOA & community: Located in the Happy Valley subdivision and within a mobile home park
Exterior
- Utilities: City water service; Sewer connected; Cable connected
- Home design: Mobile/manufactured home on a rented lot; Built in 1997
- Construction: Composition roof
- Exterior features: Full metal fencing; Storage shed
Interior
- Kitchen: Breakfast bar; Wood/butcher block counters; Dishwasher; Disposal; Microwave; Oven/Range (freestanding); Refrigerator
- Bedrooms: 3 bedrooms (all on the main level)
- Bathrooms: 2 bathrooms
- Heating & cooling: Electric forced air heating; Central air conditioning
- Interior features: Bath in master bedroom; Split bedroom layout; Great room; Breakfast bar; Wood/butcher block counters
- Laundry & utility: Washer; Dryer; Electric water heater; Tank water heater
Neighborhood map
What this means for you Summary
Snapshot
- This is a 3-bed/2.0-bath manufactured listed at $125k.
Deal economics
- At list price, monthly cash flow is $614 ($7k/yr) — positive.
- The deal already cash-flows at list — no discount required.
- Meets the 1% rule at list price ($2k rent vs $125k).
- Cap rate 12.2% vs local median 3.2% in Nampa — top-decile yield for the area; either an underpriced asset or a hidden risk that comps aren't pricing in. Stress-test before assuming the spread holds.
Location & tenants
- Location reads 72/100 on livability (#47 in ID) — a middle-class / working-renter tenant base. Strengths: housing A+, health & safety A+, cost of living A-; Watch: employment C-, amenities F, commute F.
- Nampa School District (suburban): math 23% / reading 41% proficiency, ranked #82 of 92 in ID (top 89%) — families likely to look elsewhere, expect single-tenant / working-renter base with shorter leases.
- Zoned schools: Columbia High School (math 16% / reading 52%, grade F, #115 of 169 statewide, top 68%, 1,239 students, 39% FRL).
- Market conditions: Rents rising (+3.4%/yr); 631 active listings in the ZIP; 3 comparable units currently listed for rent nearby; rentals at typical pace (median 14d on market — plan ~3-4 weeks tenant-placement turnaround); solid renter incomes; 3,620 units permitted in Canyon County in 2024 (196 in 5+ unit buildings).
Forward outlook
- Local home prices are declining (-3.0%/yr); year-one equity from $864 of loan paydown is wiped out by about $4k of value loss. Plan a longer hold.
- Canyon County population projected at +41% by 2050 — long-run rental-demand tailwind backs the buy-and-hold thesis.
- At projected returns (-3.0% appreciation + 3.4% rent growth), your $35k cash investment doubles in ~6 years — after that, you're playing with house money.
Negotiation context
- Only 7 days on market — expect competitive offers; lowballing is unlikely to land.
- 2 sale attempts since 5y ago with the ask held roughly flat each time — persistent listings suggest the price (not the market) is what's stuck; bring a comps-based counter.
Questions for the listing agent
- Is there a deadline driving the sale (1031 exchange, divorce, estate, relocation)? That informs how much negotiation room exists.
- Schools are D-rated, which usually means shorter tenancies and higher turnover. Who's the typical renter profile here, and what's been the actual vacancy rate?
- What's the average days-on-market for RENTAL listings here right now (not sales)? A rising rental-DOM trend means longer vacancies and softer asking-rent achievability than the comps imply.
- What's the recent tenant-quality profile in this submarket — average credit score on applications, eviction rate, late-payment / NSF rate, and stable-employment percentage? A property-management company in the area should have these aggregated.
- How much new for-sale + rental construction is in the pipeline within 1–3 miles? Heavy new supply typically softens prices + rents 12–24 months out; constrained supply supports both.
Investment metrics
- 1% rule
- 1.50% ✓
- Cap rate
- 12.19%
- Cash-on-cash
- 21.06%
- DSCR
- 1.94
- GRM
- 5.6
CMA / ARV
- ARV (on-the-fly)
- $98,868
- Comps found
- 10
Show comp detail 10 sales within ~0.75 mi
| Address | Dist | Beds/Ba | Sqft | Sold | Price | $/sf | Match |
|---|---|---|---|---|---|---|---|
| 813 Long Valley St | 0.27mi | 3/2.0 | 924 (0%) | 2mo | $99,000 | $107 | 86 |
| 510 River Valley St | 0.22mi | 2/2.0 (-1) | 924 (0%) | 10mo | $119,000 | $129 | 76 |
| 711 Round Vly | 0.19mi | 3/1.0 | 960 (+4%) | 7mo | $79,900 | $83 | 75 |
| 616 N Kings Rd Trlr 9 | 0.57mi | 3/2.0 | 924 (0%) | 5mo | $99,900 | $108 | 69 |
| 816 Little Valley St | 0.31mi | 3/2.0 | 924 (0%) | 22mo | $94,900 | $103 | 68 |
| 616 N Kings Rd Trlr 1 Rd | 0.57mi | 2/2.0 (-1) | 938 (+2%) | 0mo | $89,900 | $96 | 65 |
| 3320 Airport #16 | 0.44mi | 2/2.0 (-1) | 946 (+2%) | 8mo | $83,000 | $88 | 64 |
| 905 Long Vly | 0.29mi | 3/1.0 | 972 (+5%) | 11mo | $115,000 | $118 | 64 |
| 3320 Airport Rd #7 | 0.44mi | 2/1.0 (-1) | 924 (0%) | 9mo | $95,000 | $103 | 63 |
| 4516 Oak St | 0.41mi | 2/1.0 (-1) | 840 (-9%) | 15mo | $249,900 | $298 | 44 |
Match score weights: distance 35% · size 25% · config 20% · recency 20%. Top-matched comps best support the ARV.
Projected returns pro-forma
-3.0% appreciation · 3.44% rent growth · sell at horizon
- IRR
- 14.0%
- Equity multiple
- 1.56×
- Total profit
- $19,733
- Equity at exit
- $18,638
- IRR
- 23.2%
- Equity multiple
- 3.03×
- Total profit
- $71,126
- Equity at exit
- $10,808
Cash invested: $35,000 (down + closing). Projections, not guarantees.
Landlord ↔ Tenant lean methodology
- Overall (STATE)
- 91 Strongly Landlord-Friendly
- State Idaho
- 91 Strongly Landlord-Friendly · R+18
- County
- — inherits STATE
- City
- — inherits STATE
ZIP-level market 83687
- Home prices YoY
- -21.0%
- Rents YoY
- 3.4%
- Active inventory
- 631
- Price-to-rent
- 5.6×
Monthly cashflow live
- Estimated rent
- $1,871 medium interval (Pro) →
- Mortgage (P&I)
- −$656
- Tax est. 1.5%
- −$156 /mo · $1,875/yr
- Insurance
- −$52
- HOA
- −$0
- Vacancy / Maint / Mgmt
- −$393
- Net cashflow
- $614
Break-even live
UW: 25.0% down · 7.5% · 30yr · 1.5% tax · 5.0% vac · 8.0% maint · 8.0% mgmt
Financing live
Cash to close
- Down payment
- $31,250
- Closing costs
- $3,750
- Reserves months
- —
- Total cash needed
- —
Loan-product check · same deal, 3 products live
Conventional
25% down · 7.5% · 30yr
- Down + closing
- —
- Monthly P&I
- —
- Monthly cashflow
- —
- DSCR
- —
- Eligible?
- —
Personal DTI + credit; lowest rate.
DSCR
20% down · 8.5% · 30yr
- Down + closing
- —
- Monthly P&I
- —
- Monthly cashflow
- —
- DSCR
- —
- Eligible?
- —
No personal income docs; deal must DSCR.
Hard money
10% down · 12.0% · 12mo
- Down + closing
- —
- Monthly P&I
- —
- Monthly cashflow
- —
- DSCR
- —
- Eligible?
- —
Short-term bridge; refi at stabilization.
Rent comps 3 comps
| Address | Beds | Baths | Sqft | Rent | $/sqft | DOM | Units | Dist |
|---|---|---|---|---|---|---|---|---|
| 610 N Margot Ln , ID | 2.0 | 2.0 | 920 | $1,550 | $1.68 | 3d | 3 | 0.44mi |
| 4595 Stamm Ln Nampa, ID | 1.0–3.0 | 1.0–2.0 | 933 | $1,927 | $2.07 | 14d | 24 | 0.44mi |
| 146 N Grant St Nampa, ID | 3.0 | 2.0 | 1100 | $1,900 | $1.73 | 21d | 1 | 0.89mi |
Listing history 4 events
-
2026-05-12status Pending
-
2026-05-04$125,000 Active
-
2021-05-19status Pending
-
2021-05-17$68,800 Active
ⓘ Source: listings_history table (triggers on properties + properties_extension) + one-shot
backfill from property_details.listing_events for pre-trigger history.
Nearby sold comps map
Loading sold comps map…
Walkable amenities ~0.75 mi
Loading nearby amenities…
Taxation est. · year 1
- Rental income
- $22,454
- − Mortgage interest
- −$7,002
- − Property taxes
- −$1,875
- − Insurance
- −$625
- − Repairs & maintenance
- −$1,796
- − Management
- −$1,796
- − Depreciation
- −$3,636
- Taxable income
- $5,723
- Est. tax owed @ 24.0%
- −$1,373
- After-tax cash flow
- $5,999/yr
For passive investors: Depreciation is non-cash, so a rental often shows a tax loss while cash-flowing — sheltering income. Rental losses are passive: they offset passive income freely, and up to $25,000/yr can offset ordinary (W-2) income if you actively participate and your MAGI is under $100k (phasing out to $0 by $150k); unused losses carry forward. On sale, claimed depreciation is recaptured at up to 25%, and gains may owe capital-gains tax (a 1031 exchange can defer both). Figures are a year-1 estimate at your 24.0% rate — not tax advice; consult a CPA.
Schools (NCES district)
- District
- Nampa School District
- NCES district ID
- 1602340
- Math proficiency
- 23% ▼ -13.00%
- Reading proficiency
- 41% ▼ -9.00%
- Median HH income
- $43,576
- Composite
- 27.18/100
- National rank
- #7022
- State rank
- #82 of 92 in ID
Livability — Nampa
- Score
- 72/100
- State rank
- #47
- US rank
- #6250
Category grades
Schools grade is shown separately in the Schools card above.
Census & demographics
- Census place
- Nampa, ID
- County
- Canyon County · 235,358 people
- City population
- 142,249
- Metro
- Boise City, ID
- Population (ZIP)
- 43,135
- Household income
- $76,682
- Rent vs Own
- Severe rent burden
- 683.0
Population outlook (Canyon County) Hauer SSP2
- Today (2025)
- 248,853 people
- By 2030
- 269,596 · +8.3%
- By 2040
- 311,081 · +25.0%
- By 2050
- 350,809 · +41.0%
- By 2075
- 441,884 · +77.6%
- By 2100
- 505,641 · +103.2%
Race, ethnicity, and origin ACS 2023
- Neighborhood character
- Predominantly White (71%)
- Race & ethnicity
- White 71% Hispanic / Latino 21% Two or more races 11% Black 2% Native American 1%
- Hispanic origin (detail)
- Mexican 18%
- Common ancestry
- Italian 4% Slovak 3% Lithuanian 2%
- Foreign-born
- 7% · Canada
- Languages at home
- 85% English-only · Spanish 12% Russian/Polish/Slavic 1%
Political lean MEDSL · Canyon
- 2024 margin
- Solid R (+46.6) · D 25.4% · R 72.0% · Other 2.5%
- 2008→2024 swing
- -11.4pp toward R · 2008: -35.2pp · 2024: -46.6pp
- All cycles
- 2024: R+46.6 2020: R+39.7 2016: R+41.8 2012: R+37.1 2008: R+35.2
Not yet ingested
- Civics
- —
Market trends
- HPI YoY
- ▼ -103.50%
- Current HPI
- 388.8148
- Rent YoY
- ▲ 3.44%
- Metro
- Boise City, ID
- State GDP YoY
- ▲ 4.51%
- F500 in state
- 6
Industry mix (Fortune 500 HQ in ID)
| Industry | F500 HQs | Revenue |
|---|---|---|
| Retail | 1 | $79B |
|
||
| Technology | 1 | $25B |
|
||
| Food / Agriculture | 1 | $6B |
|
||
Price history
+81.7% since first listed4 events — show timeline
- 2026-05-12 Pending — IMLS
- 2026-05-04 Listed $125,000 IMLS
- 2021-05-19 Pending — IMLS
- 2021-05-17 Listed $68,800 IMLS
Property tax history
+3.8%/yrLatest (2025): $244 · +9.1% YoY. Source: county tax records.
Cash-flow waterfall
monthlySold comps — $/sqft
last 12 mo · ≤1 miLoading sold comps…