5729 Kew Ln · Tuscaloosa, AL
Flood risk 1/10 · Minimal
- FEMA flood zone
- X (unshaded)
- Chance of flooding over 30 yrs
- 0.0%
- Est. flood insurance / yr
- $507 – $1,088
Fire risk 2/10 · Minimal
- Est. fire insurance / yr
- $916 – $1,700
Heat risk 7/10 · Major
- Hot days now (above 108°F)
- 7 days/yr
- Hot days in 30 yrs
- 21 days/yr
Wind risk 6/10 · Moderate
- Chance of severe wind over 30 yrs
- 56.0%
Air-quality risk 1/10 · Minimal
- Unhealthy air days now
- 0 days/yr
- Unhealthy air days in 30 yrs
- 0 days/yr
Risk factors via First Street. Map © Google.
Why this score? — see what drove the C+ grade
The composite is a weighted blend of 9 inputs, each scored 0–100. Each bar is that input's sub-score; the figure is the points it added to the 100-point composite (weight × sub-score).
- Cash flow +24.4/30.0
- ARV discount +15.0/15.0
- DSCR +7.9/10.0
- 1% rule +5.1/10.0
- Rent growth +3.9/5.0
- Livability +3.9/5.0
- Schools +2.5/10.0
- Condition / age +2.5/5.0
- Appreciation +0.0/10.0
$218,500
🖨 Deal sheet 📄 Offer letter ✓ Due diligence
Listing remarks
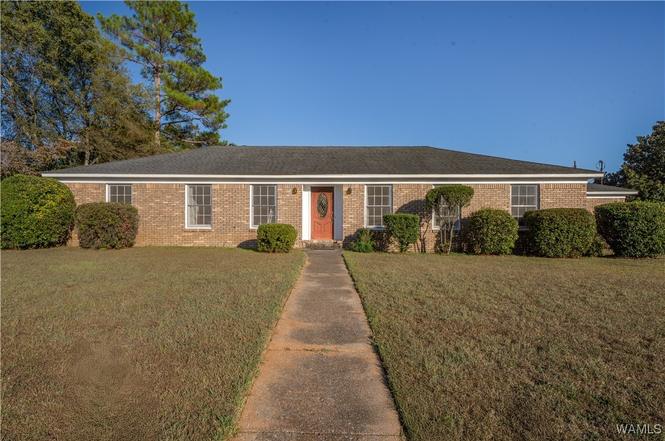
Nestled in the peaceful community of Morayshire Estates, this charming 3-bedroom, 2-bath all-brick home sits on a spacious corner lot with plenty of room for parking. Inside, you’ll find a welcoming foyer, formal dining room, cozy living room, and a den complete with a fireplace, perfect for relaxing on chilly evenings. Sit on the back patio and enjoy a flat, large backyard! There’s also a bonus room that can easily serve as a 4th bedroom, flex space, or home office to fit your needs. Major systems have been thoughtfully updated, the roof is less than 7 years old, and both the HVAC and hot water heater are under 5 years old, with an updated electrical system as well. Don’t
Key facts
- Large backyard
- Bonus room
- Updated hvac
Tags
Neighborhood map
What this means for you Summary
Snapshot
- This is a 4-bed/1.0-bath single-family listed at $218k.
Deal economics
- At list price, monthly cash flow is $442 ($5k/yr) — positive.
- The deal already cash-flows at list — no discount required.
- Meets the 1% rule at list price ($2k rent vs $218k).
- Recommended offer: $212k (3.0% below list) — sets the bar for market timing.
- Cap rate 8.7% vs local median 3.4% in Tuscaloosa — top-decile yield for the area; either an underpriced asset or a hidden risk that comps aren't pricing in. Stress-test before assuming the spread holds.
Location & tenants
- Location reads 77/100 on livability (#9 in AL, #2,909 nationally) — a middle-class / working-renter tenant base. Strengths: amenities A+, health & safety A+, cost of living A; Watch: crime F, employment D-.
- Tuscaloosa City (urban): math 19% / reading 40% proficiency, ranked #74 of 129 in AL (top 57%) — low school quality limits family demand, transient renter base, plan for 1-2y turnover.
- Zoned schools: Southview Elementary School (math 3% / reading 26%, grade F, #528 of 627 statewide, top 84%, 713 students, 71% FRL); Eastwood Middle School (math 3% / reading 31%, grade F, #201 of 257 statewide, top 79%, 758 students, 78% FRL); Paul W Bryant High School (math 3% / reading 7%, grade F, #276 of 305 statewide, top 95%, 1,042 students, 48% FRL).
- Zoned-school proficiency averages 12% at this address vs 30% district-wide (-17 pts) — the specific schools serving this property underperform the Tuscaloosa City average; the district grade overstates school quality for this exact location.
- Market conditions: Rents rising fast (+5.4%/yr); 457 active listings in the ZIP; 8 comparable units currently listed for rent nearby; rentals lingering (median 44d on market — plan ~5-8 weeks vacancy on turnover, expect pricing pressure); 62% of comp listings sitting > 30 days — soft ceiling on asking rent; 622 units permitted in Tuscaloosa County in 2024 (69 in 5+ unit buildings).
Forward outlook
- Local home prices are declining (-3.0%/yr); year-one equity from $2k of loan paydown is wiped out by about $7k of value loss. Plan a longer hold.
- Tuscaloosa County population projected at +26% by 2050 — long-run rental-demand tailwind backs the buy-and-hold thesis.
- At projected returns (-3.0% appreciation + 5.4% rent growth), your $61k cash investment doubles in ~10 years — after that, you're playing with house money.
Negotiation context
- It's been on market 50 days — a 3% lower offer ($212k) is reasonable based on typical stale-listing flexibility.
- 3 sale attempts since 6y ago with the ask held roughly flat each time — persistent listings suggest the price (not the market) is what's stuck; bring a comps-based counter.
- Current owner paid $117k; list at $218k implies a 87% gain — meaningful room to come down on a strong offer.
Risks & watch-outs
- Climate carrying-cost: major wind risk, 56% chance of damaging wind over 30y; extreme-heat days projected 7→21/yr by 2055 (HVAC capex compounding) — expect insurance premiums to compound above CPI over the hold.
Questions for the listing agent
- It's been on market 50 days. Have you received any prior offers? Is the seller open to a 3% concession, seller financing, or rate buy-down credit?
- Built in 1970 — when were the roof, HVAC, electrical panel, plumbing, and water heater last replaced?
- Is there a deadline driving the sale (1031 exchange, divorce, estate, relocation)? That informs how much negotiation room exists.
- Crime grade is F in this area — have there been break-ins, vandalism, or insurance claims at this property in the last 3 years? What carrier currently insures it and at what premium?
- What's the average days-on-market for RENTAL listings here right now (not sales)? A rising rental-DOM trend means longer vacancies and softer asking-rent achievability than the comps imply.
- What's the recent tenant-quality profile in this submarket — average credit score on applications, eviction rate, late-payment / NSF rate, and stable-employment percentage? A property-management company in the area should have these aggregated.
- How much new for-sale + rental construction is in the pipeline within 1–3 miles? Heavy new supply typically softens prices + rents 12–24 months out; constrained supply supports both.
Investment metrics
- 1% rule
- 1.01% ✓
- Cap rate
- 8.72%
- Cash-on-cash
- 8.67%
- DSCR
- 1.39
- GRM
- 8.2
CMA / ARV
- ARV (on-the-fly)
- $283,095
- Comps found
- 7
Show comp detail 7 sales within ~0.75 mi
| Address | Dist | Beds/Ba | Sqft | Sold | Price | $/sf | Match |
|---|---|---|---|---|---|---|---|
| 5729 Kew Ln | 0.00mi | 4/2.0 | 2,097 (0%) | 1mo | $225,000 | $107 | 95 |
| 6504 10th Ct | 0.56mi | 4/2.0 | 2,242 (+7%) | 0mo | $301,000 | $134 | 58 |
| 1219 Montrose Dr | 0.12mi | 4/2.5 | 2,383 (+14%) | 14mo | $265,000 | $111 | 54 |
| 1548 Ozier Dr | 0.58mi | 3/2.0 (-1) | 2,264 (+8%) | 3mo | $361,500 | $160 | 48 |
| 6400 Plantation Ct | 0.56mi | 3/2.0 (-1) | 1,857 (-11%) | 10mo | $250,000 | $135 | 38 |
| 820 66th St | 0.69mi | 3/2.0 (-1) | 1,843 (-12%) | 4mo | $280,000 | $152 | 35 |
| 1660 Arborway Cir | 0.61mi | 4/3.0 | 2,386 (+14%) | 22mo | $384,900 | $161 | 22 |
Match score weights: distance 35% · size 25% · config 20% · recency 20%. Top-matched comps best support the ARV.
Projected returns pro-forma
-3.0% appreciation · 5.42% rent growth · sell at horizon
- IRR
- -0.8%
- Equity multiple
- 0.97×
- Total profit
- $-1,818
- Equity at exit
- $32,579
- IRR
- 11.1%
- Equity multiple
- 1.95×
- Total profit
- $58,098
- Equity at exit
- $18,892
Cash invested: $61,180 (down + closing). Projections, not guarantees.
Landlord ↔ Tenant lean methodology
- Overall (STATE)
- 90 Strongly Landlord-Friendly
- State Alabama
- 90 Strongly Landlord-Friendly · R+15
- County
- — inherits STATE
- City
- — inherits STATE
ZIP-level market 35405
- Home prices YoY
- -26.9%
- Rents YoY
- 5.4%
- Active inventory
- 457
- Price-to-rent
- 8.2×
Monthly cashflow live
- Estimated rent
- $2,213 high interval (Pro) →
- Mortgage (P&I)
- −$1,146
- Tax from tax record
- −$69 /mo · $826/yr
- Insurance
- −$91
- HOA
- −$0
- Vacancy / Maint / Mgmt
- −$465
- Net cashflow
- $442
Break-even live
UW: 25.0% down · 7.5% · 30yr · 1.5% tax · 5.0% vac · 8.0% maint · 8.0% mgmt
Financing live
Cash to close
- Down payment
- $54,625
- Closing costs
- $6,555
- Reserves months
- —
- Total cash needed
- —
Loan-product check · same deal, 3 products live
Conventional
25% down · 7.5% · 30yr
- Down + closing
- —
- Monthly P&I
- —
- Monthly cashflow
- —
- DSCR
- —
- Eligible?
- —
Personal DTI + credit; lowest rate.
DSCR
20% down · 8.5% · 30yr
- Down + closing
- —
- Monthly P&I
- —
- Monthly cashflow
- —
- DSCR
- —
- Eligible?
- —
No personal income docs; deal must DSCR.
Hard money
10% down · 12.0% · 12mo
- Down + closing
- —
- Monthly P&I
- —
- Monthly cashflow
- —
- DSCR
- —
- Eligible?
- —
Short-term bridge; refi at stabilization.
Rent comps 8 comps
| Address | Beds | Baths | Sqft | Rent | $/sqft | DOM | Units | Dist |
|---|---|---|---|---|---|---|---|---|
| 1092 Stonebrook Ln Tuscaloosa, AL | 3.0 | 2.5 | 1745 | $2,450 | $1.40 | 43d | 1 | 0.87mi |
| 984 Stonebrook Ln Tuscaloosa, AL | 3.0 | 2.5 | 1745 | $2,450 | $1.40 | 43d | 1 | 0.89mi |
| 820 Stonebrook Ln Tuscaloosa, AL | 3.0 | 2.5 | 1745 | $2,450 | $1.40 | 43d | 1 | 0.91mi |
| 1009 Stonebrook Ln Tuscaloosa, AL | 3.0 | 2.5 | 1745 | $2,450 | $1.40 | 43d | 1 | 0.92mi |
| 815 Stonebrook Cir Tuscaloosa, AL | 3.0 | 2.5 | 1745 | $2,450 | $1.40 | 43d | 1 | 0.96mi |
| 801 Stonebrook Cir Tuscaloosa, AL | 2.0–3.0 | 2.0–2.5 | 1397 | $2,500 | $1.79 | 20d | 11 | 0.97mi |
| 8002 Shadesbrook Dr Tuscaloosa, AL | 3.0 | 2.0 | 1620 | $1,510 | $0.93 | 20d | 1 | 1.15mi |
| 8005 Shadesbrook Dr Tuscaloosa, AL | 4.0 | 2.0 | 1620 | $1,995 | $1.23 | 13d | 1 | 1.16mi |
Listing history 7 events
-
2025-12-26status Pending
-
2025-12-04status Active
-
2025-12-04price $218,500
-
2025-11-13status Pending
-
2025-10-15$225,000 Active
-
2020-05-01$218,900
-
2008-04-09soldstatus $117,000
ⓘ Source: listings_history table (triggers on properties + properties_extension) + one-shot
backfill from property_details.listing_events for pre-trigger history.
Tax reassessment forecast AL · Resets to sale price
- Current annual tax
- $826 · $69/mo
- Projected year-2 tax
- $896 · $75/mo
- Expected delta
- +$70/yr (+$6/mo · 8.4%)
ⓘ Screening estimate from a state-policy table — verify with the county assessor before closing.
Climate risk First Street
- Flood 1/10 Low FEMA zone X (unshaded) · 0% chance over 30 yrs
- Wildfire 2/10 Low
- Heat 7/10 Severe 7 d/yr ≥108°F today · 21 d/yr by 30 yrs out
- Wind 6/10 Major 56% chance of damaging wind over 30 yrs
- Air quality 1/10 Low 0 unhealthy d/yr today · 0 by 30 yrs out
Nearby sold comps map
Loading sold comps map…
Walkable amenities ~0.75 mi
Loading nearby amenities…
Taxation est. · year 1
- Rental income
- $26,550
- − Mortgage interest
- −$12,239
- − Property taxes
- −$826
- − Insurance
- −$1,092
- − Repairs & maintenance
- −$2,124
- − Management
- −$2,124
- − Depreciation
- −$6,356
- Taxable income
- $1,788
- Est. tax owed @ 24.0%
- −$429
- After-tax cash flow
- $4,877/yr
For passive investors: Depreciation is non-cash, so a rental often shows a tax loss while cash-flowing — sheltering income. Rental losses are passive: they offset passive income freely, and up to $25,000/yr can offset ordinary (W-2) income if you actively participate and your MAGI is under $100k (phasing out to $0 by $150k); unused losses carry forward. On sale, claimed depreciation is recaptured at up to 25%, and gains may owe capital-gains tax (a 1031 exchange can defer both). Figures are a year-1 estimate at your 24.0% rate — not tax advice; consult a CPA.
Schools (NCES district)
- District
- Tuscaloosa City
- NCES district ID
- 0103360
- Math proficiency
- 19% ▼ -24.00%
- Reading proficiency
- 40% ▼ -1.00%
- Median HH income
- $37,474
- Composite
- 24.51/100
- National rank
- #7647
- State rank
- #74 of 129 in AL
Livability — Tuscaloosa
- Score
- 77/100
- State rank
- #9
- US rank
- #2909
Category grades
Schools grade is shown separately in the Schools card above.
Census & demographics
- Census place
- Tuscaloosa, AL
- County
- Tuscaloosa County · 206,491 people
- City population
- 134,228
- Metro
- Tuscaloosa, AL
- Population (ZIP)
- 49,420
- Household income
- $62,301
- Rent vs Own
- Severe rent burden
- 1963.0
Population outlook (Tuscaloosa County) Hauer SSP2
- Today (2025)
- 228,293 people
- By 2030
- 240,551 · +5.4%
- By 2040
- 263,856 · +15.6%
- By 2050
- 286,491 · +25.5%
- By 2075
- 335,783 · +47.1%
- By 2100
- 370,520 · +62.3%
Race, ethnicity, and origin ACS 2023
- Neighborhood character
- Diverse neighborhood (Simpson 0.56)
- Race & ethnicity
- Black 56% White 35% Hispanic / Latino 5% Two or more races 3% Asian 2%
- Hispanic origin (detail)
- Mexican 2%
- Common ancestry
- Italian 1% Lithuanian 1% Slovak 1%
- Foreign-born
- 5% · Canada, China
- Languages at home
- 94% English-only · Spanish 4% Other Indo-European 1% Chinese 1%
Political lean MEDSL · Tuscaloosa
- 2024 margin
- Strong R (+20.4) · D 39.4% · R 59.8%
- 2008→2024 swing
- -4.4pp toward R · 2008: -16.0pp · 2024: -20.4pp
- All cycles
- 2024: R+20.4 2020: R+14.8 2016: R+19.5 2012: R+17.4 2008: R+16.0
Not yet ingested
- Civics
- —
Market trends
- HPI YoY
- ▼ -71.25%
- Current HPI
- 193.1929
- Rent YoY
- ▲ 5.42%
- Metro
- Tuscaloosa, AL
- State GDP YoY
- ▲ 2.94%
- F500 in state
- 4
Industry mix (Fortune 500 HQ in AL)
| Industry | F500 HQs | Revenue |
|---|---|---|
| Financial Services | 1 | $8B |
|
||
| Healthcare | 1 | $5B |
|
||
Price history
+86.8% since first listed7 events — show timeline
- 2025-12-26 Pending — WAMLS
- 2025-12-04 Relisted — WAMLS
- 2025-12-04 Price Changed $218,500 WAMLS
- 2025-11-13 Pending — WAMLS
- 2025-10-15 Listed $225,000 WAMLS
- 2020-05-01 Listed $218,900 WAMLS
- 2008-04-09 Sold (Public Records) $117,000 Public Records
Property tax history
+3.6%/yrLatest (2025): $826 · +6.9% YoY. Source: county tax records.
Cash-flow waterfall
monthlySold comps — $/sqft
last 12 mo · ≤1 miLoading sold comps…