 Triplex
2-6 Pond Ter · Millbury, MA
Flood risk 1/10 · Minimal
- FEMA flood zone
- X (unshaded)
- Chance of flooding over 30 yrs
- 0.0%
- Est. flood insurance / yr
- $507 – $1,088
Fire risk 1/10 · Minimal
- Est. fire insurance / yr
- $915 – $1,699
Heat risk 4/10 · Minor
- Hot days now (above 94°F)
- 7 days/yr
- Hot days in 30 yrs
- 16 days/yr
Wind risk 6/10 · Moderate
- Chance of severe wind over 30 yrs
- 27.0%
Air-quality risk 2/10 · Minimal
- Unhealthy air days now
- 1 days/yr
- Unhealthy air days in 30 yrs
- 2 days/yr
Risk factors via First Street. Map © Google.
Why this score? — see what drove the B grade
The composite is a weighted blend of 9 inputs, each scored 0–100. Each bar is that input's sub-score; the figure is the points it added to the 100-point composite (weight × sub-score).
- Cash flow +30.0/30.0
- 1% rule +10.0/10.0
- DSCR +10.0/10.0
- ARV discount +7.5/15.0
- Condition / age +4.0/5.0
- Schools +3.7/10.0
- Rent growth +2.5/5.0
- Livability +2.5/5.0
- Appreciation +0.0/10.0
$489,900
🖨 Deal sheet 📄 Offer letter ✓ Due diligence
Multi-family units
County records classify this as Multi-Family (2-4 Unit). Listing-text estimate: 3 units. confirmed
Listing remarks
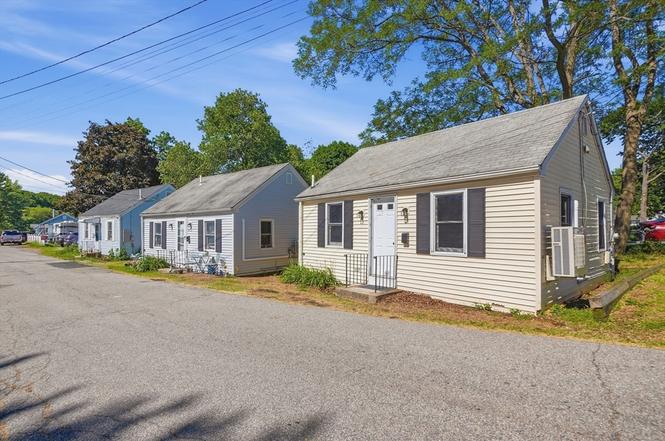
Rare opportunity to own a truly unique multifamily property featuring three standalone cottages directly across from Dorothy Pond in Millbury! Each cottage offers comfortable single-level living with its own bedroom, living room, kitchen, bath, in-unit laundry, and dedicated off-street parking space. Residents will enjoy beautiful water views! Recent updates include a mini-split replacement in Unit 6 (2023), while the mini-splits in Units 2 and 4 were serviced in 2025. Whether you're looking to expand your investment portfolio or own a one-of-a-kind income-producing property in a desirable lakeside setting, this is an opportunity you won't want to miss.
Key facts
- Water views
- Multifamily property
- In-unit laundry
Tags
Property features AI
Finance
- HOA & community: Community features: walk/jog trails, public school
Exterior
- Parking: Off-street, unpaved parking; 3 open parking spaces (total 3 spaces)
- Utilities: Public water; Public sewer; Electric with circuit breakers and 100 amp service; Electric hookups for range and dryer
- Home design: 3-family property; 3 stories; Above-grade finished area approx. 1440; Thermostat (energy efficient feature)
- Construction: Frame construction; Slab foundation; Shingle roof; Year built per public records
- Exterior features: Cleared, level lot; Paved road access; Lake/pond frontage/view; Has waterview (pond)
Interior
- Kitchen: Range; Refrigerator; Stone/granite/solid counters
- Bedrooms: Three 1-level units (unit-level details indicate each unit is single-level)
- Flooring: Vinyl
- Bathrooms: 3 full bathrooms
- Heating & cooling: Heat pump (provides heating and cooling); Electric heating
- Interior features: Stone/granite/solid counters; Bathroom with tub and shower; Living room; Kitchen; Insulated doors; Insulated windows; Total of 9 rooms
- Laundry & utility: Washer hookup; Electric dryer hookup; Washer and dryer included
Neighborhood map
What this means for you Summary
Snapshot
- This is a 3 × 3-bed/1.0-bath units multifamily listed at $490k. Condition is rated good.
Deal economics
- At list price, monthly cash flow is $3k ($32k/yr) — positive. Per door: $894/mo.
- The deal already cash-flows at list — no discount required.
- Meets the 1% rule at list price ($8k rent vs $490k).
Location & tenants
- Location reads: area grade B — affects rentability + tenant quality, not the cash-flow math above.
- Millbury (suburban): math 35% / reading 45% proficiency, ranked #191 of 302 in MA (top 63%) — families likely to look elsewhere, expect single-tenant / working-renter base with shorter leases.
- Market conditions: 23 active listings in the ZIP; high-income renter base; 2,293 units permitted in Worcester County in 2024 (1,205 in 5+ unit buildings).
- At $7,679/mo this rent would consume 78% of the median local household income ($119k/yr) (locally 238% of renters already pay >50% of income on rent) — very limited rent-growth headroom before tenants either downsize or default.
Forward outlook
- Local home prices are declining (-3.0%/yr); year-one equity from $3k of loan paydown is wiped out by about $15k of value loss. Plan a longer hold.
- At projected returns (-3.0% appreciation + 3.0% rent growth), your $137k cash investment doubles in ~6 years — after that, you're playing with house money.
Negotiation context
- Only 8 days on market — expect competitive offers; lowballing is unlikely to land.
Risks & watch-outs
- Watch-outs: built in 1950 — expect roof / HVAC / electrical / plumbing capex.
- Climate carrying-cost: major wind risk, 27% chance of damaging wind over 30y — expect insurance premiums to compound above CPI over the hold.
Questions for the listing agent
- Can we see the unit-by-unit rent roll, current vacancy, and any below-market leases? What's the average tenancy length?
- What capital expenditures (roof, boiler, parking lot, exteriors) have been made in the last 5 years, and what's planned in the next 2?
- Built in 1950 — when were the roof, HVAC, electrical panel, plumbing, and water heater last replaced?
- Is there a deadline driving the sale (1031 exchange, divorce, estate, relocation)? That informs how much negotiation room exists.
- What's the average days-on-market for RENTAL listings here right now (not sales)? A rising rental-DOM trend means longer vacancies and softer asking-rent achievability than the comps imply.
- What's the recent tenant-quality profile in this submarket — average credit score on applications, eviction rate, late-payment / NSF rate, and stable-employment percentage? A property-management company in the area should have these aggregated.
- How much new apartment / multifamily construction is in the pipeline within 1–3 miles? Heavy new supply (>2% of stock underway) typically softens rents 12–24 months out; light construction supports rent growth.
Investment metrics
- 1% rule
- 1.57% ✓
- Cap rate
- 12.86%
- Cash-on-cash
- 23.45%
- DSCR
- 2.04
- GRM
- 5.3
CMA / ARV
No comps found within radius.
Projected returns pro-forma
-3.0% appreciation · 3.0% rent growth · sell at horizon
- IRR
- 16.5%
- Equity multiple
- 1.67×
- Total profit
- $91,474
- Equity at exit
- $73,046
- IRR
- 25.1%
- Equity multiple
- 3.19×
- Total profit
- $299,983
- Equity at exit
- $42,358
Cash invested: $137,172 (down + closing). Projections, not guarantees.
Landlord ↔ Tenant lean methodology
- Overall (STATE)
- 20 Strongly Tenant-Friendly
- State Massachusetts
- 20 Strongly Tenant-Friendly · D+15
- County
- — inherits STATE
- City
- — inherits STATE
ZIP-level market 01527
- Home prices YoY
- -29.8%
- Active inventory
- 23
- Price-to-rent
- 15.9×
Monthly cashflow live
- Estimated rent
- $7,679 medium interval (Pro) →
- Mortgage (P&I)
- −$2,569
- Tax est. 1.5%
- −$612 /mo · $7,348/yr
- Insurance
- −$204
- HOA
- −$0
- Vacancy / Maint / Mgmt
- −$1,613
- Net cashflow
- $2,681
Break-even live
3-unit breakdown (identical units grouped — click to expand)
| Units | Beds | Baths | Est. rent |
|---|---|---|---|
| 3× units | 3 | 1 | $7,680 |
| #1 | 3 | 1 | $2,560 |
| #2 | 3 | 1 | $2,560 |
| #3 | 3 | 1 | $2,560 |
| Total (3 units) | $7,679 | ||
UW: 25.0% down · 7.5% · 30yr · 1.5% tax · 5.0% vac · 8.0% maint · 8.0% mgmt
Financing live
Cash to close
- Down payment
- $122,475
- Closing costs
- $14,697
- Reserves months
- —
- Total cash needed
- —
Loan-product check · same deal, 3 products live
Conventional
25% down · 7.5% · 30yr
- Down + closing
- —
- Monthly P&I
- —
- Monthly cashflow
- —
- DSCR
- —
- Eligible?
- —
Personal DTI + credit; lowest rate.
DSCR
20% down · 8.5% · 30yr
- Down + closing
- —
- Monthly P&I
- —
- Monthly cashflow
- —
- DSCR
- —
- Eligible?
- —
No personal income docs; deal must DSCR.
Hard money
10% down · 12.0% · 12mo
- Down + closing
- —
- Monthly P&I
- —
- Monthly cashflow
- —
- DSCR
- —
- Eligible?
- —
Short-term bridge; refi at stabilization.
Listing history 5 events
-
2026-06-18days on market $489,900 Active 8 DOM
-
2026-06-17days on market $489,900 Active 7 DOM
-
2026-06-15statusdays on market $489,900 Active 5 DOM
-
2026-06-14remarks 661-char remark
-
2026-06-14$489,900 New 3 DOM
ⓘ Source: listings_history table (triggers on properties + properties_extension) + one-shot
backfill from property_details.listing_events for pre-trigger history.
Climate risk First Street
- Flood 1/10 Low FEMA zone X (unshaded) · 0% chance over 30 yrs
- Wildfire 1/10 Low
- Heat 4/10 Moderate 7 d/yr ≥94°F today · 16 d/yr by 30 yrs out
- Wind 6/10 Major 27% chance of damaging wind over 30 yrs
- Air quality 2/10 Low 1 unhealthy d/yr today · 2 by 30 yrs out
Nearby sold comps map
Loading sold comps map…
Walkable amenities ~0.75 mi
Loading nearby amenities…
Taxation est. · year 1
- Rental income
- $92,148
- − Mortgage interest
- −$27,442
- − Property taxes
- −$7,348
- − Insurance
- −$2,450
- − Repairs & maintenance
- −$7,372
- − Management
- −$7,372
- − Depreciation
- −$14,252
- Taxable income
- $25,913
- Est. tax owed @ 24.0%
- −$6,219
- After-tax cash flow
- $25,951/yr
For passive investors: Depreciation is non-cash, so a rental often shows a tax loss while cash-flowing — sheltering income. Rental losses are passive: they offset passive income freely, and up to $25,000/yr can offset ordinary (W-2) income if you actively participate and your MAGI is under $100k (phasing out to $0 by $150k); unused losses carry forward. On sale, claimed depreciation is recaptured at up to 25%, and gains may owe capital-gains tax (a 1031 exchange can defer both). Figures are a year-1 estimate at your 24.0% rate — not tax advice; consult a CPA.
Condition & rehab AI · 12 photos
This multifamily property features three standalone cottages with recent updates to mini-splits and is in good condition, ready for a new owner.
Value-add opportunities
- Both Paint exterior siding — Enhances curb appeal and property value.
- Both Clean gutters — Improves drainage and property value.
- Both Replace mini-splits if needed — Ensures efficient heating and cooling, improving comfort and property value.
Renovation cost estimate screening
Value-add ROI direction
- Both Paint exterior siding — Enhances curb appeal and property value. ↑
- Both Clean gutters — Improves drainage and property value. ↑
- Both Replace mini-splits if needed — Ensures efficient heating and cooling, improving comfort and property value. ↑
ⓘ Cost ranges are severity-bucket heuristics (US national rule-of-thumb). Get contractor quotes + a written scope before underwriting a rehab budget.
Schools (NCES district)
- District
- Millbury
- NCES district ID
- 2507890
- Math proficiency
- 35% ▼ -6.00%
- Reading proficiency
- 45% ▬ 0.00%
- Median HH income
- $71,881
- Composite
- 36.55/100
- National rank
- #4640
- State rank
- #191 of 302 in MA
Livability — Millbury
No livability data for this city. (Only ~50 U.S. cities are tracked.)
Census & demographics
- County
- Worcester County · 487,911 people
- City population
- 13,961
- Metro
- Worcester, MA-CT
- Population (ZIP)
- 13,961
- Household income
- $118,790
- Rent vs Own
- Severe rent burden
- 238.0
Population outlook (Worcester County) Hauer SSP2
- Today (2025)
- 850,858 people
- By 2030
- 860,403 · +1.1%
- By 2040
- 869,902 · +2.2%
- By 2050
- 869,110 · +2.1%
- By 2075
- 870,120 · +2.3%
- By 2100
- 829,703 · -2.5%
Race, ethnicity, and origin ACS 2023
- Neighborhood character
- Predominantly White (83%)
- Race & ethnicity
- White 83% Two or more races 10% Hispanic / Latino 5% Asian 5%
- Hispanic origin (detail)
- Dominican 1%
- Common ancestry
- Lithuanian 12% Romanian 9% Russian 3%
- Foreign-born
- 9% · Canada
- Languages at home
- 90% English-only · Other Indo-European 6% Spanish 2% Russian/Polish/Slavic 1%
Political lean MEDSL · Worcester
- 2024 margin
- D (+10.0) · D 53.9% · R 43.9% · Other 2.2%
- 2008→2024 swing
- -3.8pp toward R · 2008: 13.8pp · 2024: 10.0pp
- All cycles
- 2024: D+10.0 2020: D+17.8 2016: D+10.5 2012: D+9.2 2008: D+13.8
Not yet ingested
- Civics
- —
Market trends
- HPI YoY
- ▼ -114.98%
- Current HPI
- 271.2616
- Rent YoY
- —
- Metro
- Worcester, MA-CT
- State GDP YoY
- ▲ 2.28%
- F500 in state
- 38
Industry mix (Fortune 500 HQ in MA)
| Industry | F500 HQs | Revenue |
|---|---|---|
| Technology | 3 | $17B |
|
||
| Insurance | 2 | $84B |
|
||
| Retail | 2 | $76B |
|
||
| Life Sciences | 1 | $43B |
|
||
| Energy Technology | 1 | $31B |
|
||
| Aerospace / Defense | 1 | $18B |
|
||
Price history
1 event — show timeline
- 2026-06-10 Listed $489,900 MLS PIN
Cash-flow waterfall
monthlySold comps — $/sqft
last 12 mo · ≤1 miLoading sold comps…