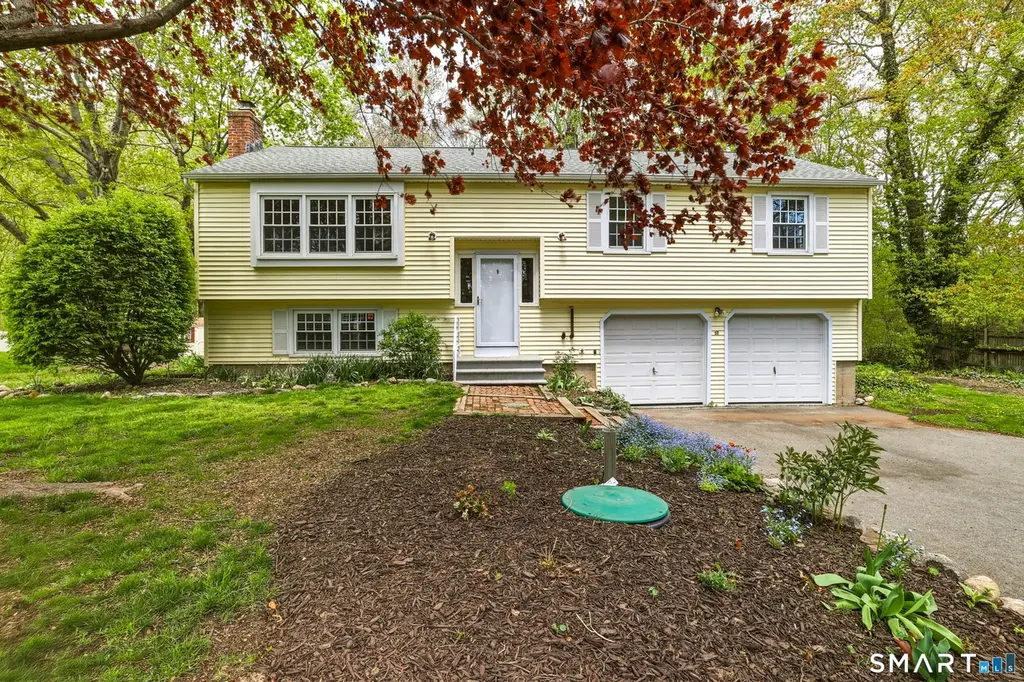
10 Salem Rd · Madison, CT
Flood risk 4/10 · Minor
- FEMA flood zone
- X (unshaded)
- Chance of flooding over 30 yrs
- 0.22%
- Est. flood insurance / yr
- $507 – $1,088
Fire risk 1/10 · Minimal
- Est. fire insurance / yr
- $829 – $1,539
Heat risk 6/10 · Moderate
- Hot days now (above 93°F)
- 7 days/yr
- Hot days in 30 yrs
- 17 days/yr
Wind risk 6/10 · Moderate
- Chance of severe wind over 30 yrs
- 72.0%
Air-quality risk 5/10 · Moderate
- Unhealthy air days now
- 5 days/yr
- Unhealthy air days in 30 yrs
- 8 days/yr
Risk factors via First Street. Map © Google.
Why this score? — see what drove the B+ grade
The composite is a weighted blend of 9 inputs, each scored 0–100. Each bar is that input's sub-score; the figure is the points it added to the 100-point composite (weight × sub-score).
- Cash flow +30.0/30.0
- ARV discount +15.0/15.0
- 1% rule +10.0/10.0
- DSCR +10.0/10.0
- Schools +6.6/10.0
- Rent growth +2.5/5.0
- Livability +2.5/5.0
- Condition / age +2.5/5.0
- Appreciation +0.0/10.0
$460,000
🖨 Deal sheet 📄 Offer letter ✓ Due diligence
Listing remarks
Welcome to this well-maintained home offering a flexible layout and thoughtful updates throughout. Step into a welcoming foyer that opens into a bright living room filled with natural light from multiple windows. From here, the layout flows seamlessly into the dining area, where a partial wall creates separation while maintaining an open, airy feel. Just beyond, the kitchen has been tastefully updated with quartz countertops, stainless steel appliances, an electric range, modern cabinetry, and a pantry, along with oversized windows that bring in an abundance of natural light. Down the hall, you'll find the home's bedrooms, including a primary bedroom with corner windows and a large closet,
Key facts
- 0.51 acre lot
- 2 garage spots
- Built 1973
Property features AI
Finance
- Other: Subject to inland-wetland restrictions
Exterior
- Parking: Under-house garage; 2-car garage; Paved driveway; Total of 4 parking spaces
- Utilities: Public water connected; Septic system; Oil hot water heater (fuel tank in garage); Thermopane windows
- Home design: Single-family home; Yellow exterior siding
- Construction: Frame construction; Vinyl siding; Concrete foundation; Asphalt shingle roof
- Exterior features: Gutters; Covered deck; Stone wall; Electric pet fence; Lightly wooded, level and cleared yard; Located in a subdivision; Brook with view and access
Interior
- Kitchen: Oven/Range; Refrigerator; Dishwasher
- Bedrooms: 3 bedrooms
- Bathrooms: 2 full bathrooms
- Heating & cooling: Baseboard and hot water heating with zoned controls; Oil-fired hot water system
- Interior features: Open floor plan; Foyer; Has attic with pull-down stairs; Possible in-law apartment with lower level access; One fireplace; Basement finished, heated, full and livable with interior and garage access
- Laundry & utility: Laundry in garage on lower level
Neighborhood map
What this means for you Summary
Snapshot
- This is a 4-bed/1.5-bath single-family listed at $460k.
Deal economics
- At list price, monthly cash flow is $5k ($58k/yr) — positive.
- The deal already cash-flows at list — no discount required.
- Meets the 1% rule at list price ($10k rent vs $460k).
- Recommended offer: $453k (1.5% below list) — sets the bar for market timing.
Location & tenants
- Location reads: area grade B — affects rentability + tenant quality, not the cash-flow math above.
- Madison School District (suburban): math 69% / reading 75% proficiency, ranked #10 of 153 in CT (top 6%) — strong family-tenant draw, lease renewals of 3-5y typical; only 3% free/reduced lunch — higher-income household profile.
- Zoned schools: Daniel Hand High School (math 69% / reading 86%, grade A-, #8 of 194 statewide, top 4%, 828 students, 5% FRL) — zoned schools at 5% FRL track the district average.
- Market conditions: 105 active listings in the ZIP; 3 comparable units currently listed for rent nearby; rentals lingering (median 44d on market — plan ~5-8 weeks vacancy on turnover, expect pricing pressure); 100% of comp listings sitting > 30 days — soft ceiling on asking rent; 1,059 units permitted in South Central Connecticut Planning Region in 2024 (779 in 5+ unit buildings).
Forward outlook
- Local home prices are declining (-3.0%/yr); year-one equity from $3k of loan paydown is wiped out by about $14k of value loss. Plan a longer hold.
- At projected returns (-3.0% appreciation + 3.0% rent growth), your $129k cash investment doubles in ~3 years — after that, you're playing with house money.
Negotiation context
- It's been on market 25 days — a 2% lower offer ($453k) is reasonable based on typical stale-listing flexibility.
- 3 sale attempts with the ask held roughly flat each time — persistent listings suggest the price (not the market) is what's stuck; bring a comps-based counter.
Risks & watch-outs
- Climate carrying-cost: major wind risk, 72% chance of damaging wind over 30y; extreme-heat days projected 7→17/yr by 2055 (HVAC capex compounding) — expect insurance premiums to compound above CPI over the hold.
Questions for the listing agent
- Built in 1973 — when were the roof, HVAC, electrical panel, plumbing, and water heater last replaced?
- Is there a deadline driving the sale (1031 exchange, divorce, estate, relocation)? That informs how much negotiation room exists.
- What's the average days-on-market for RENTAL listings here right now (not sales)? A rising rental-DOM trend means longer vacancies and softer asking-rent achievability than the comps imply.
- What's the recent tenant-quality profile in this submarket — average credit score on applications, eviction rate, late-payment / NSF rate, and stable-employment percentage? A property-management company in the area should have these aggregated.
- How much new for-sale + rental construction is in the pipeline within 1–3 miles? Heavy new supply typically softens prices + rents 12–24 months out; constrained supply supports both.
Investment metrics
- 1% rule
- 2.17% ✓
- Cap rate
- 18.95%
- Cash-on-cash
- 45.20%
- DSCR
- 3.01
- GRM
- 3.8
CMA / ARV
- ARV (median comp)
- $556,344
- List price
- $460,000
- Delta
- -17.32%
- Verdict
- UNDERPRICED
- Comps
- 20 within 1.0 mi
Show comp detail 3 sales within ~0.75 mi
| Address | Dist | Beds/Ba | Sqft | Sold | Price | $/sf | Match |
|---|---|---|---|---|---|---|---|
| 42 Neck Rd | 0.73mi | 3/1.5 (-1) | 1,288 (-0%) | 1mo | $520,000 | $404 | 60 |
| 23 Salem Rd | 0.07mi | 3/2.5 (-1) | 1,404 (+9%) | 23mo | $250,000 | $178 | 54 |
| 29 Johnson Ln | 0.29mi | 4/2.0 | 1,470 (+14%) | 23mo | $501,000 | $341 | 42 |
Match score weights: distance 35% · size 25% · config 20% · recency 20%. Top-matched comps best support the ARV.
Projected returns pro-forma
-3.0% appreciation · 3.0% rent growth · sell at horizon
- IRR
- 42.3%
- Equity multiple
- 2.82×
- Total profit
- $234,509
- Equity at exit
- $68,587
- IRR
- 48.4%
- Equity multiple
- 5.68×
- Total profit
- $602,328
- Equity at exit
- $39,772
Cash invested: $128,800 (down + closing). Projections, not guarantees.
Landlord ↔ Tenant lean methodology
- Overall (STATE)
- 27 Tenant-Leaning
- State Connecticut
- 27 Tenant-Leaning · D+7
- County
- — inherits STATE
- City
- — inherits STATE
ZIP-level market 06443
- Active inventory
- 105
- Price-to-rent
- 3.8×
Monthly cashflow live
- Estimated rent
- $9,982 medium interval (Pro) →
- Mortgage (P&I)
- −$2,412
- Tax from tax record
- −$430 /mo · $5,164/yr
- Insurance
- −$192
- HOA
- −$0
- Vacancy / Maint / Mgmt
- −$2,096
- Net cashflow
- $4,851
Break-even live
UW: 25.0% down · 7.5% · 30yr · 1.5% tax · 5.0% vac · 8.0% maint · 8.0% mgmt
Financing live
Cash to close
- Down payment
- $115,000
- Closing costs
- $13,800
- Reserves months
- —
- Total cash needed
- —
Loan-product check · same deal, 3 products live
Conventional
25% down · 7.5% · 30yr
- Down + closing
- —
- Monthly P&I
- —
- Monthly cashflow
- —
- DSCR
- —
- Eligible?
- —
Personal DTI + credit; lowest rate.
DSCR
20% down · 8.5% · 30yr
- Down + closing
- —
- Monthly P&I
- —
- Monthly cashflow
- —
- DSCR
- —
- Eligible?
- —
No personal income docs; deal must DSCR.
Hard money
10% down · 12.0% · 12mo
- Down + closing
- —
- Monthly P&I
- —
- Monthly cashflow
- —
- DSCR
- —
- Eligible?
- —
Short-term bridge; refi at stabilization.
Rent comps 3 comps
| Address | Beds | Baths | Sqft | Rent | $/sqft | DOM | Units | Dist |
|---|---|---|---|---|---|---|---|---|
| 122 Taylor Ave Madison, CT | 3.0 | 1.5 | 1418 | $11,000 | $7.76 | 43d | 1 | 1.10mi |
| 147 Overshores W Madison, CT | 4.0 | 2.0 | 1574 | $15,000 | $9.53 | 43d | 1 | 1.10mi |
| 32 Bassett Ln Madison, CT | 4.0 | 2.0 | 1530 | $3,400 | $2.22 | 43d | 1 | 1.22mi |
Listing history 14 events
-
2026-06-18days on market $460,000 Active 25 DOM
-
2026-06-17days on market $460,000 Active 24 DOM
-
2026-06-16days on market $460,000 Active 23 DOM
-
2026-06-15days on market $460,000 Active 22 DOM
-
2026-06-13statusdays on market $460,000 Active 20 DOM
-
2026-06-12days on market $460,000 Under Contract - Continue to Show 19 DOM
-
2026-06-09days on market $460,000 Under Contract - Continue to Show 16 DOM
-
2026-06-08days on market $460,000 Under Contract - Continue to Show 15 DOM
-
2026-06-07days on market $460,000 Under Contract - Continue to Show 14 DOM
-
2026-06-04days on market $460,000 Under Contract - Continue to Show 10 DOM
-
2026-06-03status $460,000 Under Contract - Continue to Show 9 DOM
-
2026-06-02status $460,000 Active 9 DOM
-
2026-05-14$460,000 Active 1285-char remark
-
2026-05-11historical $460,000 1285-char remark
ⓘ Source: listings_history table (triggers on properties + properties_extension) + one-shot
backfill from property_details.listing_events for pre-trigger history.
Tax reassessment forecast CT · Partial reset (capped growth)
- Current annual tax
- $5,164 · $430/mo
- Projected year-2 tax
- $7,504 · $625/mo
- Expected delta
- +$2,340/yr (+$195/mo · 45.3%)
ⓘ Screening estimate from a state-policy table — verify with the county assessor before closing.
Climate risk First Street
- Flood 4/10 Moderate FEMA zone X (unshaded) · 22% chance over 30 yrs
- Wildfire 1/10 Low
- Heat 6/10 Major 7 d/yr ≥93°F today · 17 d/yr by 30 yrs out
- Wind 6/10 Major 72% chance of damaging wind over 30 yrs
- Air quality 5/10 Major 5 unhealthy d/yr today · 8 by 30 yrs out
Nearby sold comps map
Loading sold comps map…
Walkable amenities ~0.75 mi
Loading nearby amenities…
Taxation est. · year 1
- Rental income
- $119,782
- − Mortgage interest
- −$25,767
- − Property taxes
- −$5,164
- − Insurance
- −$2,300
- − Repairs & maintenance
- −$9,583
- − Management
- −$9,583
- − Depreciation
- −$13,382
- Taxable income
- $54,004
- Est. tax owed @ 24.0%
- −$12,961
- After-tax cash flow
- $45,256/yr
For passive investors: Depreciation is non-cash, so a rental often shows a tax loss while cash-flowing — sheltering income. Rental losses are passive: they offset passive income freely, and up to $25,000/yr can offset ordinary (W-2) income if you actively participate and your MAGI is under $100k (phasing out to $0 by $150k); unused losses carry forward. On sale, claimed depreciation is recaptured at up to 25%, and gains may owe capital-gains tax (a 1031 exchange can defer both). Figures are a year-1 estimate at your 24.0% rate — not tax advice; consult a CPA.
Schools (NCES district)
- District
- Madison School District
- NCES district ID
- 0902280
- Math proficiency
- 69% ▲ 1.00%
- Reading proficiency
- 75% ▲ 2.00%
- Median HH income
- $103,788
- Composite
- 66.15/100
- National rank
- #435
- State rank
- #10 of 153 in CT
Livability — Madison
No livability data for this city. (Only ~50 U.S. cities are tracked.)
Census & demographics
- Population (ZIP)
- 17,577
Population outlook (South Central Connecticut County) Hauer SSP2
- By 2040
- 608,362
Race, ethnicity, and origin ACS 2023
- Neighborhood character
- Predominantly White (88%)
- Race & ethnicity
- White 88% Two or more races 5% Asian 4% Hispanic / Latino 3%
- Common ancestry
- Romanian 5% Lithuanian 3% Slovak 2%
- Foreign-born
- 9% · Canada, China
- Languages at home
- 92% English-only · Other Indo-European 2% Spanish 2% German/W. Germanic 1%
Political lean MEDSL · South Central Connecticut
- 2024 margin
- Strong D (+20.1) · D 59.0% · R 38.9% · Other 2.1%
- All cycles
- 2024: D+20.1
Not yet ingested
- Civics
- —
Market trends
- HPI YoY
- ▼ -375.58%
- Current HPI
- 242.8467
- Rent YoY
- —
- Metro
- —
- State GDP YoY
- ▲ 1.06%
- F500 in state
- 38
Industry mix (Fortune 500 HQ in CT)
| Industry | F500 HQs | Revenue |
|---|---|---|
| Industrial Machinery | 4 | $38B |
|
||
| Insurance | 3 | $71B |
|
||
| Financial Services | 2 | $25B |
|
||
| Transportation / Logistics | 2 | $18B |
|
||
| Healthcare | 1 | $247B |
|
||
| Telecommunications | 1 | $55B |
|
||
Price history
+0.0% since first listed6 events — show timeline
- 2026-06-12 Relisted — Smart MLS
- 2026-06-02 Contingent — Smart MLS
- 2026-06-02 Relisted — Smart MLS
- 2026-05-22 Pending — Smart MLS
- 2026-05-14 Listed $460,000 Smart MLS
- 2026-05-11 Coming Soon $460,000 Smart MLS
Property tax history
+1.6%/yrLatest (2023): $5,164 · +1.9% YoY. Source: county tax records.
Cash-flow waterfall
monthlySold comps — $/sqft
last 12 mo · ≤1 miLoading sold comps…