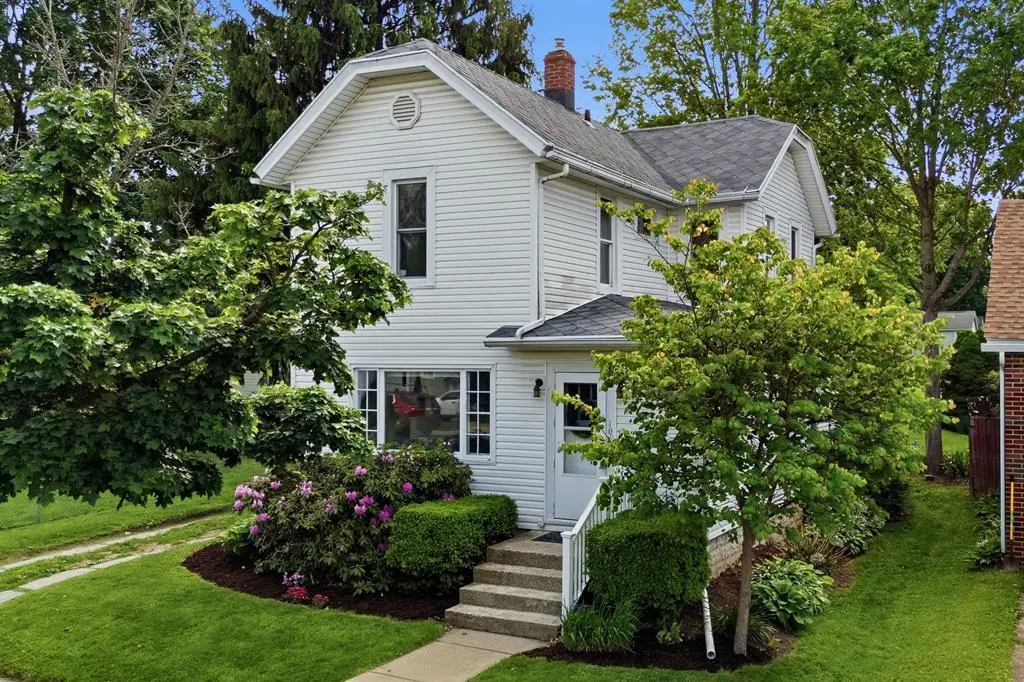
1010 Chestnut St · Ashland, OH
Flood risk 1/10 · Minimal
- FEMA flood zone
- X (unshaded)
- Chance of flooding over 30 yrs
- 0.0%
- Est. flood insurance / yr
- $473 – $860
Fire risk 1/10 · Minimal
- Est. fire insurance / yr
- $713 – $1,323
Heat risk 3/10 · Minor
- Hot days now (above 97°F)
- 7 days/yr
- Hot days in 30 yrs
- 16 days/yr
Wind risk 2/10 · Minimal
- Chance of severe wind over 30 yrs
- —
Air-quality risk 2/10 · Minimal
- Unhealthy air days now
- 1 days/yr
- Unhealthy air days in 30 yrs
- 2 days/yr
Risk factors via First Street. Map © Google.
Why this score? — see what drove the D+ grade
The composite is a weighted blend of 9 inputs, each scored 0–100. Each bar is that input's sub-score; the figure is the points it added to the 100-point composite (weight × sub-score).
- Cash flow +12.3/30.0
- ARV discount +11.6/15.0
- Schools +5.8/10.0
- Rent growth +4.3/5.0
- DSCR +3.7/10.0
- Livability +3.6/5.0
- 1% rule +2.9/10.0
- Condition / age +2.5/5.0
- Appreciation +0.0/10.0
$179,900
🖨 Deal sheet 📄 Offer letter ✓ Due diligence
Listing remarks
Welcome to this move-in ready 3-bedroom, 1.5-bath home located in one of Ashland's most desirable neighborhoods near Freer Field and Ashland University. Offering 1,500 square feet, this home features a functional layout with first-floor laundry, a convenient half bath, and a bonus office/flex room perfect for working from home, a playroom, or extra living space. Inside, you'll find large windows that fill the home with natural light along with character touches including arched doorways downstairs and hardwood flooring upstairs. The full bathroom has been recently updated, while the spacious yard provides plenty of room to enjoy the outdoors. This home is a great opportunity for first-time
Key facts
- Large windows
- Hardwood flooring
- First floor laundry
Tags
Property features AI
Finance
- Other: Zoned RA - Residential Districts
- HOA & community: No association amenities
Exterior
- Utilities: Public water; Public sewer
- Home design: Single-family residence; 2 stories
- Construction: Vinyl siding; Shingle roof
- Exterior features: Deck; Level lot; Paved road
Interior
- Kitchen: Includes dishwasher and oven
- Bedrooms: Total rooms: 7
- Bathrooms: 1 full bathroom; 1 half bathroom
- Heating & cooling: Forced air heating; Natural gas
- Interior features: Dishwasher; Oven; Gas water heater; No fireplace; Full basement
- Laundry & utility: Gas water heater
Neighborhood map
What this means for you Summary
Snapshot
- This is a 3-bed/1.5-bath single-family listed at $180k.
Deal economics
- At list price, monthly cash flow is $-33 ($-391/yr) — negative.
- To cash-flow at today's rent, offer at most $174k (3.2% below list).
- To meet the 1% rule (rent ≥ 1% of price), the offer needs to be $142k (21.0% below list).
- Recommended offer: $142k (21.0% below list) — sets the bar for 1% rule.
- Cap rate 6.1% vs local median 3.8% in Ashland — top-decile yield for the area; either an underpriced asset or a hidden risk that comps aren't pricing in. Stress-test before assuming the spread holds.
Location & tenants
- Location reads 72/100 on livability (#373 in OH) — a middle-class / working-renter tenant base. Strengths: cost of living A+, housing A+, crime B+; Watch: employment C-, amenities D-, commute F.
- Ashland City (town): math 70% / reading 69% proficiency, ranked #165 of 656 in OH (top 25%) — acceptable for families but not a draw, mixed tenant base, ~2y average lease.
- Market conditions: Rents rising fast (+7.1%/yr); 122 active listings in the ZIP; 6 comparable units currently listed for rent nearby; rentals lingering (median 44d on market — plan ~5-8 weeks vacancy on turnover, expect pricing pressure); 100% of comp listings sitting > 30 days — soft ceiling on asking rent; 61 units permitted in Ashland County in 2024 (0 in 5+ unit buildings).
Forward outlook
- Local home prices are declining (-3.0%/yr); year-one equity from $1k of loan paydown is wiped out by about $5k of value loss. Plan a longer hold.
- Ashland County population projected at -13% by 2050 — secular population decline; favor cash flow + early exit over multi-decade hold.
Negotiation context
- Only 4 days on market — expect competitive offers; lowballing is unlikely to land.
- Current owner paid $68k; list at $180k implies a 167% gain — meaningful room to come down on a strong offer.
Risks & watch-outs
- Watch-outs: built in 1928 — expect roof / HVAC / electrical / plumbing capex.
Questions for the listing agent
- What do current leases actually rent for vs. the listed asking? Can we see a recent rent roll and the last 12 months of T-12 income?
- Built in 1928 — when were the roof, HVAC, electrical panel, plumbing, and water heater last replaced?
- Is there a deadline driving the sale (1031 exchange, divorce, estate, relocation)? That informs how much negotiation room exists.
- Schools are B-rated — typically a magnet for longer-tenancy family renters. What's the average tenant stay here, and is there a school-zone premium baked into asking?
- The area grade is low — what's the realistic commute time and amenity access for the typical tenant pool here? Any planned neighborhood developments (good or bad) we should know about?
- What's the average days-on-market for RENTAL listings here right now (not sales)? A rising rental-DOM trend means longer vacancies and softer asking-rent achievability than the comps imply.
- What's the recent tenant-quality profile in this submarket — average credit score on applications, eviction rate, late-payment / NSF rate, and stable-employment percentage? A property-management company in the area should have these aggregated.
- How much new for-sale + rental construction is in the pipeline within 1–3 miles? Heavy new supply typically softens prices + rents 12–24 months out; constrained supply supports both.
Investment metrics
- 1% rule
- 0.79% ✗
- Cap rate
- 6.08%
- Cash-on-cash
- -0.78%
- DSCR
- 0.97
- GRM
- 10.5
CMA / ARV
- ARV (on-the-fly)
- $198,000
- Comps found
- 12
Show comp detail 12 sales within ~0.75 mi
| Address | Dist | Beds/Ba | Sqft | Sold | Price | $/sf | Match |
|---|---|---|---|---|---|---|---|
| 208 High St | 0.11mi | 3/2.0 | 1,528 (+2%) | 6mo | $185,000 | $121 | 85 |
| 207 Samaritan Ave | 0.05mi | 3/1.5 | 1,411 (-6%) | 7mo | $225,000 | $159 | 82 |
| 232 High St | 0.13mi | 3/2.0 | 1,594 (+6%) | 6mo | $182,500 | $114 | 77 |
| 145 College Ave | 0.17mi | 4/2.5 (+1) | 1,516 (+1%) | 6mo | $172,500 | $114 | 77 |
| 120 High St | 0.13mi | 3/1.5 | 1,346 (-10%) | 3mo | $177,500 | $132 | 75 |
| 224 Freer Ct | 0.37mi | 3/1.0 | 1,548 (+3%) | 8mo | $220,000 | $142 | 69 |
| 47 Samaritan Ave | 0.19mi | 3/1.5 | 1,681 (+12%) | 8mo | $230,000 | $137 | 64 |
| 1115 Broad St | 0.70mi | 4/2.0 (+1) | 1,492 (-0%) | 2mo | $220,000 | $147 | 58 |
| 113 E Liberty St | 0.40mi | 3/2.0 | 1,660 (+11%) | 4mo | $65,000 | $39 | 58 |
| 518 Cherry Ave | 0.65mi | 3/2.0 | 1,439 (-4%) | 5mo | $183,700 | $128 | 57 |
| 721 Heltman Ave | 0.54mi | 3/1.5 | 1,284 (-14%) | 8mo | $170,000 | $132 | 44 |
| 420 E Walnut St | 0.70mi | 3/2.0 | 1,322 (-12%) | 5mo | $150,000 | $113 | 42 |
Match score weights: distance 35% · size 25% · config 20% · recency 20%. Top-matched comps best support the ARV.
Projected returns pro-forma
-3.0% appreciation · 7.07% rent growth · sell at horizon
- IRR
- -13.4%
- Equity multiple
- 0.50×
- Total profit
- $-25,203
- Equity at exit
- $26,824
- IRR
- 0.6%
- Equity multiple
- 1.05×
- Total profit
- $2,284
- Equity at exit
- $15,554
Cash invested: $50,372 (down + closing). Projections, not guarantees.
Landlord ↔ Tenant lean methodology
- Overall (STATE)
- 73 Landlord-Friendly
- State Ohio
- 73 Landlord-Friendly · R+6
- County
- — inherits STATE
- City
- — inherits STATE
ZIP-level market 44805
- Rents YoY
- 7.1%
- Active inventory
- 122
- Price-to-rent
- 10.5×
Monthly cashflow live
- Estimated rent
- $1,421 high interval (Pro) →
- Mortgage (P&I)
- −$943
- Tax from tax record
- −$137 /mo · $1,642/yr
- Insurance
- −$75
- HOA
- −$0
- Vacancy / Maint / Mgmt
- −$298
- Net cashflow
- $-33
Break-even live
UW: 25.0% down · 7.5% · 30yr · 1.5% tax · 5.0% vac · 8.0% maint · 8.0% mgmt
Financing live
Cash to close
- Down payment
- $44,975
- Closing costs
- $5,397
- Reserves months
- —
- Total cash needed
- —
Loan-product check · same deal, 3 products live
Conventional
25% down · 7.5% · 30yr
- Down + closing
- —
- Monthly P&I
- —
- Monthly cashflow
- —
- DSCR
- —
- Eligible?
- —
Personal DTI + credit; lowest rate.
DSCR
20% down · 8.5% · 30yr
- Down + closing
- —
- Monthly P&I
- —
- Monthly cashflow
- —
- DSCR
- —
- Eligible?
- —
No personal income docs; deal must DSCR.
Hard money
10% down · 12.0% · 12mo
- Down + closing
- —
- Monthly P&I
- —
- Monthly cashflow
- —
- DSCR
- —
- Eligible?
- —
Short-term bridge; refi at stabilization.
Rent comps 6 comps
| Address | Beds | Baths | Sqft | Rent | $/sqft | DOM | Units | Dist |
|---|---|---|---|---|---|---|---|---|
| 510 Broad St Ashland, OH | 3.0 | 1.0 | 1681 | $1,650 | $0.98 | 44d | 1 | 0.52mi |
| 606 Edgehill Ave Ashland, OH | 4.0 | 2.0 | 1858 | $1,850 | $1.00 | 43d | 1 | 0.61mi |
| 200 Race St Unit 200 Ashland, OH | 2.0 | 1.0 | 1532 | $735 | $0.48 | 43d | 1 | 0.74mi |
| 332 Sloan Ave Ashland, OH | 3.0 | 1.5 | 1120 | $1,300 | $1.16 | 43d | 1 | 1.02mi |
| 917 Birch St Ashland, OH | 3.0 | 1.0 | 1116 | $1,175 | $1.05 | 43d | 1 | 1.12mi |
| 1520 County Road 995 Unit 995 Ashland, OH | 3.0 | 1.0 | 1060 | $1,299 | $1.23 | 43d | 1 | 1.32mi |
Listing history 2 events
-
2026-05-21$179,900 Active
-
2004-12-02soldstatus $67,500
ⓘ Source: listings_history table (triggers on properties + properties_extension) + one-shot
backfill from property_details.listing_events for pre-trigger history.
Tax reassessment forecast OH · Partial reset (capped growth)
- Current annual tax
- $1,642 · $137/mo
- Projected year-2 tax
- $2,224 · $185/mo
- Expected delta
- +$582/yr (+$48/mo · 35.4%)
ⓘ Screening estimate from a state-policy table — verify with the county assessor before closing.
Climate risk First Street
- Flood 1/10 Low FEMA zone X (unshaded) · 0% chance over 30 yrs
- Wildfire 1/10 Low
- Heat 3/10 Moderate 7 d/yr ≥97°F today · 16 d/yr by 30 yrs out
- Wind 2/10 Low
- Air quality 2/10 Low 1 unhealthy d/yr today · 2 by 30 yrs out
Nearby sold comps map
Loading sold comps map…
Walkable amenities ~0.75 mi
Loading nearby amenities…
Taxation est. · year 1
- Rental income
- $17,053
- − Mortgage interest
- −$10,077
- − Property taxes
- −$1,642
- − Insurance
- −$900
- − Repairs & maintenance
- −$1,364
- − Management
- −$1,364
- − Depreciation
- −$5,233
- Taxable loss
- −$3,528
- Est. tax savings @ 24.0%
- +$847
- After-tax cash flow
- $456/yr
For passive investors: Depreciation is non-cash, so a rental often shows a tax loss while cash-flowing — sheltering income. Rental losses are passive: they offset passive income freely, and up to $25,000/yr can offset ordinary (W-2) income if you actively participate and your MAGI is under $100k (phasing out to $0 by $150k); unused losses carry forward. On sale, claimed depreciation is recaptured at up to 25%, and gains may owe capital-gains tax (a 1031 exchange can defer both). Figures are a year-1 estimate at your 24.0% rate — not tax advice; consult a CPA.
Schools (NCES district)
- District
- Ashland City
- NCES district ID
- 3904350
- Math proficiency
- 70% ▼ -2.00%
- Reading proficiency
- 69% ▼ -4.00%
- Median HH income
- $43,164
- Composite
- 58.31/100
- National rank
- #1015
- State rank
- #165 of 656 in OH
Livability — Ashland
- Score
- 72/100
- State rank
- #373
- US rank
- #6095
Category grades
Schools grade is shown separately in the Schools card above.
Census & demographics
- Census place
- Ashland, OH
- County
- Ashland County · 30,805 people
- City population
- 30,805
- Metro
- Ashland, OH
- Population (ZIP)
- 30,805
- Household income
- $68,299
- Rent vs Own
- Severe rent burden
- 706.0
Population outlook (Ashland County) Hauer SSP2
- Today (2025)
- 52,732 people
- By 2030
- 51,728 · -1.9%
- By 2040
- 48,956 · -7.2%
- By 2050
- 46,070 · -12.6%
- By 2075
- 38,945 · -26.1%
- By 2100
- 30,883 · -41.4%
Race, ethnicity, and origin ACS 2023
- Neighborhood character
- Predominantly White (93%)
- Race & ethnicity
- White 93% Two or more races 3% Black 2% Hispanic / Latino 2%
- Common ancestry
- Italian 2% Romanian 2% Slovak 2%
- Foreign-born
- 1% · Canada
- Languages at home
- 95% English-only · German/W. Germanic 4% Spanish 1%
Political lean MEDSL · Ashland
- 2024 margin
- Solid R (+50.0) · D 24.5% · R 74.5%
- 2008→2024 swing
- -26.7pp toward R · 2008: -23.3pp · 2024: -50.0pp
- All cycles
- 2024: R+50.0 2020: R+48.7 2016: R+47.8 2012: R+30.0 2008: R+23.3
Not yet ingested
- Civics
- —
Market trends
- HPI YoY
- ▼ -196.79%
- Current HPI
- 201.96
- Rent YoY
- ▲ 7.07%
- Metro
- Ashland, OH
- State GDP YoY
- ▲ 1.98%
- F500 in state
- 48
Industry mix (Fortune 500 HQ in OH)
| Industry | F500 HQs | Revenue |
|---|---|---|
| Insurance | 3 | $145B |
|
||
| Industrial Machinery | 3 | $49B |
|
||
| Financial Services | 3 | $24B |
|
||
| Consumer Goods | 2 | $93B |
|
||
| Aerospace / Defense | 2 | $47B |
|
||
| Utilities | 2 | $33B |
|
||
Price history
+166.5% since first listed2 events — show timeline
- 2026-05-21 Listed $179,900 ABOR
- 2004-12-02 Sold (Public Records) $67,500 Public Records
Property tax history
+3.8%/yrLatest (2025): $1,642 · +0.0% YoY. Source: county tax records.
Cash-flow waterfall
monthlySold comps — $/sqft
last 12 mo · ≤1 miLoading sold comps…