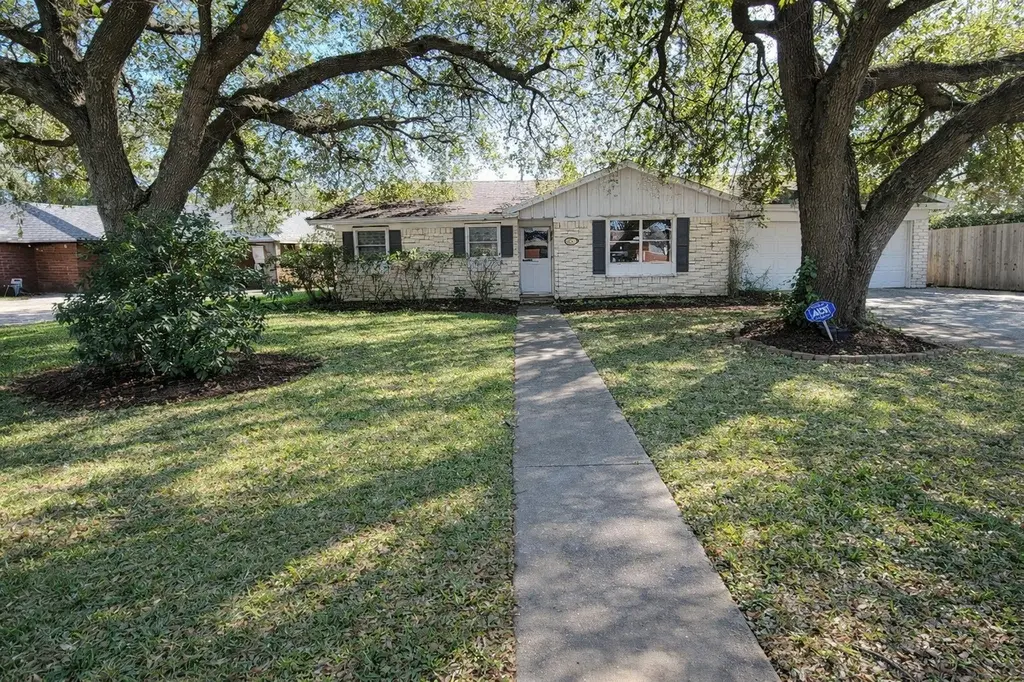
705 Inwood Dr · Baytown, TX
Flood risk 6/10 · Moderate
- FEMA flood zone
- X (shaded)
- Chance of flooding over 30 yrs
- 0.53%
- Est. flood insurance / yr
- $507 – $1,088
Fire risk 1/10 · Minimal
- Est. fire insurance / yr
- $1,222 – $2,270
Heat risk 9/10 · Severe
- Hot days now (above 109°F)
- 7 days/yr
- Hot days in 30 yrs
- 25 days/yr
Wind risk 9/10 · Severe
- Chance of severe wind over 30 yrs
- 99.0%
Air-quality risk 2/10 · Minimal
- Unhealthy air days now
- 1 days/yr
- Unhealthy air days in 30 yrs
- 2 days/yr
Risk factors via First Street. Map © Google.
Why this score? — see what drove the B+ grade
The composite is a weighted blend of 9 inputs, each scored 0–100. Each bar is that input's sub-score; the figure is the points it added to the 100-point composite (weight × sub-score).
- Cash flow +30.0/30.0
- ARV discount +15.0/15.0
- DSCR +10.0/10.0
- 1% rule +9.6/10.0
- Livability +3.5/5.0
- Schools +3.2/10.0
- Rent growth +2.9/5.0
- Condition / age +2.5/5.0
- Appreciation +0.0/10.0
$130,000
🖨 Deal sheet (PDF) 📄 Offer letter ✓ Due diligence
Listing remarks MLS
Low TAXES and NO HOA!! Great Opportunity to build some sweat equity! This 4 bedroom 2 bath home is right in the heart of the quaint town of Baytown! Close to shopping and eateries! Don't wait! Call for a private showing!
Key facts
- 8,250 sq ft lot
- 2 garage spots
- Built 1967
Neighborhood map
What this means for you Summary
Snapshot
- This is a 4-bed/2.0-bath single-family listed at $130k.
Deal economics
- At list price, monthly cash flow is $602 ($7k/yr) — positive.
- The deal already cash-flows at list — no discount required.
- Meets the 1% rule at list price ($2k rent vs $130k).
- Recommended offer: $126k (3.0% below list) — sets the bar for market timing.
- Cap rate 11.8% vs local median 4.2% in Baytown — top-decile yield for the area; either an underpriced asset or a hidden risk that comps aren't pricing in. Stress-test before assuming the spread holds.
Location & tenants
- Location reads 69/100 on livability (#412 in TX) — a middle-class / working-renter tenant base. Strengths: cost of living A+, housing A+; Watch: employment D+, crime F, amenities F.
- Goose Creek CISD (urban): math 37% / reading 36% proficiency, ranked #473 of 826 in TX (top 57%) — families likely to look elsewhere, expect single-tenant / working-renter base with shorter leases; 61% free/reduced lunch — lower-income household profile, screen leases tightly.
- Zoned schools: Alamo El (math 36% / reading 43%, grade F, #1,545 of 4,322 statewide, top 38%, 788 students, 79% FRL); Horace Mann J H (math 34% / reading 28%, grade F, #1,015 of 1,662 statewide, top 62%, 811 students, 87% FRL); Sterling H S (math 53% / reading 44%, grade D, #560 of 1,632 statewide, top 35%, 2,098 students, 69% FRL) — zoned schools average 78% FRL vs 61% district-wide (17 pts higher); higher-poverty schools than district average — tighter screening recommended.
- Market conditions: Rents rising (+1.5%/yr); 627 active listings in the ZIP; 5 comparable units currently listed for rent nearby; rentals at typical pace (median 18d on market — plan ~3-4 weeks tenant-placement turnaround); 29,883 units permitted in Harris County in 2024 (8,621 in 5+ unit buildings).
- This rent runs 31% of the median local income ($74k/yr) — at the standard rent-burdened threshold; future hikes will face affordability resistance.
Forward outlook
- Local home prices are declining (-3.0%/yr); year-one equity from $899 of loan paydown is wiped out by about $4k of value loss. Plan a longer hold.
- Harris County population projected at +47% by 2050 — long-run rental-demand tailwind backs the buy-and-hold thesis.
- At projected returns (-3.0% appreciation + 1.5% rent growth), your $36k cash investment doubles in ~7 years — after that, you're playing with house money.
Negotiation context
- It's been on market 49 days — a 3% lower offer ($126k) is reasonable based on typical stale-listing flexibility.
- 7 sale attempts since 6y ago with the ask held roughly flat each time — persistent listings suggest the price (not the market) is what's stuck; bring a comps-based counter.
- Current owner paid $53k; list at $130k implies a 145% gain — meaningful room to come down on a strong offer.
Risks & watch-outs
- Climate carrying-cost: major flood risk; severe wind risk, 99% chance of damaging wind over 30y; extreme-heat days projected 7→25/yr by 2055 (HVAC capex compounding) — expect insurance premiums to compound above CPI over the hold.
Questions for the listing agent
- It's been on market 49 days. Have you received any prior offers? Is the seller open to a 3% concession, seller financing, or rate buy-down credit?
- Built in 1967 — when were the roof, HVAC, electrical panel, plumbing, and water heater last replaced?
- Is there a deadline driving the sale (1031 exchange, divorce, estate, relocation)? That informs how much negotiation room exists.
- Schools are D-rated, which usually means shorter tenancies and higher turnover. Who's the typical renter profile here, and what's been the actual vacancy rate?
- Crime grade is F in this area — have there been break-ins, vandalism, or insurance claims at this property in the last 3 years? What carrier currently insures it and at what premium?
- What's the average days-on-market for RENTAL listings here right now (not sales)? A rising rental-DOM trend means longer vacancies and softer asking-rent achievability than the comps imply.
- What's the recent tenant-quality profile in this submarket — average credit score on applications, eviction rate, late-payment / NSF rate, and stable-employment percentage? A property-management company in the area should have these aggregated.
- How much new for-sale + rental construction is in the pipeline within 1–3 miles? Heavy new supply typically softens prices + rents 12–24 months out; constrained supply supports both.
Investment metrics
- 1% rule
- 1.46% ✓
- Cap rate
- 11.85%
- Cash-on-cash
- 19.84%
- DSCR
- 1.88
- GRM
- 5.7
CMA / ARV
- ARV (median comp)
- $209,018
- List price
- $130,000
- Delta
- -37.80%
- Verdict
- UNDERPRICED
- Comps
- 20 within 1.0 mi
Show comp detail 12 sales within ~0.75 mi
| Address | Dist | Beds/Ba | Sqft | Sold | Price | $/sf | Match |
|---|---|---|---|---|---|---|---|
| 705 Inwood Dr | 0.00mi | 4/2.0 | 2,248 (0%) | 1mo | $130,000 | $58 | 99 |
| 504 River Bend Dr | 0.24mi | 4/2.5 | 2,306 (+3%) | 5mo | $249,999 | $108 | 78 |
| 414 Harold Ln | 0.31mi | 5/2.0 (+1) | 2,052 (-9%) | 5mo | $254,900 | $124 | 62 |
| 2126 Sanders Brook Dr | 0.51mi | 4/2.5 | 2,377 (+6%) | 5mo | $331,163 | $139 | 61 |
| 3310 Tranquility Ln | 0.59mi | 4/2.5 | 2,310 (+3%) | 7mo | $311,830 | $135 | 60 |
| 2127 Sanders Brook Dr | 0.49mi | 4/3.0 | 2,121 (-6%) | 6mo | $307,279 | $145 | 59 |
| 2118 Sanders Brook Dr | 0.51mi | 4/3.0 | 2,121 (-6%) | 6mo | $303,197 | $143 | 58 |
| 2102 Spring Hollow Dr | 0.54mi | 4/3.0 | 2,121 (-6%) | 6mo | $326,582 | $154 | 57 |
| 212 Harold Ln | 0.48mi | 3/2.5 (-1) | 2,058 (-8%) | 1mo | $175,000 | $85 | 56 |
| 3227 Falling Brook Dr | 0.67mi | 4/3.0 | 2,121 (-6%) | 3mo | $299,000 | $141 | 53 |
| 3406 Rolling River Dr | 0.46mi | 3/2.5 (-1) | 1,988 (-12%) | 2mo | $316,398 | $159 | 50 |
| 3310 Rolling River Dr | 0.43mi | 3/2.5 (-1) | 1,988 (-12%) | 5mo | $295,198 | $148 | 50 |
Match score weights: distance 35% · size 25% · config 20% · recency 20%. Top-matched comps best support the ARV.
Projected returns pro-forma
-3.0% appreciation · 1.48% rent growth · sell at horizon
- IRR
- 10.2%
- Equity multiple
- 1.40×
- Total profit
- $14,439
- Equity at exit
- $19,383
- IRR
- 18.1%
- Equity multiple
- 2.39×
- Total profit
- $50,668
- Equity at exit
- $11,240
Cash invested: $36,400 (down + closing). Projections, not guarantees.
Landlord ↔ Tenant lean methodology
- Overall (STATE)
- 87 Strongly Landlord-Friendly
- State Texas
- 87 Strongly Landlord-Friendly · R+5
- County
- — inherits STATE
- City
- — inherits STATE
ZIP-level market 77521
- Rents YoY
- 1.5%
- Active inventory
- 627
- Price-to-rent
- 5.7×
Monthly cashflow live
- Estimated rent
- $1,899 medium interval (Pro) →
- Mortgage (P&I)
- −$682
- Tax est. 1.5%
- −$162 /mo · $1,950/yr
- Insurance
- −$54
- HOA
- −$0
- Lot rent
- −$0
- Vacancy / Maint / Mgmt
- −$399
- Net cashflow
- $602
Break-even live
Sensitivity live
| Price | -10% $692 | -5% $647 | +0% $602 | +5% $557 | +10% $512 |
|---|---|---|---|---|---|
| Rent | -10% $452 | -5% $527 | +0% $602 | +5% $677 | +10% $752 |
| Rate | -1.0pp $667 | -0.5pp $635 | base $602 | +0.5pp $568 | +1.0pp $534 |
UW: 25.0% down · 7.5% · 30yr · 1.5% tax · 5.0% vac · 8.0% maint · 8.0% mgmt
Financing live
Cash to close
- Down payment
- $32,500
- Closing costs
- $3,900
- Reserves months
- —
- Total cash needed
- —
Loan-product check · same deal, 3 products live
Conventional
25% down · 7.5% · 30yr
- Down + closing
- —
- Monthly P&I
- —
- Monthly cashflow
- —
- DSCR
- —
- Eligible?
- —
Personal DTI + credit; lowest rate.
DSCR
20% down · 8.5% · 30yr
- Down + closing
- —
- Monthly P&I
- —
- Monthly cashflow
- —
- DSCR
- —
- Eligible?
- —
No personal income docs; deal must DSCR.
Hard money
10% down · 12.0% · 12mo
- Down + closing
- —
- Monthly P&I
- —
- Monthly cashflow
- —
- DSCR
- —
- Eligible?
- —
Short-term bridge; refi at stabilization.
Rent comps 5 comps
| Address | Beds | Baths | Sqft | Rent | $/sqft | DOM | Units | Dist |
|---|---|---|---|---|---|---|---|---|
| 305 Kelly Ln Baytown, TX | 3.0 | 2.0 | 1650 | $1,000 | $0.61 | 17d | 1 | 0.45mi |
| 1601 Garth Rd Baytown, TX | 2.0–3.0 | 1.0–2.5 | 1190 | $1,499 | $1.26 | 5d | 5 | 0.74mi |
| 700 Meadowglen Dr Baytown, TX | 3.0 | 2.0 | 1472 | $1,800 | $1.22 | 1d | 1 | 1.21mi |
| 700 Meadowglen Dr Baytown, TX | 3.0 | 2.0 | 1472 | $1,800 | $1.22 | 26d | 1 | 1.21mi |
| 800 Charles Pl Baytown, TX | 3.0 | 2.5 | 1905 | $1,846 | $0.97 | 26d | 1 | 1.28mi |
Listing history 24 events
-
2026-04-01$130,000 Active 221-char remark
Show marketing remark (221 chars)
Low TAXES and NO HOA!! Great Opportunity to build some sweat equity! This 4 bedroom 2 bath home is right in the heart of the quaint town of Baytown! Close to shopping and eateries! Don't wait! Call for a private showing!
-
2026-03-31historical
-
2026-02-21price $130,000
-
2025-11-20status Active
-
2025-11-19historical
-
2025-11-11price $145,000
-
2025-08-20$155,000 Active
-
2025-08-19price $155,000
-
2025-08-19historical
-
2025-07-12price $165,000
-
2025-06-06price $175,000
-
2025-04-22$185,000 Active
-
2021-03-24soldstatus Sold
-
2021-03-24soldstatus
-
2021-03-24soldstatus
-
2020-12-28status Pending
-
2020-12-04historical
-
2020-12-04$140,000 Active
-
2020-11-26price $165,000
-
2020-11-26status Active
-
2020-11-24status Option Pending
-
2020-11-15$180,000 Active
-
1995-09-06soldstatus
-
1995-09-01soldstatus $53,000
ⓘ Source: listings_history table (triggers on properties + properties_extension) + one-shot
backfill from property_details.listing_events for pre-trigger history.
Climate risk First Street
- Flood 6/10 Major FEMA zone X (shaded) · 53% chance over 30 yrs
- Wildfire 1/10 Low
- Heat 9/10 Extreme 7 d/yr ≥109°F today · 25 d/yr by 30 yrs out
- Wind 9/10 Extreme 99% chance of damaging wind over 30 yrs
- Air quality 2/10 Low 1 unhealthy d/yr today · 2 by 30 yrs out
Nearby sold comps map
Loading sold comps map…
Walkable amenities ~0.75 mi
Loading nearby amenities…
Taxation est. · year 1
- Rental income
- $22,790
- − Mortgage interest
- −$7,282
- − Property taxes
- −$1,950
- − Insurance
- −$650
- − Repairs & maintenance
- −$1,823
- − Management
- −$1,823
- − Depreciation
- −$3,782
- Taxable income
- $5,480
- Est. tax owed @ 24.0%
- −$1,315
- After-tax cash flow
- $5,908/yr
For passive investors: Depreciation is non-cash, so a rental often shows a tax loss while cash-flowing — sheltering income. Rental losses are passive: they offset passive income freely, and up to $25,000/yr can offset ordinary (W-2) income if you actively participate and your MAGI is under $100k (phasing out to $0 by $150k); unused losses carry forward. On sale, claimed depreciation is recaptured at up to 25%, and gains may owe capital-gains tax (a 1031 exchange can defer both). Figures are a year-1 estimate at your 24.0% rate — not tax advice; consult a CPA.
Schools (NCES district)
- District
- Goose Creek CISD
- NCES district ID
- 4821150
- Math proficiency
- 37% ▼ -11.00%
- Reading proficiency
- 36% ▼ -4.00%
- Median HH income
- $52,468
- Composite
- 31.84/100
- National rank
- #5877
- State rank
- #473 of 826 in TX
Livability — Baytown
- Score
- 69/100
- State rank
- #412
- US rank
- #8494
Category grades
Schools grade is shown separately in the Schools card above.
Census & demographics
- Census place
- Baytown, TX
- County
- Harris County · 4,702,590 people
- City population
- 135,579
- Metro
- Houston-The Woodlands-Sugar Land, TX
- Population (ZIP)
- 69,038
- Household income
- $73,629
- Rent vs Own
- Severe rent burden
- 2121.0
Population outlook (Harris County) Hauer SSP2
- Today (2025)
- 5,571,493 people
- By 2030
- 6,089,821 · +9.3%
- By 2040
- 7,142,806 · +28.2%
- By 2050
- 8,185,864 · +46.9%
- By 2075
- 10,574,329 · +89.8%
- By 2100
- 12,109,958 · +117.4%
Race, ethnicity, and origin ACS 2023
- Neighborhood character
- Diverse neighborhood (Simpson 0.64)
- Race & ethnicity
- Hispanic / Latino 50% White 28% Two or more races 18% Black 17% Asian 3%
- Hispanic origin (detail)
- Mexican 42% Puerto Rican 2%
- Common ancestry
- Lithuanian 2% Slovak 1%
- Foreign-born
- 20% · Canada, Vietnam
- Languages at home
- 59% English-only · Spanish 36% French/Haitian/Cajun 1% Other Asian/Pacific 1%
Political lean MEDSL · Harris
- 2024 margin
- Lean D (+5.5) · D 52.0% · R 46.4% · Other 1.6%
- 2008→2024 swing
- +3.9pp toward D · 2008: 1.6pp · 2024: 5.5pp
- All cycles
- 2024: D+5.5 2020: D+13.3 2016: D+12.4 2012: D+0.1 2008: D+1.6
Not yet ingested
- Civics
- —
Market trends
- HPI YoY
- ▼ -154.80%
- Current HPI
- 246.1892
- Rent YoY
- ▲ 1.48%
- Metro
- Houston-The Woodlands-Sugar Land, TX
- State GDP YoY
- ▲ 3.95%
- F500 in state
- 110
Industry mix (Fortune 500 HQ in TX)
| Industry | F500 HQs | Revenue |
|---|---|---|
| Energy | 16 | $1,198B |
|
||
| Technology | 5 | $198B |
|
||
| Engineering / Construction | 4 | $72B |
|
||
| Energy Services | 3 | $60B |
|
||
| Utilities | 3 | $41B |
|
||
| Healthcare | 2 | $330B |
|
||
Price history
+145.3% since first listed24 events — show timeline
- 2026-04-01 Listed $130,000 HARMLS
- 2026-03-31 Listing Removed — HARMLS
- 2026-02-21 Price Changed $130,000 HARMLS
- 2025-11-20 Relisted — HARMLS
- 2025-11-19 Listing Removed — HARMLS
- 2025-11-11 Price Changed $145,000 HARMLS
- 2025-08-20 Listed $155,000 HARMLS
- 2025-08-19 Price Changed $155,000 HARMLS
- 2025-08-19 Listing Removed — HARMLS
- 2025-07-12 Price Changed $165,000 HARMLS
- 2025-06-06 Price Changed $175,000 HARMLS
- 2025-04-22 Listed $185,000 HARMLS
- 2021-03-24 Sold (Public Records) — Public Records
- 2021-03-24 Sold (Public Records) — Public Records
- 2021-03-24 Sold (MLS) — HARMLS
- 2020-12-28 Pending — HARMLS
- 2020-12-04 Listed $140,000 HARMLS
- 2020-12-04 Listing Removed — HARMLS
- 2020-11-26 Price Changed $165,000 HARMLS
- 2020-11-26 Relisted — HARMLS
- 2020-11-24 Pending — HARMLS
- 2020-11-15 Listed $180,000 HARMLS
- 1995-09-06 Sold (Public Records) — Public Records
- 1995-09-01 Sold (Public Records) $53,000 Public Records
Property tax history
+9.4%/yrLatest (2025): $7,156 · +3.8% YoY. Source: county tax records.
Cash-flow waterfall
monthlySold comps — $/sqft
last 12 mo · ≤1 miLoading sold comps…