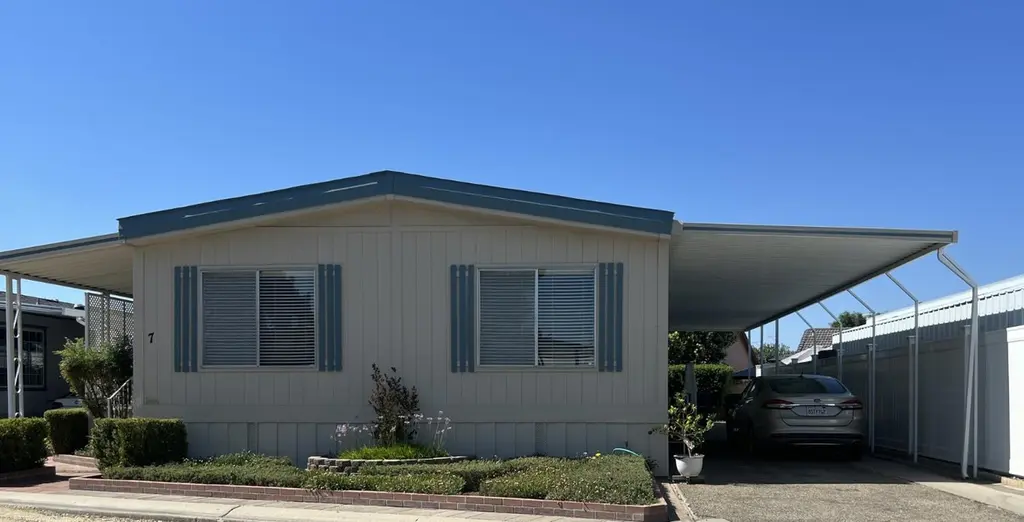
371 Bethel Ave #7 · Sanger, CA
Flood risk 1/10 · Minimal
- FEMA flood zone
- X (unshaded)
- Chance of flooding over 30 yrs
- 0.0%
- Est. flood insurance / yr
- $507 – $1,088
Fire risk 8/10 · Major
- Est. fire insurance / yr
- $659 – $1,223
Heat risk 8/10 · Major
- Hot days now (above 105°F)
- 6 days/yr
- Hot days in 30 yrs
- 15 days/yr
Wind risk 1/10 · Minimal
- Chance of severe wind over 30 yrs
- —
Air-quality risk 10/10 · Severe
- Unhealthy air days now
- 52 days/yr
- Unhealthy air days in 30 yrs
- 58 days/yr
Risk factors via First Street. Map © Google.
Why this score? — see what drove the C+ grade
The composite is a weighted blend of 9 inputs, each scored 0–100. Each bar is that input's sub-score; the figure is the points it added to the 100-point composite (weight × sub-score).
- Cash flow +30.0/30.0
- 1% rule +10.0/10.0
- DSCR +10.0/10.0
- Schools +3.7/10.0
- Livability +2.9/5.0
- Rent growth +2.5/5.0
- Condition / age +2.5/5.0
- ARV discount +0.4/15.0
- Appreciation +0.0/10.0
$150,000
🖨 Deal sheet 📄 Offer letter ✓ Due diligence
Listing remarks
Vista Del Monte Mobile Home Park offering Sanger's finest Senior Living. Enjoy the pool, tennis court and club house. For an additional fee you can store your own RV right there on the premises for your convenience. The interior is lovely and has been beautifully maintained. The kitchen and master bath have been remodeled. Pride of ownership shows throughout home and landscape.
Key facts
- Tennis court
- Remodeled kitchen
- Pool
Tags
Property features AI
Finance
- Other: Living area sourced from public records; Located in Fresno County
- HOA & community: Community pool; Clubhouse
Exterior
- Parking: Carport; Has carport
- Utilities: Electric service on; Public sewer; Public utilities
- Home design: Mobile home
- Construction: Wood siding; Composition roof; Wood subfloor foundation; Built one story
- Exterior features: One-level; Covered patio/porch; Shed(s); Urban lot with front sprinklers and automatic sprinklers; Private in-ground community pool
Interior
- Kitchen: Built-in range/oven; Disposal; Dishwasher
- Flooring: Other flooring
- Bathrooms: 2 bathrooms; Tub/shower and separate shower
- Heating & cooling: Central heating and cooling; Has heating; Has cooling
- Interior features: Built-in range/oven; Disposal; Dishwasher
- Laundry & utility: Indoor laundry in utility room
Neighborhood map
What this means for you Summary
Snapshot
- This is a 3-bed/1.0-bath manufactured listed at $150k.
Deal economics
- At list price, monthly cash flow is $751 ($9k/yr) — positive.
- The deal already cash-flows at list — no discount required.
- Meets the 1% rule at list price ($2k rent vs $150k).
- Recommended offer: $148k (1.5% below list) — sets the bar for market timing.
- Cap rate 12.3% vs local median 3.6% in Sanger — top-decile yield for the area; either an underpriced asset or a hidden risk that comps aren't pricing in. Stress-test before assuming the spread holds.
Location & tenants
- Location reads 58/100 on livability (#668 in CA) — a working-class tenant base; expect higher turnover. Strengths: housing A+; Watch: employment C-, crime D+, amenities F.
- Sanger Unified (town): math 22% / reading 62% proficiency, ranked #216 of 517 in CA (top 42%) — families likely to look elsewhere, expect single-tenant / working-renter base with shorter leases; 64% free/reduced lunch — lower-income household profile, screen leases tightly.
- Zoned schools: Ronald W. Reagan Elementary (552 students, 69% FRL); Washington Academic Middle (math 10% / reading 10%, grade F, #474 of 498 statewide, top 99%, 1,462 students, 75% FRL); Sanger High (math 24% / reading 66%, grade D-, #425 of 1,170 statewide, top 37%, 2,734 students, 67% FRL).
- Zoned-school proficiency averages 28% at this address vs 42% district-wide (-14 pts) — the specific schools serving this property underperform the Sanger Unified average; the district grade overstates school quality for this exact location.
- Market conditions: 151 active listings in the ZIP; 3 comparable units currently listed for rent nearby; rentals leasing fast (median 10d on market — plan ~1-2 weeks tenant-placement turnaround); solid renter incomes; 2,426 units permitted in Fresno County in 2024 (296 in 5+ unit buildings).
- This rent runs 34% of the median local income ($79k/yr) — at the standard rent-burdened threshold; future hikes will face affordability resistance.
Forward outlook
- Local home prices are declining (-3.0%/yr); year-one equity from $1k of loan paydown is wiped out by about $4k of value loss. Plan a longer hold.
- Fresno County population projected at +11% by 2050 — modest demand growth; plan on rents tracking national, not racing it.
- At projected returns (-3.0% appreciation + 3.0% rent growth), your $42k cash investment doubles in ~6 years — after that, you're playing with house money.
Negotiation context
- It's been on market 18 days — a 2% lower offer ($148k) is reasonable based on typical stale-listing flexibility.
Risks & watch-outs
- Climate carrying-cost: severe wildfire risk; extreme-heat days projected 6→15/yr by 2055 (HVAC capex compounding) — expect insurance premiums to compound above CPI over the hold.
Questions for the listing agent
- Is there a deadline driving the sale (1031 exchange, divorce, estate, relocation)? That informs how much negotiation room exists.
- Crime grade is D in this area — have there been break-ins, vandalism, or insurance claims at this property in the last 3 years? What carrier currently insures it and at what premium?
- What's the average days-on-market for RENTAL listings here right now (not sales)? A rising rental-DOM trend means longer vacancies and softer asking-rent achievability than the comps imply.
- What's the recent tenant-quality profile in this submarket — average credit score on applications, eviction rate, late-payment / NSF rate, and stable-employment percentage? A property-management company in the area should have these aggregated.
- How much new for-sale + rental construction is in the pipeline within 1–3 miles? Heavy new supply typically softens prices + rents 12–24 months out; constrained supply supports both.
Investment metrics
- 1% rule
- 1.51% ✓
- Cap rate
- 12.30%
- Cash-on-cash
- 21.47%
- DSCR
- 1.96
- GRM
- 5.5
CMA / ARV
- ARV (on-the-fly)
- $129,600
- Comps found
- 12
Show comp detail 12 sales within ~0.75 mi
| Address | Dist | Beds/Ba | Sqft | Sold | Price | $/sf | Match |
|---|---|---|---|---|---|---|---|
| 371 Bethel Ave Unit SP 51 | 0.00mi | 3/2.0 | 1,440 (0%) | 7mo | $129,000 | $90 | 90 |
| 371 Bethel Ave #59 | 0.15mi | 2/2.0 (-1) | 1,440 (0%) | 2mo | $86,500 | $60 | 82 |
| 371 Bethel Ave #101 | 0.00mi | 2/2.0 (-1) | 1,440 (0%) | 16mo | $82,000 | $57 | 78 |
| 371 Bethel Ave #99 | 0.00mi | 2/2.0 (-1) | 1,344 (-7%) | 3mo | $109,674 | $82 | 78 |
| 371 Bethel Ave #45 | 0.00mi | 2/2.0 (-1) | 1,440 (0%) | 16mo | $85,000 | $59 | 77 |
| 371 Bethel #109 | 0.00mi | 2/2.0 (-1) | 1,440 (0%) | 18mo | $116,000 | $81 | 76 |
| 371 Bethel Ave #85 | 0.00mi | 2/2.0 (-1) | 1,440 (0%) | 18mo | $147,000 | $102 | 76 |
| 371 Bethel Ave #85 | 0.00mi | 2/2.0 (-1) | 1,440 (0%) | 18mo | $147,000 | $102 | 76 |
| 371 Bethel Ave #102 | 0.00mi | 3/2.0 | 1,248 (-13%) | 2mo | $127,500 | $102 | 72 |
| 371 Bethel Ave Ave #86 | 0.00mi | 2/2.0 (-1) | 1,344 (-7%) | 13mo | $160,000 | $119 | 69 |
| 371 Bethel Ave Spc 2 | 0.00mi | 2/2.0 (-1) | 1,248 (-13%) | 9mo | $134,000 | $107 | 61 |
| 371 N Bethel #81 | 0.15mi | 2/2.0 (-1) | 1,604 (+11%) | 17mo | $145,000 | $90 | 50 |
Match score weights: distance 35% · size 25% · config 20% · recency 20%. Top-matched comps best support the ARV.
Projected returns pro-forma
-3.0% appreciation · 3.0% rent growth · sell at horizon
- IRR
- 14.0%
- Equity multiple
- 1.56×
- Total profit
- $23,587
- Equity at exit
- $22,365
- IRR
- 22.8%
- Equity multiple
- 2.96×
- Total profit
- $82,304
- Equity at exit
- $12,969
Cash invested: $42,000 (down + closing). Projections, not guarantees.
Landlord ↔ Tenant lean methodology
- Overall (STATE)
- 18 Strongly Tenant-Friendly
- State California
- 18 Strongly Tenant-Friendly · D+13
- County
- — inherits STATE
- City
- — inherits STATE
ZIP-level market 93657
- Active inventory
- 151
- Price-to-rent
- 5.5×
Monthly cashflow live
- Estimated rent
- $2,263 medium interval (Pro) →
- Mortgage (P&I)
- −$787
- Tax est. 1.5%
- −$188 /mo · $2,250/yr
- Insurance
- −$62
- HOA
- −$0
- Vacancy / Maint / Mgmt
- −$475
- Net cashflow
- $751
Break-even live
UW: 25.0% down · 7.5% · 30yr · 1.5% tax · 5.0% vac · 8.0% maint · 8.0% mgmt
Financing live
Cash to close
- Down payment
- $37,500
- Closing costs
- $4,500
- Reserves months
- —
- Total cash needed
- —
Loan-product check · same deal, 3 products live
Conventional
25% down · 7.5% · 30yr
- Down + closing
- —
- Monthly P&I
- —
- Monthly cashflow
- —
- DSCR
- —
- Eligible?
- —
Personal DTI + credit; lowest rate.
DSCR
20% down · 8.5% · 30yr
- Down + closing
- —
- Monthly P&I
- —
- Monthly cashflow
- —
- DSCR
- —
- Eligible?
- —
No personal income docs; deal must DSCR.
Hard money
10% down · 12.0% · 12mo
- Down + closing
- —
- Monthly P&I
- —
- Monthly cashflow
- —
- DSCR
- —
- Eligible?
- —
Short-term bridge; refi at stabilization.
Rent comps 3 comps
| Address | Beds | Baths | Sqft | Rent | $/sqft | DOM | Units | Dist |
|---|---|---|---|---|---|---|---|---|
| 2892 Florence Ave Sanger, CA | 3.0 | 2.0 | 1731 | $2,400 | $1.39 | 10d | 1 | 0.63mi |
| 1415 De Witt Ave Sanger, CA | 3.0 | 1.0 | 1156 | $1,700 | $1.47 | 1d | 1 | 1.19mi |
| 1319 Sanger Ave Sanger, CA | 3.0 | 2.0 | 1100 | $1,695 | $1.54 | 16d | 1 | 1.37mi |
Listing history 15 events
-
2026-06-18days on market $150,000 Active 18 DOM
-
2026-06-17days on market $150,000 Active 17 DOM
-
2026-06-16days on market $150,000 Active 16 DOM
-
2026-06-15days on market $150,000 Active 15 DOM
-
2026-06-13days on market $150,000 Active 13 DOM
-
2026-06-13days on market $150,000 Active 12 DOM
-
2026-06-10days on market $150,000 Active 10 DOM
-
2026-06-09days on market $150,000 Active 9 DOM
-
2026-06-08days on market $150,000 Active 8 DOM
-
2026-06-07days on market $150,000 Active 7 DOM
-
2026-06-05days on market $150,000 Active 4 DOM
-
2026-06-03days on market $150,000 Active 3 DOM
-
2026-06-02days on market $150,000 Active 2 DOM
-
2026-06-01remarks 380-char remark
-
2026-06-01$150,000 Active 1 DOM
ⓘ Source: listings_history table (triggers on properties + properties_extension) + one-shot
backfill from property_details.listing_events for pre-trigger history.
Climate risk First Street
- Flood 1/10 Low FEMA zone X (unshaded) · 0% chance over 30 yrs
- Wildfire 8/10 Severe
- Heat 8/10 Severe 6 d/yr ≥105°F today · 15 d/yr by 30 yrs out
- Wind 1/10 Low
- Air quality 10/10 Extreme 52 unhealthy d/yr today · 58 by 30 yrs out
Nearby sold comps map
Loading sold comps map…
Walkable amenities ~0.75 mi
Loading nearby amenities…
Taxation est. · year 1
- Rental income
- $27,160
- − Mortgage interest
- −$8,402
- − Property taxes
- −$2,250
- − Insurance
- −$750
- − Repairs & maintenance
- −$2,173
- − Management
- −$2,173
- − Depreciation
- −$4,364
- Taxable income
- $7,049
- Est. tax owed @ 24.0%
- −$1,692
- After-tax cash flow
- $7,325/yr
For passive investors: Depreciation is non-cash, so a rental often shows a tax loss while cash-flowing — sheltering income. Rental losses are passive: they offset passive income freely, and up to $25,000/yr can offset ordinary (W-2) income if you actively participate and your MAGI is under $100k (phasing out to $0 by $150k); unused losses carry forward. On sale, claimed depreciation is recaptured at up to 25%, and gains may owe capital-gains tax (a 1031 exchange can defer both). Figures are a year-1 estimate at your 24.0% rate — not tax advice; consult a CPA.
Schools (NCES district)
- District
- Sanger Unified
- NCES district ID
- 0635250
- Math proficiency
- 22% ▼ -21.00%
- Reading proficiency
- 62% ▲ 9.00%
- Median HH income
- $57,180
- Composite
- 36.67/100
- National rank
- #4608
- State rank
- #216 of 517 in CA
Livability — Sanger
- Score
- 58/100
- State rank
- #668
- US rank
- #20675
Category grades
Schools grade is shown separately in the Schools card above.
Census & demographics
- Census place
- Sanger, CA
- County
- Fresno County · 834,801 people
- City population
- 36,205
- Metro
- Fresno, CA
- Population (ZIP)
- 36,205
- Household income
- $78,904
- Rent vs Own
- Severe rent burden
- 878.0
Population outlook (Fresno County) Hauer SSP2
- Today (2025)
- 1,042,971 people
- By 2030
- 1,072,198 · +2.8%
- By 2040
- 1,122,408 · +7.6%
- By 2050
- 1,157,251 · +11.0%
- By 2075
- 1,182,575 · +13.4%
- By 2100
- 1,105,899 · +6.0%
Race, ethnicity, and origin ACS 2023
- Neighborhood character
- Predominantly Hispanic (68%)
- Race & ethnicity
- Hispanic / Latino 68% White 25% Two or more races 17% Asian 5% Native American 2%
- Hispanic origin (detail)
- Mexican 64%
- Common ancestry
- Russian 1% Italian 1% Iranian 1%
- Foreign-born
- 19% · Canada, China
- Languages at home
- 52% English-only · Spanish 44% Other Asian/Pacific 2% Other Indo-European 1%
Political lean MEDSL · Fresno
- 2024 margin
- Toss-up / Even · D 46.5% · R 50.9% · Other 2.6%
- 2008→2024 swing
- -6.5pp toward R · 2008: 2.1pp · 2024: -4.4pp
- All cycles
- 2024: R+4.4 2020: D+7.8 2016: D+3.9 2012: R+2.9 2008: D+2.1
Not yet ingested
- Civics
- —
Market trends
- HPI YoY
- ▼ -254.86%
- Current HPI
- 366.3783
- Rent YoY
- —
- Metro
- Fresno, CA
- State GDP YoY
- ▲ 3.21%
- F500 in state
- 116
Industry mix (Fortune 500 HQ in CA)
| Industry | F500 HQs | Revenue |
|---|---|---|
| Technology | 27 | $1,492B |
|
||
| Financial Services | 3 | $174B |
|
||
| Retail | 3 | $44B |
|
||
| Insurance | 3 | $26B |
|
||
| Media / Entertainment | 2 | $115B |
|
||
| Pharmaceuticals / Biotech | 2 | $62B |
|
||
Price history
1 event — show timeline
- 2026-05-07 Listed $150,000 FRESNOMLS
Cash-flow waterfall
monthlySold comps — $/sqft
last 12 mo · ≤1 miLoading sold comps…