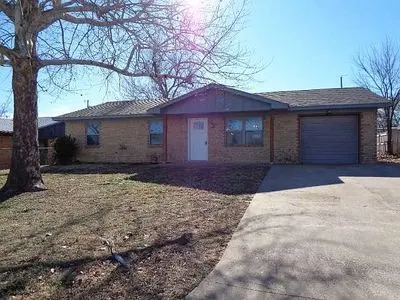
1204 4th Pl · Elgin, OK
Flood risk 1/10 · Minimal
- FEMA flood zone
- X (unshaded)
- Chance of flooding over 30 yrs
- 0.0%
- Est. flood insurance / yr
- $507 – $1,088
Fire risk 8/10 · Major
- Est. fire insurance / yr
- $2,463 – $4,575
Heat risk 6/10 · Moderate
- Hot days now (above 108°F)
- 7 days/yr
- Hot days in 30 yrs
- 19 days/yr
Wind risk 2/10 · Minimal
- Chance of severe wind over 30 yrs
- 4.0%
Air-quality risk 1/10 · Minimal
- Unhealthy air days now
- 0 days/yr
- Unhealthy air days in 30 yrs
- 0 days/yr
Risk factors via First Street. Map © Google.
Why this score? — see what drove the C grade
The composite is a weighted blend of 9 inputs, each scored 0–100. Each bar is that input's sub-score; the figure is the points it added to the 100-point composite (weight × sub-score).
- Cash flow +22.7/30.0
- Appreciation +10.0/10.0
- DSCR +7.3/10.0
- 1% rule +5.1/10.0
- Livability +3.7/5.0
- Schools +3.0/10.0
- Rent growth +2.5/5.0
- Condition / age +2.5/5.0
- ARV discount +2.3/15.0
$189,000
🖨 Deal sheet 📄 Offer letter ✓ Due diligence
Listing remarks
The subject property exhibits normal physical depreciation consistent with its age, with no external obsolescence observed at the time of inspection. The subject is a 49-year-old single-family residence in acceptable overall condition. The home has been updated and remodeled over time, including improvements to flooring, interior paint, double-pane windows, granite countertops, ceiling fans, lighting, and plumbing fixtures. Interior finishes consist of tile and carpet flooring, both of which are in acceptable condition. The kitchen and bathrooms feature granite countertops. The full bathroom includes a tiled tub/shower surround in an updated condition, and the half bathroom is also function
Key facts
- Built 1977
Neighborhood map
What this means for you Summary
Snapshot
- This is a 3-bed/1.0-bath single-family listed at $189k.
Deal economics
- At list price, monthly cash flow is $324 ($4k/yr) — positive.
- The deal already cash-flows at list — no discount required.
- Meets the 1% rule at list price ($2k rent vs $189k).
- Cap rate 8.3% vs local median 5.1% in Elgin — top-decile yield for the area; either an underpriced asset or a hidden risk that comps aren't pricing in. Stress-test before assuming the spread holds.
Location & tenants
- Location reads 73/100 on livability (#17 in OK) — a middle-class / working-renter tenant base. Strengths: crime A+, housing A+, cost of living A; Watch: schools C-, amenities F, commute F.
- Elgin (rural): math 29% / reading 36% proficiency, ranked #38 of 270 in OK (top 14%) — families likely to look elsewhere, expect single-tenant / working-renter base with shorter leases.
- Market conditions: 95 active listings in the ZIP; 6 comparable units currently listed for rent nearby; rentals at typical pace (median 24d on market — plan ~3-4 weeks tenant-placement turnaround); solid renter incomes; 133 units permitted in Comanche County in 2024 (0 in 5+ unit buildings).
Forward outlook
- In year one you build about $20k of equity ($1k loan paydown + $19k appreciation (10.0% local appreciation)).
- Comanche County population projected to shrink 3% by 2050 — rents likely to lag national; underwrite the cash flow, not the appreciation.
- At projected returns (10.0% appreciation + 3.0% rent growth), your $53k cash investment doubles in ~3 years — after that, you're playing with house money.
- By year 2, paydown + projected appreciation supports a ~$32k cash-out refi (75% LTV) — recoverable capital for the next deal without selling this one.
Negotiation context
- Only 0 days on market — expect competitive offers; lowballing is unlikely to land.
Risks & watch-outs
- Climate carrying-cost: severe wildfire risk; extreme-heat days projected 7→19/yr by 2055 (HVAC capex compounding) — expect insurance premiums to compound above CPI over the hold.
Questions for the listing agent
- Built in 1977 — when were the roof, HVAC, electrical panel, plumbing, and water heater last replaced?
- Is there a deadline driving the sale (1031 exchange, divorce, estate, relocation)? That informs how much negotiation room exists.
- What's the average days-on-market for RENTAL listings here right now (not sales)? A rising rental-DOM trend means longer vacancies and softer asking-rent achievability than the comps imply.
- What's the recent tenant-quality profile in this submarket — average credit score on applications, eviction rate, late-payment / NSF rate, and stable-employment percentage? A property-management company in the area should have these aggregated.
- How much new for-sale + rental construction is in the pipeline within 1–3 miles? Heavy new supply typically softens prices + rents 12–24 months out; constrained supply supports both.
Investment metrics
- 1% rule
- 1.01% ✓
- Cap rate
- 8.35%
- Cash-on-cash
- 7.34%
- DSCR
- 1.33
- GRM
- 8.2
CMA / ARV
- ARV (on-the-fly)
- $169,383
- Comps found
- 12
Show comp detail 12 sales within ~0.75 mi
| Address | Dist | Beds/Ba | Sqft | Sold | Price | $/sf | Match |
|---|---|---|---|---|---|---|---|
| 203 Maple St | 0.16mi | 3/1.0 | 1,300 (+0%) | 6mo | $170,000 | $131 | 87 |
| 208 K St | 0.18mi | 3/1.0 | 1,200 (-7%) | 1mo | $112,000 | $93 | 79 |
| 106 Oak | 0.14mi | 3/2.0 | 1,200 (-7%) | 1mo | $118,000 | $98 | 77 |
| 70 NE Deerfield Dr | 0.38mi | 3/2.0 | 1,300 (+0%) | 1mo | $224,000 | $172 | 76 |
| 107 Oak St | 0.14mi | 4/1.0 (+1) | 1,200 (-7%) | 1mo | $125,000 | $104 | 76 |
| 1105 4th Pl | 0.10mi | 3/1.5 | 1,100 (-15%) | 0mo | $159,000 | $145 | 68 |
| 611 7th St | 0.50mi | 3/2.0 | 1,300 (+0%) | 5mo | $117,000 | $90 | 68 |
| 718 5th St | 0.34mi | 3/2.0 | 1,344 (+4%) | 9mo | $226,000 | $168 | 66 |
| 311 Crestview Dr | 0.54mi | 2/1.0 (-1) | 1,244 (-4%) | 3mo | $180,000 | $145 | 61 |
| 304 Crestview Dr | 0.47mi | 3/2.0 | 1,200 (-7%) | 7mo | $185,000 | $154 | 56 |
| 209 H St | 0.41mi | 2/2.0 (-1) | 1,200 (-7%) | 14mo | $73,500 | $61 | 49 |
| 204 5th St | 0.73mi | 3/2.0 | 1,100 (-15%) | 13mo | $80,000 | $73 | 26 |
Match score weights: distance 35% · size 25% · config 20% · recency 20%. Top-matched comps best support the ARV.
Projected returns pro-forma
10.0% appreciation · 3.0% rent growth · sell at horizon
- IRR
- 29.6%
- Equity multiple
- 3.33×
- Total profit
- $123,515
- Equity at exit
- $170,266
- IRR
- 25.7%
- Equity multiple
- 7.57×
- Total profit
- $347,424
- Equity at exit
- $367,185
Cash invested: $52,920 (down + closing). Projections, not guarantees.
Landlord ↔ Tenant lean methodology
- Overall (STATE)
- 83 Strongly Landlord-Friendly
- State Oklahoma
- 83 Strongly Landlord-Friendly · R+20
- County
- — inherits STATE
- City
- — inherits STATE
ZIP-level market 73538
- Home prices YoY
- 22.9%
- Active inventory
- 95
- Price-to-rent
- 8.2×
Monthly cashflow live
- Estimated rent
- $1,913 high interval (Pro) →
- Mortgage (P&I)
- −$991
- Tax from tax record
- −$118 /mo · $1,412/yr
- Insurance
- −$79
- HOA
- −$0
- Vacancy / Maint / Mgmt
- −$402
- Net cashflow
- $324
Break-even live
UW: 25.0% down · 7.5% · 30yr · 1.5% tax · 5.0% vac · 8.0% maint · 8.0% mgmt
Financing live
Cash to close
- Down payment
- $47,250
- Closing costs
- $5,670
- Reserves months
- —
- Total cash needed
- —
Loan-product check · same deal, 3 products live
Conventional
25% down · 7.5% · 30yr
- Down + closing
- —
- Monthly P&I
- —
- Monthly cashflow
- —
- DSCR
- —
- Eligible?
- —
Personal DTI + credit; lowest rate.
DSCR
20% down · 8.5% · 30yr
- Down + closing
- —
- Monthly P&I
- —
- Monthly cashflow
- —
- DSCR
- —
- Eligible?
- —
No personal income docs; deal must DSCR.
Hard money
10% down · 12.0% · 12mo
- Down + closing
- —
- Monthly P&I
- —
- Monthly cashflow
- —
- DSCR
- —
- Eligible?
- —
Short-term bridge; refi at stabilization.
Rent comps 6 comps
| Address | Beds | Baths | Sqft | Rent | $/sqft | DOM | Units | Dist |
|---|---|---|---|---|---|---|---|---|
| 1534 Stonehouse Dr Elgin, OK | 3.0 | 2.0 | 1700 | $1,975 | $1.16 | 24d | 1 | 0.11mi |
| 107 Oak St Elgin, OK | 4.0 | 1.0 | 1300 | $1,295 | $1.00 | 12d | 1 | 0.17mi |
| 1517 Stonehouse Dr Elgin, OK | 4.0 | 2.0 | 1565 | $1,700 | $1.09 | 21d | 1 | 0.19mi |
| 1205 Alma Dr Elgin, OK | 4.0 | 2.0 | 1800 | $1,900 | $1.06 | 12d | 1 | 0.28mi |
| 313 Marilyn Glover Dr Elgin, OK | 3.0 | 2.0 | 1600 | $1,650 | $1.03 | 24d | 1 | 0.83mi |
| 1201 Kensington Ln Elgin, OK | 2.0–3.0 | 2.0–2.5 | 1414 | $1,700 | $1.20 | 24d | 1 | 1.48mi |
Listing history 2 events
-
2026-06-10remarks 699-char remark
-
2026-06-10$189,000 Under Contract
ⓘ Source: listings_history table (triggers on properties + properties_extension) + one-shot
backfill from property_details.listing_events for pre-trigger history.
Tax reassessment forecast OK · Resets to sale price
- Current annual tax
- $1,412 · $118/mo
- Projected year-2 tax
- $1,701 · $142/mo
- Expected delta
- +$289/yr (+$24/mo · 20.5%)
ⓘ Screening estimate from a state-policy table — verify with the county assessor before closing.
Climate risk First Street
- Flood 1/10 Low FEMA zone X (unshaded) · 0% chance over 30 yrs
- Wildfire 8/10 Severe
- Heat 6/10 Major 7 d/yr ≥108°F today · 19 d/yr by 30 yrs out
- Wind 2/10 Low 4% chance of damaging wind over 30 yrs
- Air quality 1/10 Low 0 unhealthy d/yr today · 0 by 30 yrs out
Nearby sold comps map
Loading sold comps map…
Walkable amenities ~0.75 mi
Loading nearby amenities…
Taxation est. · year 1
- Rental income
- $22,958
- − Mortgage interest
- −$10,587
- − Property taxes
- −$1,412
- − Insurance
- −$945
- − Repairs & maintenance
- −$1,837
- − Management
- −$1,837
- − Depreciation
- −$5,498
- Taxable income
- $842
- Est. tax owed @ 24.0%
- −$202
- After-tax cash flow
- $3,684/yr
For passive investors: Depreciation is non-cash, so a rental often shows a tax loss while cash-flowing — sheltering income. Rental losses are passive: they offset passive income freely, and up to $25,000/yr can offset ordinary (W-2) income if you actively participate and your MAGI is under $100k (phasing out to $0 by $150k); unused losses carry forward. On sale, claimed depreciation is recaptured at up to 25%, and gains may owe capital-gains tax (a 1031 exchange can defer both). Figures are a year-1 estimate at your 24.0% rate — not tax advice; consult a CPA.
Schools (NCES district)
- District
- Elgin
- NCES district ID
- 4010710
- Math proficiency
- 29% ▼ -9.00%
- Reading proficiency
- 36% ▼ -5.00%
- Median HH income
- $65,900
- Composite
- 29.77/100
- National rank
- #6432
- State rank
- #38 of 270 in OK
Livability — Elgin
- Score
- 73/100
- State rank
- #17
- US rank
- #5411
Category grades
Schools grade is shown separately in the Schools card above.
Census & demographics
- Census place
- Elgin, OK
- County
- Comanche County · 96,361 people
- City population
- 7,128
- Metro
- Lawton, OK
- Population (ZIP)
- 7,128
- Household income
- $91,324
- Rent vs Own
- Severe rent burden
- 70.0
Population outlook (Comanche County) Hauer SSP2
- Today (2025)
- 124,518 people
- By 2030
- 124,231 · -0.2%
- By 2040
- 122,193 · -1.9%
- By 2050
- 120,368 · -3.3%
- By 2075
- 120,492 · -3.2%
- By 2100
- 123,113 · -1.1%
Race, ethnicity, and origin ACS 2023
- Neighborhood character
- Predominantly White (71%)
- Race & ethnicity
- White 71% Two or more races 15% Hispanic / Latino 13% Native American 4% Black 2% Asian 1%
- Hispanic origin (detail)
- Mexican 11% Puerto Rican 2%
- Common ancestry
- Slovak 5% Romanian 2% Serbian 1%
- Foreign-born
- 3% · Canada
- Languages at home
- 93% English-only · Spanish 4% German/W. Germanic 1%
Political lean MEDSL · Comanche
- 2024 margin
- Strong R (+23.3) · D 37.4% · R 60.7% · Other 1.9%
- 2008→2024 swing
- -5.8pp toward R · 2008: -17.5pp · 2024: -23.3pp
- All cycles
- 2024: R+23.3 2020: R+20.1 2016: R+23.7 2012: R+17.0 2008: R+17.5
Not yet ingested
- Civics
- —
Market trends
- HPI YoY
- ▲ 45.70%
- Current HPI
- 245.4249
- Rent YoY
- —
- Metro
- Lawton, OK
- State GDP YoY
- ▲ 1.55%
- F500 in state
- 6
Industry mix (Fortune 500 HQ in OK)
| Industry | F500 HQs | Revenue |
|---|---|---|
| Energy | 3 | $48B |
|
||
Price history
+278.0% since first listed6 events — show timeline
- 2026-06-09 Listed $189,000 FSBO.com
- 2026-05-01 Sold (Public Records) $189,000 Public Records
- 2004-08-26 Sold (Public Records) $75,000 Public Records
- 1998-04-20 Sold (Public Records) $64,000 Public Records
- 1996-12-02 Sold (Public Records) $62,000 Public Records
- 1994-07-12 Sold (Public Records) $50,000 Public Records
Property tax history
+2.9%/yrLatest (2025): $1,412 · +1.1% YoY. Source: county tax records.
Cash-flow waterfall
monthlySold comps — $/sqft
last 12 mo · ≤1 miLoading sold comps…