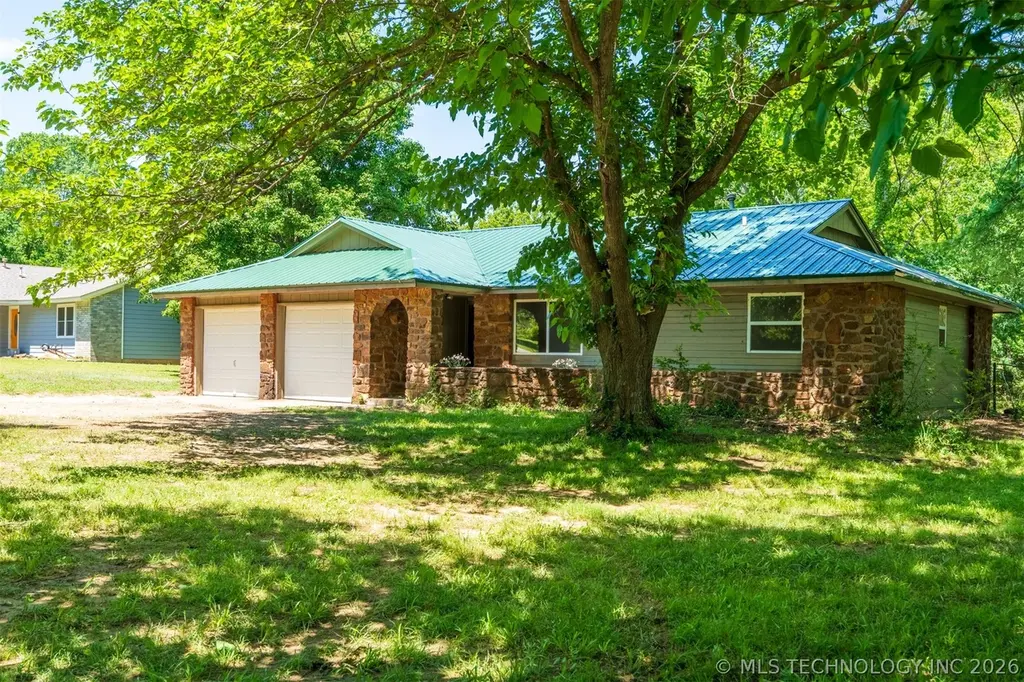
11765 E Elm St · Verdigris, OK
Flood risk 1/10 · Minimal
- FEMA flood zone
- X (unshaded)
- Chance of flooding over 30 yrs
- 0.0%
- Est. flood insurance / yr
- $507 – $1,088
Fire risk 5/10 · Moderate
- Est. fire insurance / yr
- $2,463 – $4,575
Heat risk 6/10 · Moderate
- Hot days now (above 111°F)
- 7 days/yr
- Hot days in 30 yrs
- 19 days/yr
Wind risk 3/10 · Minor
- Chance of severe wind over 30 yrs
- 4.0%
Air-quality risk 2/10 · Minimal
- Unhealthy air days now
- 1 days/yr
- Unhealthy air days in 30 yrs
- 1 days/yr
Risk factors via First Street. Map © Google.
Why this score? — see what drove the F grade
The composite is a weighted blend of 9 inputs, each scored 0–100. Each bar is that input's sub-score; the figure is the points it added to the 100-point composite (weight × sub-score).
- Cash flow +10.0/30.0
- ARV discount +7.5/15.0
- Livability +3.5/5.0
- DSCR +2.9/10.0
- Rent growth +2.5/5.0
- Condition / age +2.5/5.0
- 1% rule +2.1/10.0
- Schools +2.1/10.0
- Appreciation +0.0/10.0
$185,000
🖨 Deal sheet 📄 Offer letter ✓ Due diligence
Listing remarks MLS
Approximately . 9 acres, 3 bedrooms, 2 full baths, 2 car garage, sold "As-Is".
Key facts
- Wet weather creek
- New garage doors
- Newer vinyl windows
Tags
Property features AI
Finance
- Financial info: Annual tax information available
Exterior
- Parking: Attached garage (2 spaces)
- Security: No safety shelter
- Utilities: Cable available; Electricity available; Natural gas available; Phone available; Water available (rural); Septic tank
- Home design: Single-story; Slab foundation
- Construction: Metal roof; Stone veneer and wood siding with wood frame construction; Built per public records
- Exterior features: Covered patio and porch; Gravel driveway; Chain link fencing; Located on a cul-de-sac; Faces south
Interior
- Kitchen: Refrigerator; Range / Oven / Stove; Microwave; Dishwasher; Plumbed for ice maker; Gas water heater
- Bedrooms: Master bedroom with private bath (First floor); Bedroom (First floor); Bedroom (First floor)
- Flooring: Tile
- Bathrooms: 2 full bathrooms; Hall full bathroom (First floor)
- Heating & cooling: Central heating (gas); Central air conditioning
- Interior features: Ceiling fan(s); Laminate counters; Vinyl windows; Tile flooring; Gas range/oven connections
- Laundry & utility: Washer hookup; Electric dryer hookup; Utility room (inside, First floor)
Neighborhood map
What this means for you Summary
Snapshot
- This is a 3-bed/2.0-bath land listed at $185k.
Deal economics
- At list price, monthly cash flow is $-110 ($-1k/yr) — negative.
- To cash-flow at today's rent, offer at most $165k (10.5% below list).
- To meet the 1% rule (rent ≥ 1% of price), the offer needs to be $131k (29.1% below list).
- Recommended offer: $131k (29.1% below list) — sets the bar for 1% rule.
- Cap rate 5.6% vs local median 4.0% in Verdigris — top-decile yield for the area; either an underpriced asset or a hidden risk that comps aren't pricing in. Stress-test before assuming the spread holds.
Location & tenants
- Location reads 70/100 on livability (#40 in OK) — a middle-class / working-renter tenant base. Strengths: crime A+, cost of living A+, housing A+; Watch: amenities F, commute F, health & safety F.
- Claremore (town): math 24% / reading 25% proficiency, ranked #111 of 270 in OK (top 41%) — low school quality limits family demand, transient renter base, plan for 1-2y turnover.
- Market conditions: 118 active listings in the ZIP; 5 comparable units currently listed for rent nearby; rentals leasing fast (median 2d on market — plan ~1-2 weeks tenant-placement turnaround); solid renter incomes; 608 units permitted in Rogers County in 2024 (7 in 5+ unit buildings).
Forward outlook
- Local home prices are declining (-3.0%/yr); year-one equity from $1k of loan paydown is wiped out by about $6k of value loss. Plan a longer hold.
- Rogers County population projected at +16% by 2050 — long-run rental-demand tailwind backs the buy-and-hold thesis.
Negotiation context
- Only 11 days on market — expect competitive offers; lowballing is unlikely to land.
- 3 sale attempts since 19y ago with the ask held roughly flat each time — persistent listings suggest the price (not the market) is what's stuck; bring a comps-based counter.
- Current owner paid $50k; list at $185k implies a 270% gain — meaningful room to come down on a strong offer.
Risks & watch-outs
- Climate carrying-cost: moderate wildfire risk; extreme-heat days projected 7→19/yr by 2055 (HVAC capex compounding) — expect insurance premiums to compound above CPI over the hold.
Questions for the listing agent
- What do current leases actually rent for vs. the listed asking? Can we see a recent rent roll and the last 12 months of T-12 income?
- Built in 1978 — when were the roof, HVAC, electrical panel, plumbing, and water heater last replaced?
- Is there a deadline driving the sale (1031 exchange, divorce, estate, relocation)? That informs how much negotiation room exists.
- Schools are B-rated — typically a magnet for longer-tenancy family renters. What's the average tenant stay here, and is there a school-zone premium baked into asking?
- The area grade is low — what's the realistic commute time and amenity access for the typical tenant pool here? Any planned neighborhood developments (good or bad) we should know about?
- What's the average days-on-market for RENTAL listings here right now (not sales)? A rising rental-DOM trend means longer vacancies and softer asking-rent achievability than the comps imply.
- What's the recent tenant-quality profile in this submarket — average credit score on applications, eviction rate, late-payment / NSF rate, and stable-employment percentage? A property-management company in the area should have these aggregated.
- How much new for-sale + rental construction is in the pipeline within 1–3 miles? Heavy new supply typically softens prices + rents 12–24 months out; constrained supply supports both.
Investment metrics
- 1% rule
- 0.71% ✗
- Cap rate
- 5.58%
- Cash-on-cash
- -2.56%
- DSCR
- 0.89
- GRM
- 11.8
CMA / ARV
No comps found within radius.
Projected returns pro-forma
-3.0% appreciation · 3.0% rent growth · sell at horizon
- IRR
- -20.6%
- Equity multiple
- 0.28×
- Total profit
- $-37,073
- Equity at exit
- $27,584
- IRR
- -13.9%
- Equity multiple
- 0.20×
- Total profit
- $-41,589
- Equity at exit
- $15,995
Cash invested: $51,800 (down + closing). Projections, not guarantees.
Landlord ↔ Tenant lean methodology
- Overall (STATE)
- 83 Strongly Landlord-Friendly
- State Oklahoma
- 83 Strongly Landlord-Friendly · R+20
- County
- — inherits STATE
- City
- — inherits STATE
ZIP-level market 74019
- Home prices YoY
- -13.2%
- Active inventory
- 118
- Price-to-rent
- 11.8×
Monthly cashflow live
- Estimated rent
- $1,312 high interval (Pro) →
- Mortgage (P&I)
- −$970
- Tax from tax record
- −$100 /mo · $1,194/yr
- Insurance
- −$77
- HOA
- −$0
- Vacancy / Maint / Mgmt
- −$275
- Net cashflow
- $-110
Break-even live
UW: 25.0% down · 7.5% · 30yr · 1.5% tax · 5.0% vac · 8.0% maint · 8.0% mgmt
Financing live
Cash to close
- Down payment
- $46,250
- Closing costs
- $5,550
- Reserves months
- —
- Total cash needed
- —
Loan-product check · same deal, 3 products live
Conventional
25% down · 7.5% · 30yr
- Down + closing
- —
- Monthly P&I
- —
- Monthly cashflow
- —
- DSCR
- —
- Eligible?
- —
Personal DTI + credit; lowest rate.
DSCR
20% down · 8.5% · 30yr
- Down + closing
- —
- Monthly P&I
- —
- Monthly cashflow
- —
- DSCR
- —
- Eligible?
- —
No personal income docs; deal must DSCR.
Hard money
10% down · 12.0% · 12mo
- Down + closing
- —
- Monthly P&I
- —
- Monthly cashflow
- —
- DSCR
- —
- Eligible?
- —
Short-term bridge; refi at stabilization.
Rent comps 5 comps
| Address | Beds | Baths | Sqft | Rent | $/sqft | DOM | Units | Dist |
|---|---|---|---|---|---|---|---|---|
| 2500 Frederick Rd Claremore, OK | 2.0 | 2.0 | 908 | $1,113 | $1.23 | 1d | 3 | 1.21mi |
| 2000 Frederick Rd Claremore, OK | 1.0–2.0 | 1.0–2.0 | 762 | $1,055 | $1.38 | 1d | 1 | 1.46mi |
| 22350 S 4150 Rd Apt H104 Claremore, OK | 2.0 | 1.0 | 821 | $1,025 | $1.25 | 1d | 1 | 1.49mi |
| 22350 S 4150 Rd Unit L 103 Claremore, OK | 2.0 | 1.0 | 821 | $875 | $1.07 | 10d | 1 | 1.49mi |
| 2090 S Lynn Riggs Blvd Unit 2090-46 Claremore, OK | 2.0 | 2.0 | 775 | $1,019 | $1.31 | 19d | 1 | 1.49mi |
Listing history 11 events
-
2026-05-18status Pending
-
2026-05-08$185,000 Active
-
2017-09-29soldstatus $50,000 Closed 88-char remark
Show marketing remark (88 chars)
Approximately . 9 acres, 3 bedrooms, 2 full baths, 2 car garage, sold "As-Is".
-
2017-06-06status Pending 88-char remark
Show marketing remark (88 chars)
Approximately . 9 acres, 3 bedrooms, 2 full baths, 2 car garage, sold "As-Is".
-
2017-05-27price $45,000 88-char remark
Show marketing remark (88 chars)
Approximately . 9 acres, 3 bedrooms, 2 full baths, 2 car garage, sold "As-Is".
-
2017-04-10price $70,900 88-char remark
Show marketing remark (88 chars)
Approximately . 9 acres, 3 bedrooms, 2 full baths, 2 car garage, sold "As-Is".
-
2017-03-06price $74,575 88-char remark
Show marketing remark (88 chars)
Approximately . 9 acres, 3 bedrooms, 2 full baths, 2 car garage, sold "As-Is".
-
2017-02-07$78,500 Active 88-char remark
Show marketing remark (88 chars)
Approximately . 9 acres, 3 bedrooms, 2 full baths, 2 car garage, sold "As-Is".
-
2007-11-23historical
-
2007-05-22$102,900
-
1999-11-01soldstatus $77,000
ⓘ Source: listings_history table (triggers on properties + properties_extension) + one-shot
backfill from property_details.listing_events for pre-trigger history.
Tax reassessment forecast OK · Resets to sale price
- Current annual tax
- $1,194 · $100/mo
- Projected year-2 tax
- $1,665 · $139/mo
- Expected delta
- +$471/yr (+$39/mo · 39.4%)
ⓘ Screening estimate from a state-policy table — verify with the county assessor before closing.
Climate risk First Street
- Flood 1/10 Low FEMA zone X (unshaded) · 0% chance over 30 yrs
- Wildfire 5/10 Major
- Heat 6/10 Major 7 d/yr ≥111°F today · 19 d/yr by 30 yrs out
- Wind 3/10 Moderate 4% chance of damaging wind over 30 yrs
- Air quality 2/10 Low 1 unhealthy d/yr today · 1 by 30 yrs out
Nearby sold comps map
Loading sold comps map…
Walkable amenities ~0.75 mi
Loading nearby amenities…
Taxation est. · year 1
- Rental income
- $15,741
- − Mortgage interest
- −$10,363
- − Property taxes
- −$1,194
- − Insurance
- −$925
- − Repairs & maintenance
- −$1,259
- − Management
- −$1,259
- − Depreciation
- −$5,382
- Taxable loss
- −$4,641
- Est. tax savings @ 24.0%
- +$1,114
- After-tax cash flow
- $-211/yr
For passive investors: Depreciation is non-cash, so a rental often shows a tax loss while cash-flowing — sheltering income. Rental losses are passive: they offset passive income freely, and up to $25,000/yr can offset ordinary (W-2) income if you actively participate and your MAGI is under $100k (phasing out to $0 by $150k); unused losses carry forward. On sale, claimed depreciation is recaptured at up to 25%, and gains may owe capital-gains tax (a 1031 exchange can defer both). Figures are a year-1 estimate at your 24.0% rate — not tax advice; consult a CPA.
Schools (NCES district)
- District
- Claremore
- NCES district ID
- 4007740
- Math proficiency
- 24% ▼ -12.00%
- Reading proficiency
- 25% ▼ -11.00%
- Median HH income
- $44,946
- Composite
- 21.16/100
- National rank
- #8426
- State rank
- #111 of 270 in OK
Livability — Verdigris
- Score
- 70/100
- State rank
- #40
- US rank
- #7775
Category grades
Schools grade is shown separately in the Schools card above.
Census & demographics
- County
- Rogers County · 50,229 people
- Metro
- Tulsa, OK
- Population (ZIP)
- 21,023
- Household income
- $84,342
- Rent vs Own
- Severe rent burden
- 150.0
Population outlook (Rogers County) Hauer SSP2
- Today (2025)
- 100,211 people
- By 2030
- 104,381 · +4.2%
- By 2040
- 111,567 · +11.3%
- By 2050
- 116,791 · +16.5%
- By 2075
- 129,134 · +28.9%
- By 2100
- 132,326 · +32.0%
Race, ethnicity, and origin ACS 2023
- Neighborhood character
- Predominantly White (70%)
- Race & ethnicity
- White 70% Native American 13% Two or more races 11% Hispanic / Latino 6% Asian 1%
- Hispanic origin (detail)
- Mexican 5%
- Common ancestry
- Lithuanian 2% Romanian 2% Slovak 2%
- Foreign-born
- 3% · Canada, Vietnam
- Languages at home
- 95% English-only · Spanish 3% Other Asian/Pacific 1%
Political lean MEDSL · Rogers
- 2024 margin
- Solid R (+55.0) · D 21.6% · R 76.6% · Other 1.7%
- 2008→2024 swing
- -10.9pp toward R · 2008: -44.1pp · 2024: -55.0pp
- All cycles
- 2024: R+55.0 2020: R+54.9 2016: R+56.3 2012: R+50.1 2008: R+44.1
Not yet ingested
- Civics
- —
Market trends
- HPI YoY
- ▼ -32.22%
- Current HPI
- 210.9691
- Rent YoY
- —
- Metro
- Tulsa, OK
- State GDP YoY
- ▲ 1.55%
- F500 in state
- 6
Industry mix (Fortune 500 HQ in OK)
| Industry | F500 HQs | Revenue |
|---|---|---|
| Energy | 3 | $48B |
|
||
Price history
+140.3% since first listed11 events — show timeline
- 2026-05-18 Pending — MLS Technology, Inc.
- 2026-05-08 Listed $185,000 MLS Technology, Inc.
- 2017-09-29 Sold (MLS) $50,000 MLS Technology, Inc.
- 2017-06-06 Pending — MLS Technology, Inc.
- 2017-05-27 Price Changed $45,000 MLS Technology, Inc.
- 2017-04-10 Price Changed $70,900 MLS Technology, Inc.
- 2017-03-06 Price Changed $74,575 MLS Technology, Inc.
- 2017-02-07 Listed $78,500 MLS Technology, Inc.
- 2007-11-23 Listing Removed — MLS Technology, Inc.
- 2007-05-22 Listed $102,900 MLS Technology, Inc.
- 1999-11-01 Sold (Public Records) $77,000 Public Records
Property tax history
+1.9%/yrLatest (2025): $1,194 · +11.6% YoY. Source: county tax records.
Cash-flow waterfall
monthlySold comps — $/sqft
last 12 mo · ≤1 miLoading sold comps…