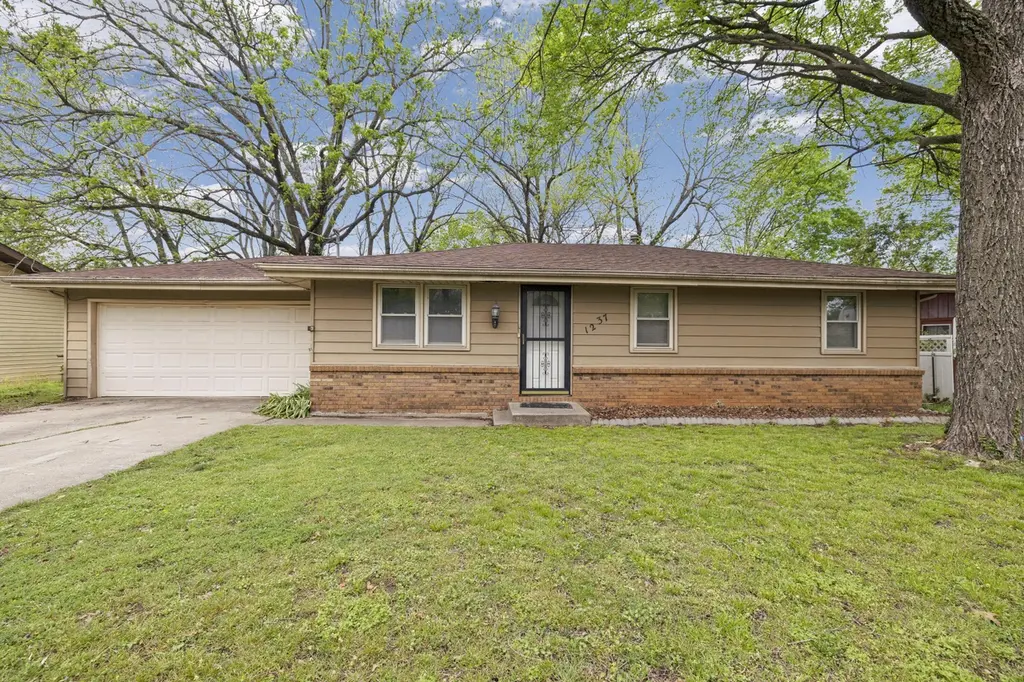
1237 S Brite Ave · Springfield, MO
Flood risk 1/10 · Minimal
- FEMA flood zone
- X (unshaded)
- Chance of flooding over 30 yrs
- 0.0%
- Est. flood insurance / yr
- $507 – $1,088
Fire risk 1/10 · Minimal
- Est. fire insurance / yr
- $1,054 – $1,958
Heat risk 5/10 · Moderate
- Hot days now (above 104°F)
- 7 days/yr
- Hot days in 30 yrs
- 19 days/yr
Wind risk 2/10 · Minimal
- Chance of severe wind over 30 yrs
- 0.0%
Air-quality risk 2/10 · Minimal
- Unhealthy air days now
- 1 days/yr
- Unhealthy air days in 30 yrs
- 2 days/yr
Risk factors via First Street. Map © Google.
Why this score? — see what drove the C- grade
The composite is a weighted blend of 9 inputs, each scored 0–100. Each bar is that input's sub-score; the figure is the points it added to the 100-point composite (weight × sub-score).
- Cash flow +16.1/30.0
- ARV discount +14.0/15.0
- DSCR +5.0/10.0
- Livability +3.8/5.0
- 1% rule +3.6/10.0
- Rent growth +3.2/5.0
- Schools +3.2/10.0
- Condition / age +2.5/5.0
- Appreciation +0.0/10.0
$175,000
🖨 Deal sheet 📄 Offer letter ✓ Due diligence
Listing remarks MLS
1237 S Brite Ave offers 3 bedrooms, 1.5 baths, 2 living areas, a wood burning fireplace, a formal dining room, & a 2 car garage. The spacious layout provides flexibility for everyday living, entertaining, or creating a separate second living space, office, or hobby area. The formal dining room adds charm & functionality, while the fireplace brings warmth & character to the home. Outside, you will find a large fenced yard, a covered back porch, & a storage shed that adds extra room for tools, lawn equipment, or seasonal items. With a little TLC, this home has the potential to offer instant equity for the next owner. Conveniently located near shopping, dining, schools, parks, & other Springfield amenities, this property would be a great fit for a first time home buyer, someone looking to downsize, or an investor seeking opportunity!
Key facts
- 0.34 acre lot
- 2 garage spots
- Built 1978
Neighborhood map
What this means for you Summary
Snapshot
- This is a 3-bed/1.5-bath single-family listed at $175k.
Deal economics
- At list price, monthly cash flow is $90 ($1k/yr) — positive.
- The deal already cash-flows at list — no discount required.
- To meet the 1% rule (rent ≥ 1% of price), the offer needs to be $150k (14.1% below list).
- Recommended offer: $150k (14.1% below list) — sets the bar for 1% rule.
- Cap rate 6.9% vs local median 4.6% in Springfield — top-decile yield for the area; either an underpriced asset or a hidden risk that comps aren't pricing in. Stress-test before assuming the spread holds.
Location & tenants
- Location reads 75/100 on livability (#57 in MO, #4,121 nationally) — a middle-class / working-renter tenant base. Strengths: commute A+, cost of living A+, housing A+; Watch: crime F, employment F.
- Springfield R-XII (urban): math 32% / reading 46% proficiency, ranked #174 of 324 in MO (top 54%) — families likely to look elsewhere, expect single-tenant / working-renter base with shorter leases.
- Market conditions: Rents rising (+2.6%/yr); 249 active listings in the ZIP; 10 comparable units currently listed for rent nearby; rentals at typical pace (median 14d on market — plan ~3-4 weeks tenant-placement turnaround); 1,302 units permitted in Greene County in 2024 (250 in 5+ unit buildings).
- This rent runs 33% of the median local income ($54k/yr) — at the standard rent-burdened threshold; future hikes will face affordability resistance.
Forward outlook
- Local home prices are declining (-3.0%/yr); year-one equity from $1k of loan paydown is wiped out by about $5k of value loss. Plan a longer hold.
- Greene County population projected at +25% by 2050 — long-run rental-demand tailwind backs the buy-and-hold thesis.
Negotiation context
- It's been on market 49 days — a 3% lower offer ($170k) is reasonable based on typical stale-listing flexibility.
- 2 sale attempts since 9y ago; this cycle's ask has dropped $15k (8%) from the opening price — seller is motivated, your offer sets the floor, not the list.
Risks & watch-outs
- Climate carrying-cost: extreme-heat days projected 7→19/yr by 2055 (HVAC capex compounding) — expect insurance premiums to compound above CPI over the hold.
Questions for the listing agent
- It's been on market 49 days. Have you received any prior offers? Is the seller open to a 14% concession, seller financing, or rate buy-down credit?
- Built in 1978 — when were the roof, HVAC, electrical panel, plumbing, and water heater last replaced?
- Is there a deadline driving the sale (1031 exchange, divorce, estate, relocation)? That informs how much negotiation room exists.
- Crime grade is F in this area — have there been break-ins, vandalism, or insurance claims at this property in the last 3 years? What carrier currently insures it and at what premium?
- What's the average days-on-market for RENTAL listings here right now (not sales)? A rising rental-DOM trend means longer vacancies and softer asking-rent achievability than the comps imply.
- What's the recent tenant-quality profile in this submarket — average credit score on applications, eviction rate, late-payment / NSF rate, and stable-employment percentage? A property-management company in the area should have these aggregated.
- How much new for-sale + rental construction is in the pipeline within 1–3 miles? Heavy new supply typically softens prices + rents 12–24 months out; constrained supply supports both.
Investment metrics
- 1% rule
- 0.86% ✗
- Cap rate
- 6.91%
- Cash-on-cash
- 2.21%
- DSCR
- 1.10
- GRM
- 9.7
CMA / ARV
- ARV (median comp)
- $204,492
- List price
- $175,000
- Delta
- -14.42%
- Verdict
- UNDERPRICED
- Comps
- 20 within 1.0 mi
Show comp detail 12 sales within ~0.75 mi
| Address | Dist | Beds/Ba | Sqft | Sold | Price | $/sf | Match |
|---|---|---|---|---|---|---|---|
| 3224 W Lombard St | 0.43mi | 3/2.0 | 1,360 (-13%) | 0mo | $179,900 | $132 | 57 |
| 1048 S Overhill Ave | 0.32mi | 3/2.0 | 1,394 (-10%) | 12mo | $225,900 | $162 | 56 |
| 1044 S Overhill Ave | 0.33mi | 3/2.0 | 1,394 (-10%) | 15mo | $229,900 | $165 | 53 |
| 3644 W Page St | 0.66mi | 3/2.0 | 1,624 (+4%) | 10mo | $260,000 | $160 | 52 |
| 3825 W Parkridge Cir | 0.71mi | 3/2.0 | 1,452 (-7%) | 4mo | $244,000 | $168 | 51 |
| 3245 W Lombard St | 0.44mi | 3/2.0 | 1,357 (-13%) | 6mo | $210,000 | $155 | 50 |
| 915 S Oak Park Ave | 0.72mi | 3/2.0 | 1,662 (+7%) | 4mo | $219,000 | $132 | 50 |
| 3240 W Page St | 0.50mi | 3/2.0 | 1,375 (-12%) | 12mo | $250,000 | $182 | 45 |
| 3747 W Lombard St | 0.71mi | 3/2.0 | 1,433 (-8%) | 14mo | $246,000 | $172 | 40 |
| 835 S Suburban Ave | 0.62mi | 3/2.0 | 1,334 (-14%) | 12mo | $215,000 | $161 | 35 |
| 3645 W Page St | 0.68mi | 3/2.0 | 1,333 (-14%) | 12mo | $230,000 | $173 | 32 |
| 1124 S Homewood Ave | 0.74mi | 3/2.0 | 1,328 (-15%) | 12mo | $184,900 | $139 | 28 |
Match score weights: distance 35% · size 25% · config 20% · recency 20%. Top-matched comps best support the ARV.
Projected returns pro-forma
-3.0% appreciation · 2.6% rent growth · sell at horizon
- IRR
- -13.2%
- Equity multiple
- 0.53×
- Total profit
- $-23,263
- Equity at exit
- $26,093
- IRR
- -4.9%
- Equity multiple
- 0.68×
- Total profit
- $-15,503
- Equity at exit
- $15,131
Cash invested: $49,000 (down + closing). Projections, not guarantees.
Landlord ↔ Tenant lean methodology
- Overall (STATE)
- 81 Strongly Landlord-Friendly
- State Missouri
- 81 Strongly Landlord-Friendly · R+10
- County
- — inherits STATE
- City
- — inherits STATE
ZIP-level market 65807
- Rents YoY
- 2.6%
- Active inventory
- 249
- Price-to-rent
- 9.7×
Monthly cashflow live
- Estimated rent
- $1,503 high interval (Pro) →
- Mortgage (P&I)
- −$918
- Tax from tax record
- −$107 /mo · $1,279/yr
- Insurance
- −$73
- HOA
- −$0
- Vacancy / Maint / Mgmt
- −$316
- Net cashflow
- $90
Break-even live
UW: 25.0% down · 7.5% · 30yr · 1.5% tax · 5.0% vac · 8.0% maint · 8.0% mgmt
Financing live
Cash to close
- Down payment
- $43,750
- Closing costs
- $5,250
- Reserves months
- —
- Total cash needed
- —
Loan-product check · same deal, 3 products live
Conventional
25% down · 7.5% · 30yr
- Down + closing
- —
- Monthly P&I
- —
- Monthly cashflow
- —
- DSCR
- —
- Eligible?
- —
Personal DTI + credit; lowest rate.
DSCR
20% down · 8.5% · 30yr
- Down + closing
- —
- Monthly P&I
- —
- Monthly cashflow
- —
- DSCR
- —
- Eligible?
- —
No personal income docs; deal must DSCR.
Hard money
10% down · 12.0% · 12mo
- Down + closing
- —
- Monthly P&I
- —
- Monthly cashflow
- —
- DSCR
- —
- Eligible?
- —
Short-term bridge; refi at stabilization.
Rent comps 10 comps
| Address | Beds | Baths | Sqft | Rent | $/sqft | DOM | Units | Dist |
|---|---|---|---|---|---|---|---|---|
| 1152 S Hillcrest Ave Springfield, MO | 3.0 | 1.5 | 1240 | $1,300 | $1.05 | 44d | 1 | 0.46mi |
| 1365 S Scenic Ave Springfield, MO | 3.0 | 2.0 | 1328 | $1,550 | $1.17 | 13d | 1 | 0.80mi |
| 1623 S Burks Ave Springfield, MO | 3.0 | 2.0 | 1656 | $1,895 | $1.14 | 44d | 1 | 0.94mi |
| 3002 W Elm St Springfield, MO | 3.0 | 2.0 | 1128 | $1,295 | $1.15 | 21d | 1 | 1.06mi |
| 1015 S Meteor Ave Springfield, MO | 3.0 | 2.0 | 1310 | $1,800 | $1.37 | 14d | 1 | 1.08mi |
| 412 S Duke Ave Springfield, MO | 3.0 | 1.0 | 1400 | $1,585 | $1.13 | 13d | 1 | 1.13mi |
| 250 N Hilton Ave Springfield, MO | 2.0 | 2.0 | 1153 | $628 | $0.54 | 13d | 1 | 1.18mi |
| 2412 W Lincoln St Springfield, MO | 3.0 | 1.0 | 1260 | $1,295 | $1.03 | 23d | 1 | 1.43mi |
| 2602 W College St Springfield, MO | 2.0 | 1.0 | 1350 | $995 | $0.74 | 13d | 1 | 1.45mi |
| 1969 S Bryson Cir Unit 1967 Springfield, MO | 3.0 | 2.0 | 1250 | $1,300 | $1.04 | 14d | 1 | 1.45mi |
Listing history 12 events
-
2026-06-07statusdays on market $175,000 Pending 49 DOM
-
2026-06-03days on market $175,000 Active 47 DOM
-
2026-06-02days on market $175,000 Active 46 DOM
-
2026-06-01days on market $175,000 Active 45 DOM
-
2026-06-01price $175,000 Active 44 DOM
-
2026-05-31days on market $185,000 Active 44 DOM
-
2026-05-30days on market $185,000 Active 43 DOM
-
2026-05-15price $185,000 869-char remark
Show marketing remark (869 chars)
1237 S Brite Ave offers 3 bedrooms, 1.5 baths, 2 living areas, a wood burning fireplace, a formal dining room, & a 2 car garage. The spacious layout provides flexibility for everyday living, entertaining, or creating a separate second living space, office, or hobby area. The formal dining room adds charm & functionality, while the fireplace brings warmth & character to the home. Outside, you will find a large fenced yard, a covered back porch, & a storage shed that adds extra room for tools, lawn equipment, or seasonal items. With a little TLC, this home has the potential to offer instant equity for the next owner. Conveniently located near shopping, dining, schools, parks, & other Springfield amenities, this property would be a great fit for a first time home buyer, someone looking to downsize, or an investor seeking opportunity!
-
2026-04-17$190,000 Active 869-char remark
Show marketing remark (869 chars)
1237 S Brite Ave offers 3 bedrooms, 1.5 baths, 2 living areas, a wood burning fireplace, a formal dining room, & a 2 car garage. The spacious layout provides flexibility for everyday living, entertaining, or creating a separate second living space, office, or hobby area. The formal dining room adds charm & functionality, while the fireplace brings warmth & character to the home. Outside, you will find a large fenced yard, a covered back porch, & a storage shed that adds extra room for tools, lawn equipment, or seasonal items. With a little TLC, this home has the potential to offer instant equity for the next owner. Conveniently located near shopping, dining, schools, parks, & other Springfield amenities, this property would be a great fit for a first time home buyer, someone looking to downsize, or an investor seeking opportunity!
-
2018-03-13soldstatus
-
2018-03-12soldstatus 149-char remark
Show marketing remark (149 chars)
Great find on this 3 Bedroom 1.5 bath 2 car garage with large 2nd living area and formal dining room. Call for a showing today, this won't last long.
-
2017-10-13$109,900 149-char remark
Show marketing remark (149 chars)
Great find on this 3 Bedroom 1.5 bath 2 car garage with large 2nd living area and formal dining room. Call for a showing today, this won't last long.
ⓘ Source: listings_history table (triggers on properties + properties_extension) + one-shot
backfill from property_details.listing_events for pre-trigger history.
Tax reassessment forecast MO · Resets to sale price
- Current annual tax
- $1,279 · $107/mo
- Projected year-2 tax
- $1,698 · $141/mo
- Expected delta
- +$418/yr (+$35/mo · 32.7%)
ⓘ Screening estimate from a state-policy table — verify with the county assessor before closing.
Climate risk First Street
- Flood 1/10 Low FEMA zone X (unshaded) · 0% chance over 30 yrs
- Wildfire 1/10 Low
- Heat 5/10 Major 7 d/yr ≥104°F today · 19 d/yr by 30 yrs out
- Wind 2/10 Low 0% chance of damaging wind over 30 yrs
- Air quality 2/10 Low 1 unhealthy d/yr today · 2 by 30 yrs out
Nearby sold comps map
Loading sold comps map…
Walkable amenities ~0.75 mi
Loading nearby amenities…
Taxation est. · year 1
- Rental income
- $18,037
- − Mortgage interest
- −$9,803
- − Property taxes
- −$1,279
- − Insurance
- −$875
- − Repairs & maintenance
- −$1,443
- − Management
- −$1,443
- − Depreciation
- −$5,091
- Taxable loss
- −$1,897
- Est. tax savings @ 24.0%
- +$455
- After-tax cash flow
- $1,537/yr
For passive investors: Depreciation is non-cash, so a rental often shows a tax loss while cash-flowing — sheltering income. Rental losses are passive: they offset passive income freely, and up to $25,000/yr can offset ordinary (W-2) income if you actively participate and your MAGI is under $100k (phasing out to $0 by $150k); unused losses carry forward. On sale, claimed depreciation is recaptured at up to 25%, and gains may owe capital-gains tax (a 1031 exchange can defer both). Figures are a year-1 estimate at your 24.0% rate — not tax advice; consult a CPA.
Schools (NCES district)
- District
- Springfield R-XII
- NCES district ID
- 2928860
- Math proficiency
- 32% ▼ -2.00%
- Reading proficiency
- 46% ▼ -3.00%
- Median HH income
- $37,886
- Composite
- 32.45/100
- National rank
- #5717
- State rank
- #174 of 324 in MO
Livability — Springfield
- Score
- 75/100
- State rank
- #57
- US rank
- #4121
Category grades
Schools grade is shown separately in the Schools card above.
Census & demographics
- County
- Greene County · 244,327 people
- City population
- 223,044
- Metro
- Springfield, MO
- Population (ZIP)
- 56,659
- Household income
- $53,870
- Rent vs Own
- Severe rent burden
- 3420.0
Population outlook (Greene County) Hauer SSP2
- Today (2025)
- 319,054 people
- By 2030
- 335,135 · +5.0%
- By 2040
- 366,186 · +14.8%
- By 2050
- 397,431 · +24.6%
- By 2075
- 477,035 · +49.5%
- By 2100
- 520,828 · +63.2%
Race, ethnicity, and origin ACS 2023
- Neighborhood character
- Predominantly White (81%)
- Race & ethnicity
- White 81% Two or more races 8% Hispanic / Latino 7% Black 4% Asian 3%
- Hispanic origin (detail)
- Mexican 4%
- Common ancestry
- Italian 3% Lithuanian 2% Slovak 2%
- Foreign-born
- 4% · Canada, South Korea
- Languages at home
- 94% English-only · Spanish 2% Other Asian/Pacific 1% Arabic 1%
Political lean MEDSL · Greene
- 2024 margin
- Strong R (+20.8) · D 38.9% · R 59.7% · Other 1.4%
- 2008→2024 swing
- -5.0pp toward R · 2008: -15.8pp · 2024: -20.8pp
- All cycles
- 2024: R+20.8 2020: R+20.1 2016: R+27.4 2012: R+24.4 2008: R+15.8
Not yet ingested
- Civics
- —
Market trends
- HPI YoY
- ▼ -205.97%
- Current HPI
- 210.4358
- Rent YoY
- ▲ 2.60%
- Metro
- Springfield, MO
- State GDP YoY
- ▲ 1.84%
- F500 in state
- 20
Industry mix (Fortune 500 HQ in MO)
| Industry | F500 HQs | Revenue |
|---|---|---|
| Healthcare | 1 | $163B |
|
||
| Insurance | 1 | $21B |
|
||
| Industrial Technology | 1 | $17B |
|
||
| Retail | 1 | $16B |
|
||
| Industrial Distribution | 1 | $10B |
|
||
| Utilities | 1 | $9B |
|
||
Price history
+68.3% since first listed5 events — show timeline
- 2026-05-15 Price Changed $185,000 SOMO
- 2026-04-17 Listed $190,000 SOMO
- 2018-03-13 Sold (Public Records) — Public Records
- 2018-03-12 Sold (MLS) — SOMO
- 2017-10-13 Listed $109,900 SOMO
Property tax history
+3.5%/yrLatest (2025): $1,279 · +15.0% YoY. Source: county tax records.
Cash-flow waterfall
monthlySold comps — $/sqft
last 12 mo · ≤1 miLoading sold comps…