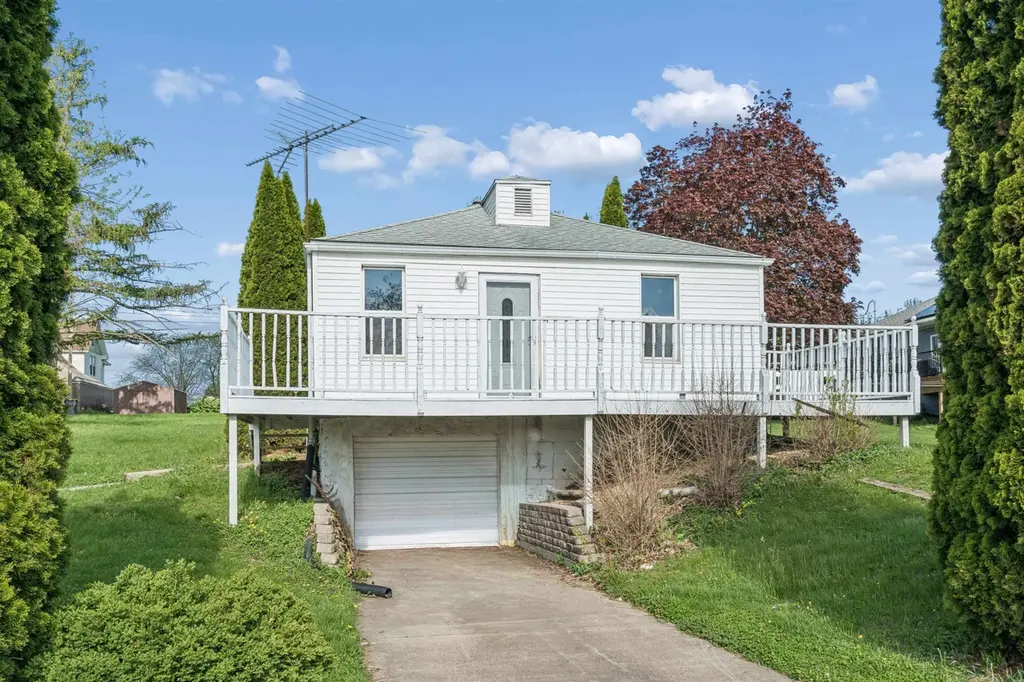
361 Clinton Ave · East Dubuque, IL
Flood risk 1/10 · Minimal
- FEMA flood zone
- X (unshaded)
- Chance of flooding over 30 yrs
- 0.0%
- Est. flood insurance / yr
- $507 – $1,088
Fire risk 1/10 · Minimal
- Est. fire insurance / yr
- $804 – $1,492
Heat risk 3/10 · Minor
- Hot days now (above 102°F)
- 7 days/yr
- Hot days in 30 yrs
- 15 days/yr
Wind risk 2/10 · Minimal
- Chance of severe wind over 30 yrs
- —
Air-quality risk 2/10 · Minimal
- Unhealthy air days now
- 1 days/yr
- Unhealthy air days in 30 yrs
- 2 days/yr
Risk factors via First Street. Map © Google.
Why this score? — see what drove the C grade
The composite is a weighted blend of 9 inputs, each scored 0–100. Each bar is that input's sub-score; the figure is the points it added to the 100-point composite (weight × sub-score).
- Cash flow +25.6/30.0
- DSCR +8.5/10.0
- 1% rule +6.7/10.0
- ARV discount +5.5/15.0
- Livability +3.6/5.0
- Schools +3.0/10.0
- Rent growth +2.5/5.0
- Condition / age +2.5/5.0
- Appreciation +0.0/10.0
$149,000
🖨 Deal sheet 📄 Offer letter ✓ Due diligence
Listing remarks
OPEN HOUSE SUNDAY JUNE 21st - 12:30 - 1:30 Perched atop one of the scenic hills of East Dubuque, 361 Clinton Avenue is a home filled with character, history, and opportunity. This charming 3-bedroom, 1-bath residence has been lovingly cared for by the same owner for nearly 60 years—a true testament to its warmth and livability. Inside, you’ll find beautifully refinished, gleaming wood floors that bring brightness and timeless appeal to the space. While the home is fully functional and move-in ready, the seller continues to improve the property and invites the next owner to add their own vision and updates to bring it to modern standards. Step outside and enjoy the large front
Key facts
- 0.31-acre lot
- One-car garage
- Elevated views
Tags
Property features AI
Exterior
- Parking: 1 parking space (off-site)
- Utilities: Public water; Public sewer
- Home design: Single-family detached residence; One story
- Construction: Shingle roof; Stone foundation; Approximately 1,300 above-grade finished area
- Exterior features: Deck; Zoned residential lot
Interior
- Kitchen: Refrigerator; Range
- Bedrooms: 3 bedrooms on the main level
- Bathrooms: 1 full bathroom on the main level
- Heating & cooling: Forced air heating (natural gas); Window air conditioning units
- Interior features: Window treatments; Full basement
- Laundry & utility: Laundry located on the lower level
Neighborhood map
What this means for you Summary
Snapshot
- This is a 3-bed/1.0-bath single-family listed at $149k.
Deal economics
- At list price, monthly cash flow is $353 ($4k/yr) — positive.
- The deal already cash-flows at list — no discount required.
- Meets the 1% rule at list price ($2k rent vs $149k).
- Recommended offer: $145k (3.0% below list) — sets the bar for market timing.
Location & tenants
- Location reads 71/100 on livability (#349 in IL) — a middle-class / working-renter tenant base. Strengths: crime A+, cost of living A+, housing A+; Watch: health & safety C-, amenities F, commute F.
- East Dubuque USD 119 (suburban): math 27% / reading 41% proficiency, ranked #196 of 620 in IL (top 32%) — families likely to look elsewhere, expect single-tenant / working-renter base with shorter leases.
- Zoned schools: East Dubuque Elem School (math 22% / reading 32%, grade F, #749 of 2,056 statewide, top 40%, 348 students, 0% FRL); East Dubuque Jr High (math 37% / reading 62%, grade C, #51 of 665 statewide, top 9%, 89 students, 0% FRL) — zoned schools average 0% FRL vs 25% district-wide (25 pts lower); this property's tenant base skews higher-income than the district average.
- Market conditions: 28 active listings in the ZIP; 1 comparable units currently listed for rent nearby; 58 units permitted in Jo Daviess County in 2024 (0 in 5+ unit buildings).
Forward outlook
- Local home prices are declining (-3.0%/yr); year-one equity from $1k of loan paydown is wiped out by about $4k of value loss. Plan a longer hold.
- Jo Daviess County population projected at -25% by 2050 — secular population decline; favor cash flow + early exit over multi-decade hold.
Negotiation context
- It's been on market 50 days — a 3% lower offer ($145k) is reasonable based on typical stale-listing flexibility.
Risks & watch-outs
- Watch-outs: built in 1900 — expect roof / HVAC / electrical / plumbing capex.
Questions for the listing agent
- It's been on market 50 days. Have you received any prior offers? Is the seller open to a 3% concession, seller financing, or rate buy-down credit?
- Built in 1900 — when were the roof, HVAC, electrical panel, plumbing, and water heater last replaced?
- Is there a deadline driving the sale (1031 exchange, divorce, estate, relocation)? That informs how much negotiation room exists.
- Schools are D-rated, which usually means shorter tenancies and higher turnover. Who's the typical renter profile here, and what's been the actual vacancy rate?
- What's the average days-on-market for RENTAL listings here right now (not sales)? A rising rental-DOM trend means longer vacancies and softer asking-rent achievability than the comps imply.
- What's the recent tenant-quality profile in this submarket — average credit score on applications, eviction rate, late-payment / NSF rate, and stable-employment percentage? A property-management company in the area should have these aggregated.
- How much new for-sale + rental construction is in the pipeline within 1–3 miles? Heavy new supply typically softens prices + rents 12–24 months out; constrained supply supports both.
Investment metrics
- 1% rule
- 1.17% ✓
- Cap rate
- 9.13%
- Cash-on-cash
- 10.15%
- DSCR
- 1.45
- GRM
- 7.1
CMA / ARV
- ARV (median comp)
- $142,511
- List price
- $149,000
- Delta
- 4.55%
- Verdict
- FAIR
- Comps
- 20 within 1.0 mi
Show comp detail 9 sales within ~0.75 mi
| Address | Dist | Beds/Ba | Sqft | Sold | Price | $/sf | Match |
|---|---|---|---|---|---|---|---|
| 351 Wisconsin St | 0.18mi | 3/1.5 | 1,344 (+3%) | 8mo | $110,000 | $82 | 77 |
| 400 Livingston Ave | 0.12mi | 3/2.5 | 1,224 (-6%) | 6mo | $158,000 | $129 | 74 |
| 324 Wisconsin Ave | 0.21mi | 2/1.5 (-1) | 1,301 (+0%) | 13mo | $65,000 | $50 | 72 |
| 301 Gramercy St | 0.19mi | 3/1.0 | 1,458 (+12%) | 2mo | $130,000 | $89 | 69 |
| 450 Oxford St | 0.10mi | 3/1.5 | 1,152 (-11%) | 10mo | $187,527 | $163 | 66 |
| 203 Wisconsin St | 0.23mi | 2/2.0 (-1) | 1,164 (-10%) | 6mo | $100,000 | $86 | 58 |
| 390 Greenwood Ave | 0.19mi | 3/1.5 | 1,129 (-13%) | 13mo | $139,900 | $124 | 56 |
| 174 Wisconsin Ave | 0.28mi | 3/1.0 | 1,110 (-15%) | 13mo | $168,000 | $151 | 52 |
| 209 Hill St | 0.37mi | 3/1.0 | 1,140 (-12%) | 21mo | $184,900 | $162 | 45 |
Match score weights: distance 35% · size 25% · config 20% · recency 20%. Top-matched comps best support the ARV.
Projected returns pro-forma
-3.0% appreciation · 3.0% rent growth · sell at horizon
- IRR
- -1.0%
- Equity multiple
- 0.96×
- Total profit
- $-1,648
- Equity at exit
- $22,216
- IRR
- 8.7%
- Equity multiple
- 1.66×
- Total profit
- $27,605
- Equity at exit
- $12,883
Cash invested: $41,720 (down + closing). Projections, not guarantees.
Landlord ↔ Tenant lean methodology
- Overall (STATE)
- 43 Moderately Tenant-Leaning
- State Illinois
- 43 Moderately Tenant-Leaning · D+7
- County
- — inherits STATE
- City
- — inherits STATE
ZIP-level market 61025
- Home prices YoY
- -33.0%
- Active inventory
- 28
- Price-to-rent
- 7.1×
Monthly cashflow live
- Estimated rent
- $1,750 medium interval (Pro) →
- Mortgage (P&I)
- −$781
- Tax est. 1.5%
- −$186 /mo · $2,235/yr
- Insurance
- −$62
- HOA
- −$0
- Vacancy / Maint / Mgmt
- −$368
- Net cashflow
- $353
Break-even live
UW: 25.0% down · 7.5% · 30yr · 1.5% tax · 5.0% vac · 8.0% maint · 8.0% mgmt
Financing live
Cash to close
- Down payment
- $37,250
- Closing costs
- $4,470
- Reserves months
- —
- Total cash needed
- —
Loan-product check · same deal, 3 products live
Conventional
25% down · 7.5% · 30yr
- Down + closing
- —
- Monthly P&I
- —
- Monthly cashflow
- —
- DSCR
- —
- Eligible?
- —
Personal DTI + credit; lowest rate.
DSCR
20% down · 8.5% · 30yr
- Down + closing
- —
- Monthly P&I
- —
- Monthly cashflow
- —
- DSCR
- —
- Eligible?
- —
No personal income docs; deal must DSCR.
Hard money
10% down · 12.0% · 12mo
- Down + closing
- —
- Monthly P&I
- —
- Monthly cashflow
- —
- DSCR
- —
- Eligible?
- —
Short-term bridge; refi at stabilization.
Rent comps 1 comps
| Address | Beds | Baths | Sqft | Rent | $/sqft | DOM | Units | Dist |
|---|---|---|---|---|---|---|---|---|
| 333 E 10th St Dubuque, IA | 2.0 | 2.0 | 1530 | $1,750 | $1.14 | 43d | 3 | 1.24mi |
Listing history 18 events
-
2026-06-19days on market $149,000 Active 50 DOM
-
2026-06-18days on market $149,000 Active 49 DOM
-
2026-06-17days on market $149,000 Active 48 DOM
-
2026-06-16days on market $149,000 Active 47 DOM
-
2026-06-15days on market $149,000 Active 46 DOM
-
2026-06-14days on market $149,000 Active 44 DOM
-
2026-06-13days on market $149,000 Active 43 DOM
-
2026-06-10days on market $149,000 Active 41 DOM
-
2026-06-09days on market $149,000 Active 40 DOM
-
2026-06-08days on market $149,000 Active 39 DOM
-
2026-06-07days on market $149,000 Active 38 DOM
-
2026-06-05days on market $149,000 Active 35 DOM
-
2026-06-03days on market $149,000 Active 34 DOM
-
2026-06-02days on market $149,000 Active 33 DOM
-
2026-06-01days on market $149,000 Active 32 DOM
-
2026-05-31days on market $149,000 Active 31 DOM
-
2026-05-30days on market $149,000 Active 30 DOM
-
2026-04-29$153,000 Active 1234-char remark
ⓘ Source: listings_history table (triggers on properties + properties_extension) + one-shot
backfill from property_details.listing_events for pre-trigger history.
Climate risk First Street
- Flood 1/10 Low FEMA zone X (unshaded) · 0% chance over 30 yrs
- Wildfire 1/10 Low
- Heat 3/10 Moderate 7 d/yr ≥102°F today · 15 d/yr by 30 yrs out
- Wind 2/10 Low
- Air quality 2/10 Low 1 unhealthy d/yr today · 2 by 30 yrs out
Nearby sold comps map
Loading sold comps map…
Walkable amenities ~0.75 mi
Loading nearby amenities…
Taxation est. · year 1
- Rental income
- $21,000
- − Mortgage interest
- −$8,346
- − Property taxes
- −$2,235
- − Insurance
- −$745
- − Repairs & maintenance
- −$1,680
- − Management
- −$1,680
- − Depreciation
- −$4,335
- Taxable income
- $1,979
- Est. tax owed @ 24.0%
- −$475
- After-tax cash flow
- $3,759/yr
For passive investors: Depreciation is non-cash, so a rental often shows a tax loss while cash-flowing — sheltering income. Rental losses are passive: they offset passive income freely, and up to $25,000/yr can offset ordinary (W-2) income if you actively participate and your MAGI is under $100k (phasing out to $0 by $150k); unused losses carry forward. On sale, claimed depreciation is recaptured at up to 25%, and gains may owe capital-gains tax (a 1031 exchange can defer both). Figures are a year-1 estimate at your 24.0% rate — not tax advice; consult a CPA.
Schools (NCES district)
- District
- East Dubuque USD 119
- NCES district ID
- 1713050
- Math proficiency
- 27% ▼ -6.00%
- Reading proficiency
- 41% ▲ 10.00%
- Median HH income
- $56,070
- Composite
- 30.05/100
- National rank
- #6353
- State rank
- #196 of 620 in IL
Livability — East Dubuque
- Score
- 71/100
- State rank
- #349
- US rank
- #7101
Category grades
Schools grade is shown separately in the Schools card above.
Census & demographics
- Census place
- East Dubuque, IL
- Population (ZIP)
- 4,331
Population outlook (Jo Daviess County) Hauer SSP2
- Today (2025)
- 20,420 people
- By 2030
- 19,405 · -5.0%
- By 2040
- 17,244 · -15.6%
- By 2050
- 15,357 · -24.8%
- By 2075
- 11,760 · -42.4%
- By 2100
- 8,355 · -59.1%
Race, ethnicity, and origin ACS 2023
- Neighborhood character
- Predominantly White (91%)
- Race & ethnicity
- White 91% Hispanic / Latino 4% Two or more races 3% Black 1%
- Common ancestry
- Romanian 3% Iranian 1% Portuguese 1%
- Foreign-born
- 1% · Canada
- Languages at home
- 98% English-only · Spanish 2%
Political lean MEDSL · Jo Daviess
- 2024 margin
- R (+16.8) · D 40.8% · R 57.6% · Other 1.6%
- 2008→2024 swing
- -27.3pp toward R · 2008: 10.5pp · 2024: -16.8pp
- All cycles
- 2024: R+16.8 2020: R+16.5 2016: R+14.9 2012: D+1.1 2008: D+10.5
Not yet ingested
- Civics
- —
Market trends
- HPI YoY
- ▼ -97.00%
- Current HPI
- 196.7389
- Rent YoY
- —
- Metro
- —
- State GDP YoY
- ▲ 1.59%
- F500 in state
- 60
Industry mix (Fortune 500 HQ in IL)
| Industry | F500 HQs | Revenue |
|---|---|---|
| Insurance | 4 | $201B |
|
||
| Consumer Goods | 4 | $87B |
|
||
| Industrial Machinery | 3 | $64B |
|
||
| Healthcare | 2 | $55B |
|
||
| Retail / Pharmacy | 1 | $148B |
|
||
| Agriculture / Food | 1 | $86B |
|
||
Price history
-2.6% since first listed2 events — show timeline
- 2026-05-21 Price Changed $149,000 ECIMLS
- 2026-04-29 Listed $153,000 ECIMLS
Property tax history
-0.7%/yrLatest (2025): $295 · -1.4% YoY. Source: county tax records.
Cash-flow waterfall
monthlySold comps — $/sqft
last 12 mo · ≤1 miLoading sold comps…