3033 Clyde Rd · West Palm Beach, FL
Flood risk 1/10 · Minimal
- FEMA flood zone
- X (unshaded)
- Chance of flooding over 30 yrs
- 0.0%
- Est. flood insurance / yr
- $507 – $1,088
Fire risk 1/10 · Minimal
- Est. fire insurance / yr
- $947 – $1,759
Heat risk 10/10 · Severe
- Hot days now (above 105°F)
- 7 days/yr
- Hot days in 30 yrs
- 25 days/yr
Wind risk 10/10 · Severe
- Chance of severe wind over 30 yrs
- 99.0%
Air-quality risk 2/10 · Minimal
- Unhealthy air days now
- 1 days/yr
- Unhealthy air days in 30 yrs
- 1 days/yr
Risk factors via First Street. Map © Google.
Why this score? — see what drove the F grade
The composite is a weighted blend of 9 inputs, each scored 0–100. Each bar is that input's sub-score; the figure is the points it added to the 100-point composite (weight × sub-score).
- ARV discount +8.6/15.0
- Cash flow +5.7/30.0
- Schools +4.3/10.0
- Livability +4.1/5.0
- Rent growth +3.4/5.0
- Condition / age +2.5/5.0
- 1% rule +1.6/10.0
- DSCR +0.1/10.0
- Appreciation +0.0/10.0
$345,000
🖨 Deal sheet (PDF) 📄 Offer letter ✓ Due diligence
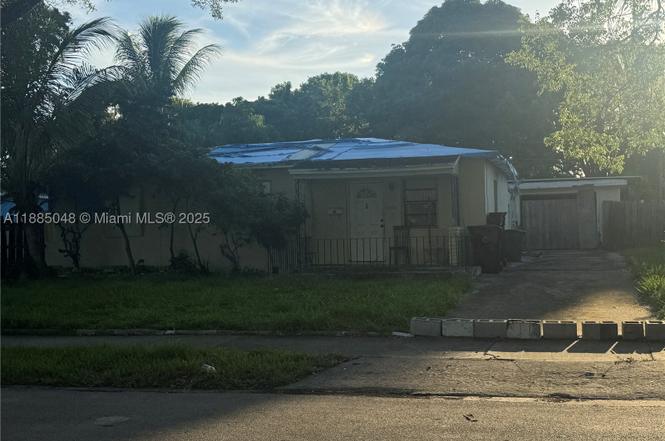
Listing remarks
Investor Opportunity in Prime Location with no HOA! Excellent potential in this solid 3-bedroom, 1-bath CBS home located on a 6,847 sq. ft. lot. The property offers room to expand, add a pool, or maximize rental income. Features storage shed, wide gate access ideal for a boat or work vehicle, and a large driveway with ample parking. Recent Comps range from $403K-$450K. Close to major highways, shops, 5 mins from Palm Beach International Airport, City Place and more!
Key facts
- Large driveway
- Wide gate access
- Ample parking
Tags
Neighborhood map
What this means for you Summary
Snapshot
- This is a 1-bed/1.0-bath single-family listed at $345k.
Deal economics
- At list price, monthly cash flow is $-700 ($-8k/yr) — negative.
- To cash-flow at today's rent, offer at most $221k (35.8% below list).
- To meet the 1% rule (rent ≥ 1% of price), the offer needs to be $226k (34.5% below list).
- Recommended offer: $221k (35.8% below list) — sets the bar for cash-flow.
Location & tenants
- Location reads 82/100 on livability (#75 in FL, #1,255 nationally) — a professional / high-income tenant draw. Strengths: commute A+, housing A+, health & safety A+; Watch: employment C-, crime F.
- Palm Beach (suburban): math 46% / reading 53% proficiency, ranked #34 of 73 in FL (top 47%) — families likely to look elsewhere, expect single-tenant / working-renter base with shorter leases.
- Zoned schools: Belvedere Elementary School (math 33% / reading 37%, grade F, #1,697 of 2,144 statewide, top 80%, 477 students, 79% FRL); Conniston Middle School (math 35% / reading 38%, grade F, #405 of 571 statewide, top 72%, 1,075 students, 74% FRL); Forest Hill Community High School (math 20% / reading 41%, grade F, #434 of 667 statewide, top 66%, 2,407 students, 66% FRL) — zoned schools average 73% FRL vs 52% district-wide (21 pts higher); higher-poverty schools than district average — tighter screening recommended.
- Zoned-school proficiency averages 34% at this address vs 50% district-wide (-16 pts) — the specific schools serving this property underperform the Palm Beach average; the district grade overstates school quality for this exact location.
- Market conditions: Rents rising (+3.4%/yr); 211 active listings in the ZIP; 18 comparable units currently listed for rent nearby; rentals at typical pace (median 26d on market — plan ~3-4 weeks tenant-placement turnaround); solid renter incomes; 3,974 units permitted in Palm Beach County in 2024 (1,012 in 5+ unit buildings).
- This rent runs 31% of the median local income ($87k/yr) — at the standard rent-burdened threshold; future hikes will face affordability resistance.
Forward outlook
- Local home prices are declining (-3.0%/yr); year-one equity from $2k of loan paydown is wiped out by about $10k of value loss. Plan a longer hold.
- Palm Beach County population projected at +30% by 2050 — long-run rental-demand tailwind backs the buy-and-hold thesis.
Negotiation context
- It's been on market 42 days — a 3% lower offer ($335k) is reasonable based on typical stale-listing flexibility.
- Current owner paid $195k; list at $345k implies a 77% gain — meaningful room to come down on a strong offer.
Risks & watch-outs
- Watch-outs: built in 1950 — expect roof / HVAC / electrical / plumbing capex.
- Climate carrying-cost: severe wind risk, 99% chance of damaging wind over 30y; extreme-heat days projected 7→25/yr by 2055 (HVAC capex compounding) — expect insurance premiums to compound above CPI over the hold.
Questions for the listing agent
- What do current leases actually rent for vs. the listed asking? Can we see a recent rent roll and the last 12 months of T-12 income?
- It's been on market 42 days. Have you received any prior offers? Is the seller open to a 36% concession, seller financing, or rate buy-down credit?
- Built in 1950 — when were the roof, HVAC, electrical panel, plumbing, and water heater last replaced?
- Is there a deadline driving the sale (1031 exchange, divorce, estate, relocation)? That informs how much negotiation room exists.
- Crime grade is F in this area — have there been break-ins, vandalism, or insurance claims at this property in the last 3 years? What carrier currently insures it and at what premium?
- The area grade is low — what's the realistic commute time and amenity access for the typical tenant pool here? Any planned neighborhood developments (good or bad) we should know about?
- What's the average days-on-market for RENTAL listings here right now (not sales)? A rising rental-DOM trend means longer vacancies and softer asking-rent achievability than the comps imply.
- What's the recent tenant-quality profile in this submarket — average credit score on applications, eviction rate, late-payment / NSF rate, and stable-employment percentage? A property-management company in the area should have these aggregated.
- How much new for-sale + rental construction is in the pipeline within 1–3 miles? Heavy new supply typically softens prices + rents 12–24 months out; constrained supply supports both.
Investment metrics
- 1% rule
- 0.66% ✗
- Cap rate
- 3.86%
- Cash-on-cash
- -8.70%
- DSCR
- 0.61
- GRM
- 12.7
CMA / ARV
- ARV (on-the-fly)
- $354,024
- Comps found
- 1
Show comp detail 1 sale within ~0.75 mi
| Address | Dist | Beds/Ba | Sqft | Sold | Price | $/sf | Match |
|---|---|---|---|---|---|---|---|
| 627 Avenida Alegre | 0.45mi | 2/1.0 (+1) | 978 (+9%) | 19mo | $387,000 | $396 | 42 |
Match score weights: distance 35% · size 25% · config 20% · recency 20%. Top-matched comps best support the ARV.
Projected returns pro-forma
-3.0% appreciation · 3.44% rent growth · sell at horizon
- IRR
- -31.1%
- Equity multiple
- -0.03×
- Total profit
- $-99,394
- Equity at exit
- $51,441
- IRR
- -32.0%
- Equity multiple
- -0.44×
- Total profit
- $-139,413
- Equity at exit
- $29,829
Cash invested: $96,600 (down + closing). Projections, not guarantees.
Landlord ↔ Tenant lean methodology
- Overall (STATE)
- 87 Strongly Landlord-Friendly
- State Florida
- 87 Strongly Landlord-Friendly · R+3
- County
- — inherits STATE
- City
- — inherits STATE
ZIP-level market 33405
- Rents YoY
- 3.4%
- Active inventory
- 211
- Price-to-rent
- 12.7×
Monthly cashflow live
- Estimated rent
- $2,261 medium interval (Pro) →
- Mortgage (P&I)
- −$1,809
- Tax from tax record
- −$533 /mo · $6,401/yr
- Insurance
- −$144
- HOA
- −$0
- Vacancy / Maint / Mgmt
- −$475
- Net cashflow
- $-700
Break-even live
Sensitivity live
| Price | -10% $-505 | -5% $-602 | +0% $-700 | +5% $-798 | +10% $-895 |
|---|---|---|---|---|---|
| Rent | -10% $-879 | -5% $-789 | +0% $-700 | +5% $-611 | +10% $-521 |
| Rate | -1.0pp $-526 | -0.5pp $-612 | base $-700 | +0.5pp $-790 | +1.0pp $-880 |
UW: 25.0% down · 7.5% · 30yr · 1.5% tax · 5.0% vac · 8.0% maint · 8.0% mgmt
Financing live
Cash to close
- Down payment
- $86,250
- Closing costs
- $10,350
- Reserves months
- —
- Total cash needed
- —
Loan-product check · same deal, 3 products live
Conventional
25% down · 7.5% · 30yr
- Down + closing
- —
- Monthly P&I
- —
- Monthly cashflow
- —
- DSCR
- —
- Eligible?
- —
Personal DTI + credit; lowest rate.
DSCR
20% down · 8.5% · 30yr
- Down + closing
- —
- Monthly P&I
- —
- Monthly cashflow
- —
- DSCR
- —
- Eligible?
- —
No personal income docs; deal must DSCR.
Hard money
10% down · 12.0% · 12mo
- Down + closing
- —
- Monthly P&I
- —
- Monthly cashflow
- —
- DSCR
- —
- Eligible?
- —
Short-term bridge; refi at stabilization.
Rent comps 18 comps
| Address | Beds | Baths | Sqft | Rent | $/sqft | DOM | Units | Dist |
|---|---|---|---|---|---|---|---|---|
| 3331 Lake Ave West Palm Beach, FL | 2.0 | 1.0 | 775 | $3,500 | $4.52 | 26d | 1 | 0.30mi |
| 3111 S Dixie Hwy West Palm Beach, FL | 3.0 | 1.0–2.0 | 1024 | $3,225 | $3.15 | 0d | 15 | 0.54mi |
| 1050 Blanche St West Palm Beach, FL | 2.0 | 1.0–2.0 | 740 | $2,838 | $3.83 | 4d | 8 | 0.85mi |
| 1500 Centrepark Blvd West Palm Beach, FL | 2.0 | 1.0–2.0 | 862 | $2,630 | $3.05 | 1d | 18 | 0.91mi |
| 1713 Florida Ave Unit A2 West Palm Beach, FL | 2.0 | 1.0 | 888 | $3,500 | $3.94 | 26d | 1 | 1.00mi |
| 733 Green St West Palm Beach, FL | 2.0 | 1.0 | 1116 | $3,400 | $3.05 | 4d | 1 | 1.12mi |
| 1801 S Flagler Dr #1104 West Palm Beach, FL | 2.0 | 2.0 | 1086 | $3,750 | $3.45 | 1d | 1 | 1.18mi |
| 1801 S Flagler Dr #11 West Palm Beach, FL | 1.0 | 1.5 | 1075 | $6,500 | $6.05 | 26d | 1 | 1.18mi |
| 1501 S Flagler Dr Unit 5G West Palm Beach, FL | 2.0 | 2.0 | 1115 | $4,500 | $4.04 | 7d | 1 | 1.32mi |
| 550 Okeechobee Blvd Unit Uph-03 West Palm Beach, FL | 2.0 | 2.0 | 1120 | $8,000 | $7.14 | 26d | 1 | 1.47mi |
| 550 Okeechobee Blvd Unit Mph-16 West Palm Beach, FL | 1.0 | 1.0 | 755 | $4,800 | $6.36 | 9d | 1 | 1.47mi |
| 550 Okeechobee Blvd Unit Mph-16 West Palm Beach, FL | 1.0 | 1.0 | 755 | $4,800 | $6.36 | 26d | 1 | 1.47mi |
| 550 Okeechobee Blvd Unit Lph-06 West Palm Beach, FL | 2.0 | 2.0 | 1120 | $8,800 | $7.86 | 26d | 1 | 1.47mi |
| 550 Okeechobee Blvd #612 West Palm Beach, FL | 1.0 | 1.0 | 755 | $5,000 | $6.62 | 26d | 1 | 1.49mi |
| 550 Okeechobee Blvd #1407 West Palm Beach, FL | 2.0 | 2.0 | 1120 | $4,250 | $3.79 | 26d | 1 | 1.49mi |
| 550 Okeechobee Blvd #1605 West Palm Beach, FL | 2.0 | 2.0 | 1120 | $4,000 | $3.57 | 6d | 1 | 1.49mi |
| 550 Okeechobee Blvd #1409 West Palm Beach, FL | 2.0 | 2.0 | 1120 | $10,000 | $8.93 | 26d | 1 | 1.49mi |
| 550 Okeechobee Blvd #504 West Palm Beach, FL | 2.0 | 2.0 | 1120 | $3,700 | $3.30 | 26d | 1 | 1.49mi |
Listing history 4 events
-
2025-11-28status Pending
-
2025-10-17$345,000 Active
-
2006-08-24soldstatus $195,000
-
1985-12-01soldstatus $50,000
ⓘ Source: listings_history table (triggers on properties + properties_extension) + one-shot
backfill from property_details.listing_events for pre-trigger history.
Tax reassessment forecast FL · Resets to sale price
- Current annual tax
- $6,401 · $533/mo
- Projected year-2 tax
- $6,401 · $533/mo
- Expected delta
- $0/yr ($0/mo · 0.0%)
ⓘ Screening estimate from a state-policy table — verify with the county assessor before closing.
Climate risk First Street
- Flood 1/10 Low FEMA zone X (unshaded) · 0% chance over 30 yrs
- Wildfire 1/10 Low
- Heat 10/10 Extreme 7 d/yr ≥105°F today · 25 d/yr by 30 yrs out
- Wind 10/10 Extreme 99% chance of damaging wind over 30 yrs
- Air quality 2/10 Low 1 unhealthy d/yr today · 1 by 30 yrs out
Nearby sold comps map
Loading sold comps map…
Walkable amenities ~0.75 mi
Loading nearby amenities…
Taxation est. · year 1
- Rental income
- $27,133
- − Mortgage interest
- −$19,325
- − Property taxes
- −$6,401
- − Insurance
- −$1,725
- − Repairs & maintenance
- −$2,171
- − Management
- −$2,171
- − Depreciation
- −$10,036
- Taxable loss
- −$14,696
- Est. tax savings @ 24.0%
- +$3,527
- After-tax cash flow
- $-4,874/yr
For passive investors: Depreciation is non-cash, so a rental often shows a tax loss while cash-flowing — sheltering income. Rental losses are passive: they offset passive income freely, and up to $25,000/yr can offset ordinary (W-2) income if you actively participate and your MAGI is under $100k (phasing out to $0 by $150k); unused losses carry forward. On sale, claimed depreciation is recaptured at up to 25%, and gains may owe capital-gains tax (a 1031 exchange can defer both). Figures are a year-1 estimate at your 24.0% rate — not tax advice; consult a CPA.
Schools (NCES district)
- District
- Palm Beach
- NCES district ID
- 1201500
- Math proficiency
- 46% ▼ -16.00%
- Reading proficiency
- 53% ▼ -4.00%
- Median HH income
- $53,943
- Composite
- 42.72/100
- National rank
- #3160
- State rank
- #34 of 73 in FL
Livability — West Palm Beach
- Score
- 82/100
- State rank
- #75
- US rank
- #1255
Category grades
Schools grade is shown separately in the Schools card above.
Census & demographics
- Census place
- West Palm Beach, FL
- County
- Palm Beach County · 1,438,312 people
- City population
- 222,012
- Metro
- Miami-Fort Lauderdale-Pompano Beach, FL
- Population (ZIP)
- 19,780
- Household income
- $87,341
- Rent vs Own
- Severe rent burden
- 1055.0
Population outlook (Palm Beach County) Hauer SSP2
- Today (2025)
- 1,637,487 people
- By 2030
- 1,743,255 · +6.5%
- By 2040
- 1,948,712 · +19.0%
- By 2050
- 2,132,979 · +30.3%
- By 2075
- 2,530,027 · +54.5%
- By 2100
- 2,706,979 · +65.3%
Race, ethnicity, and origin ACS 2023
- Neighborhood character
- Majority Hispanic (51%)
- Race & ethnicity
- Hispanic / Latino 51% White 44% Two or more races 24% Black 3% Asian 1%
- Hispanic origin (detail)
- Mexican 7% Puerto Rican 5% Cuban 17% Dominican 2%
- Common ancestry
- Scotch-Irish 2% Slovak 2% Romanian 2%
- Foreign-born
- 37% · Canada, Guatemala, Jamaica
- Languages at home
- 50% English-only · Spanish 44% Other Indo-European 2% French/Haitian/Cajun 1%
Political lean MEDSL · Palm Beach
- 2024 margin
- Toss-up / Even · D 50.0% · R 49.2%
- 2008→2024 swing
- -22.1pp toward R · 2008: 22.9pp · 2024: 0.8pp
- All cycles
- 2024: D+0.8 2020: D+12.8 2016: D+15.3 2012: D+17.0 2008: D+22.9
Not yet ingested
- Civics
- —
Market trends
- HPI YoY
- ▼ -662.68%
- Current HPI
- 509.781
- Rent YoY
- ▲ 3.44%
- Metro
- Miami-Fort Lauderdale-Pompano Beach, FL
- State GDP YoY
- ▲ 3.28%
- F500 in state
- 36
Industry mix (Fortune 500 HQ in FL)
| Industry | F500 HQs | Revenue |
|---|---|---|
| Industrial Technology | 2 | $29B |
|
||
| Insurance | 2 | $17B |
|
||
| Retail | 1 | $60B |
|
||
| Technology Distribution | 1 | $58B |
|
||
| Homebuilding | 1 | $35B |
|
||
| Technology Manufacturing | 1 | $35B |
|
||
Price history
+590.0% since first listed4 events — show timeline
- 2025-11-28 Pending — MARMLS
- 2025-10-17 Listed $345,000 MARMLS
- 2006-08-24 Sold (Public Records) $195,000 Public Records
- 1985-12-01 Sold (Public Records) $50,000 Public Records
Property tax history
+14.6%/yrLatest (2025): $6,401 · +694.8% YoY. Source: county tax records.
Cash-flow waterfall
monthlySold comps — $/sqft
last 12 mo · ≤1 miLoading sold comps…