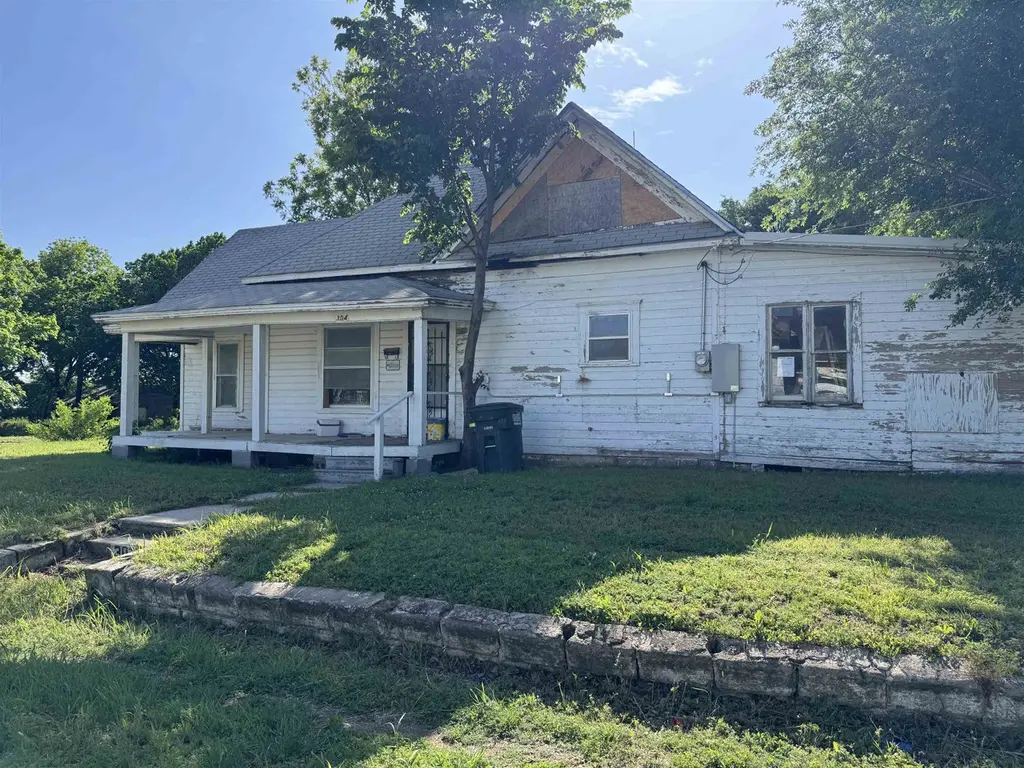
304 N 5th St · Enid, OK
Flood risk 1/10 · Minimal
- FEMA flood zone
- X (shaded)
- Chance of flooding over 30 yrs
- 0.0%
- Est. flood insurance / yr
- $507 – $1,088
Fire risk 3/10 · Minor
- Est. fire insurance / yr
- $2,463 – $4,575
Heat risk 6/10 · Moderate
- Hot days now (above 108°F)
- 7 days/yr
- Hot days in 30 yrs
- 19 days/yr
Wind risk 2/10 · Minimal
- Chance of severe wind over 30 yrs
- 1.0%
Air-quality risk 2/10 · Minimal
- Unhealthy air days now
- 0 days/yr
- Unhealthy air days in 30 yrs
- 1 days/yr
Risk factors via First Street. Map © Google.
Why this score? — see what drove the C+ grade
The composite is a weighted blend of 9 inputs, each scored 0–100. Each bar is that input's sub-score; the figure is the points it added to the 100-point composite (weight × sub-score).
- Cash flow +30.0/30.0
- DSCR +10.0/10.0
- 1% rule +8.7/10.0
- Rent growth +3.3/5.0
- Livability +3.2/5.0
- Condition / age +2.5/5.0
- Schools +1.8/10.0
- ARV discount +0.8/15.0
- Appreciation +0.0/10.0
$68,900
🖨 Deal sheet (PDF) 📄 Offer letter ✓ Due diligence
Listing remarks
Step into the charm and potential of this delightful 2-bedroom, 1-bathroom home at 304?N?5th?St, Enid, OK?73701. Spanning 1,276 square feet, this residence is a canvas for your vision—featuring a brand-new electrical panel and wiring, all-new plumbing, and a fresh remodel that’s nearly complete. The only finishing touches needed are in the attached utility room, offering a perfect opportunity to personalize the space to your taste. Priced attractively at $68,900, this home stands out in a neighborhood. a smart investment in today’s balanced market. Imagine cozy evenings in a home that blends modern updates with classic appeal, all while being just minutes from local amenit
Key facts
- All new plumbing
- Fresh remodel
- Built 1920
Tags
Property features AI
Exterior
- Utilities: Public water; Public sewer
- Home design: Single-family residence; Single-story
- Construction: Residential construction
- Exterior features: Corner lot; Chain-link fence; Composition roof; Faces south
Interior
- Flooring: Vinyl
- Bathrooms: 1 full bathroom
- Interior features: Vinyl flooring
Neighborhood map
What this means for you Summary
Snapshot
- This is a 2-bed/1.0-bath single-family listed at $69k.
Deal economics
- At list price, monthly cash flow is $304 ($4k/yr) — positive.
- The deal already cash-flows at list — no discount required.
- Meets the 1% rule at list price ($945 rent vs $69k).
- Recommended offer: $67k (3.0% below list) — sets the bar for market timing.
- Cap rate 11.6% vs local median 5.0% in Enid — top-decile yield for the area; either an underpriced asset or a hidden risk that comps aren't pricing in. Stress-test before assuming the spread holds.
Location & tenants
- Location reads 63/100 on livability (#212 in OK) — a middle-class / working-renter tenant base. Strengths: cost of living A+, housing A+; Watch: employment C-, schools D-, crime F.
- Enid (town): math 19% / reading 22% proficiency, ranked #168 of 270 in OK (top 62%) — low school quality limits family demand, transient renter base, plan for 1-2y turnover; 64% free/reduced lunch — lower-income household profile, screen leases tightly.
- Market conditions: Rents rising (+3.2%/yr); 79 active listings in the ZIP; 19 units permitted in Garfield County in 2024 (0 in 5+ unit buildings).
Forward outlook
- Local home prices are declining (-3.0%/yr); year-one equity from $476 of loan paydown is wiped out by about $2k of value loss. Plan a longer hold.
- Garfield County population projected at +27% by 2050 — long-run rental-demand tailwind backs the buy-and-hold thesis.
- At projected returns (-3.0% appreciation + 3.2% rent growth), your $19k cash investment doubles in ~7 years — after that, you're playing with house money.
Negotiation context
- It's been on market 49 days — a 3% lower offer ($67k) is reasonable based on typical stale-listing flexibility.
Risks & watch-outs
- Watch-outs: built in 1920 — expect roof / HVAC / electrical / plumbing capex.
- Climate carrying-cost: extreme-heat days projected 7→19/yr by 2055 (HVAC capex compounding) — expect insurance premiums to compound above CPI over the hold.
Questions for the listing agent
- It's been on market 49 days. Have you received any prior offers? Is the seller open to a 3% concession, seller financing, or rate buy-down credit?
- Built in 1920 — when were the roof, HVAC, electrical panel, plumbing, and water heater last replaced?
- Is there a deadline driving the sale (1031 exchange, divorce, estate, relocation)? That informs how much negotiation room exists.
- Schools are D-rated, which usually means shorter tenancies and higher turnover. Who's the typical renter profile here, and what's been the actual vacancy rate?
- Crime grade is F in this area — have there been break-ins, vandalism, or insurance claims at this property in the last 3 years? What carrier currently insures it and at what premium?
- What's the average days-on-market for RENTAL listings here right now (not sales)? A rising rental-DOM trend means longer vacancies and softer asking-rent achievability than the comps imply.
- What's the recent tenant-quality profile in this submarket — average credit score on applications, eviction rate, late-payment / NSF rate, and stable-employment percentage? A property-management company in the area should have these aggregated.
- How much new for-sale + rental construction is in the pipeline within 1–3 miles? Heavy new supply typically softens prices + rents 12–24 months out; constrained supply supports both.
Investment metrics
- 1% rule
- 1.37% ✓
- Cap rate
- 11.59%
- Cash-on-cash
- 18.92%
- DSCR
- 1.84
- GRM
- 6.1
CMA / ARV
- ARV (on-the-fly)
- $59,972
- Comps found
- 12
Show comp detail 12 sales within ~0.75 mi
| Address | Dist | Beds/Ba | Sqft | Sold | Price | $/sf | Match |
|---|---|---|---|---|---|---|---|
| 109 N 5th St | 0.13mi | 2/1.0 | 1,229 (-4%) | 14mo | $44,900 | $37 | 76 |
| 440 E Walnut Ave | 0.33mi | 3/1.0 (+1) | 1,292 (+1%) | 13mo | $41,000 | $32 | 66 |
| 442 N Davis St | 0.57mi | 2/1.0 | 1,215 (-5%) | 4mo | $37,000 | $30 | 62 |
| 1018 E Pine Ave | 0.52mi | 2/1.0 | 1,182 (-7%) | 4mo | $55,000 | $47 | 60 |
| 735 N 10 St | 0.59mi | 3/2.0 (+1) | 1,244 (-2%) | 5mo | $85,000 | $68 | 55 |
| 1016 E Pine Ave | 0.51mi | 2/1.0 | 1,348 (+6%) | 15mo | $60,000 | $45 | 54 |
| 566 N Malone St | 0.32mi | 3/1.0 (+1) | 1,164 (-9%) | 15mo | $35,000 | $30 | 53 |
| 322 N 11th St | 0.50mi | 2/1.0 | 1,090 (-15%) | 0mo | $29,000 | $27 | 52 |
| 621 N 12th St | 0.70mi | 3/1.5 (+1) | 1,230 (-4%) | 4mo | $74,200 | $60 | 51 |
| 1309 E Randolph Ave | 0.74mi | 3/1.0 (+1) | 1,212 (-5%) | 16mo | $87,500 | $72 | 39 |
| 1215 E Elm Ave | 0.66mi | 3/1.0 (+1) | 1,140 (-11%) | 12mo | $65,000 | $57 | 36 |
| 354 E Cedar Ave | 0.67mi | 3/1.0 (+1) | 1,102 (-14%) | 7mo | $108,000 | $98 | 35 |
Match score weights: distance 35% · size 25% · config 20% · recency 20%. Top-matched comps best support the ARV.
Projected returns pro-forma
-3.0% appreciation · 3.16% rent growth · sell at horizon
- IRR
- 10.9%
- Equity multiple
- 1.43×
- Total profit
- $8,357
- Equity at exit
- $10,273
- IRR
- 20.1%
- Equity multiple
- 2.70×
- Total profit
- $32,828
- Equity at exit
- $5,957
Cash invested: $19,292 (down + closing). Projections, not guarantees.
Landlord ↔ Tenant lean methodology
- Overall (STATE)
- 83 Strongly Landlord-Friendly
- State Oklahoma
- 83 Strongly Landlord-Friendly · R+20
- County
- — inherits STATE
- City
- — inherits STATE
ZIP-level market 73701
- Home prices YoY
- -30.2%
- Rents YoY
- 3.2%
- Active inventory
- 79
- Price-to-rent
- 6.1×
Monthly cashflow live
- Estimated rent
- $945 medium interval (Pro) →
- Mortgage (P&I)
- −$361
- Tax from tax record
- −$52 /mo · $624/yr
- Insurance
- −$29
- HOA
- −$0
- Vacancy / Maint / Mgmt
- −$198
- Net cashflow
- $304
Break-even live
Sensitivity live
| Price | -10% $343 | -5% $324 | +0% $304 | +5% $285 | +10% $265 |
|---|---|---|---|---|---|
| Rent | -10% $230 | -5% $267 | +0% $304 | +5% $342 | +10% $379 |
| Rate | -1.0pp $339 | -0.5pp $322 | base $304 | +0.5pp $286 | +1.0pp $268 |
UW: 25.0% down · 7.5% · 30yr · 1.5% tax · 5.0% vac · 8.0% maint · 8.0% mgmt
Financing live
Cash to close
- Down payment
- $17,225
- Closing costs
- $2,067
- Reserves months
- —
- Total cash needed
- —
Loan-product check · same deal, 3 products live
Conventional
25% down · 7.5% · 30yr
- Down + closing
- —
- Monthly P&I
- —
- Monthly cashflow
- —
- DSCR
- —
- Eligible?
- —
Personal DTI + credit; lowest rate.
DSCR
20% down · 8.5% · 30yr
- Down + closing
- —
- Monthly P&I
- —
- Monthly cashflow
- —
- DSCR
- —
- Eligible?
- —
No personal income docs; deal must DSCR.
Hard money
10% down · 12.0% · 12mo
- Down + closing
- —
- Monthly P&I
- —
- Monthly cashflow
- —
- DSCR
- —
- Eligible?
- —
Short-term bridge; refi at stabilization.
Listing history 15 events
-
2026-06-19days on market $68,900 Active 49 DOM
-
2026-06-18days on market $68,900 Active 48 DOM
-
2026-06-17days on market $68,900 Active 47 DOM
-
2026-06-16days on market $68,900 Active 46 DOM
-
2026-06-15days on market $68,900 Active 45 DOM
-
2026-06-14days on market $68,900 Active 43 DOM
-
2026-06-12days on market $68,900 Active 42 DOM
-
2026-06-09days on market $68,900 Active 39 DOM
-
2026-06-08days on market $68,900 Active 38 DOM
-
2026-06-07days on market $68,900 Active 37 DOM
-
2026-06-02days on market $68,900 Active 32 DOM
-
2026-06-01days on market $68,900 Active 31 DOM
-
2026-05-31days on market $68,900 Active 30 DOM
-
2026-05-30days on market $68,900 Active 29 DOM
-
2026-04-30$68,900 Active
ⓘ Source: listings_history table (triggers on properties + properties_extension) + one-shot
backfill from property_details.listing_events for pre-trigger history.
Tax reassessment forecast OK · Resets to sale price
- Current annual tax
- $624 · $52/mo
- Projected year-2 tax
- $624 · $52/mo
- Expected delta
- $0/yr ($0/mo · 0.0%)
ⓘ Screening estimate from a state-policy table — verify with the county assessor before closing.
Climate risk First Street
- Flood 1/10 Low FEMA zone X (shaded) · 0% chance over 30 yrs
- Wildfire 3/10 Moderate
- Heat 6/10 Major 7 d/yr ≥108°F today · 19 d/yr by 30 yrs out
- Wind 2/10 Low 100% chance of damaging wind over 30 yrs
- Air quality 2/10 Low 0 unhealthy d/yr today · 1 by 30 yrs out
Nearby sold comps map
Loading sold comps map…
Walkable amenities ~0.75 mi
Loading nearby amenities…
Taxation est. · year 1
- Rental income
- $11,336
- − Mortgage interest
- −$3,859
- − Property taxes
- −$624
- − Insurance
- −$344
- − Repairs & maintenance
- −$907
- − Management
- −$907
- − Depreciation
- −$2,004
- Taxable income
- $2,690
- Est. tax owed @ 24.0%
- −$645
- After-tax cash flow
- $3,005/yr
For passive investors: Depreciation is non-cash, so a rental often shows a tax loss while cash-flowing — sheltering income. Rental losses are passive: they offset passive income freely, and up to $25,000/yr can offset ordinary (W-2) income if you actively participate and your MAGI is under $100k (phasing out to $0 by $150k); unused losses carry forward. On sale, claimed depreciation is recaptured at up to 25%, and gains may owe capital-gains tax (a 1031 exchange can defer both). Figures are a year-1 estimate at your 24.0% rate — not tax advice; consult a CPA.
Schools (NCES district)
- District
- Enid
- NCES district ID
- 4010920
- Math proficiency
- 19% ▼ -11.00%
- Reading proficiency
- 22% ▼ -9.00%
- Median HH income
- $42,389
- Composite
- 17.59/100
- National rank
- #9040
- State rank
- #168 of 270 in OK
Livability — Enid
- Score
- 63/100
- State rank
- #212
- US rank
- #15472
Category grades
Schools grade is shown separately in the Schools card above.
Census & demographics
- Census place
- Enid, OK
- County
- Garfield County · 55,032 people
- City population
- 55,032
- Metro
- Enid, OK
- Population (ZIP)
- 24,476
- Household income
- $50,843
- Rent vs Own
- Severe rent burden
- 576.0
Population outlook (Garfield County) Hauer SSP2
- Today (2025)
- 69,026 people
- By 2030
- 72,171 · +4.6%
- By 2040
- 79,366 · +15.0%
- By 2050
- 87,847 · +27.3%
- By 2075
- 112,714 · +63.3%
- By 2100
- 135,682 · +96.6%
Race, ethnicity, and origin ACS 2023
- Neighborhood character
- Diverse neighborhood (Simpson 0.61)
- Race & ethnicity
- White 58% Hispanic / Latino 22% Two or more races 11% Pacific Islander 10% Native American 4% Black 2%
- Hispanic origin (detail)
- Mexican 21%
- Common ancestry
- Iranian 4% Lithuanian 2% Slovak 1%
- Foreign-born
- 10% · Canada
- Languages at home
- 79% English-only · Spanish 14% Other Asian/Pacific 6%
Political lean MEDSL · Garfield
- 2024 margin
- Solid R (+53.8) · D 22.2% · R 76.0% · Other 1.8%
- 2008→2024 swing
- -2.8pp toward R · 2008: -51.0pp · 2024: -53.8pp
- All cycles
- 2024: R+53.8 2020: R+53.7 2016: R+53.5 2012: R+52.5 2008: R+51.0
Not yet ingested
- Civics
- —
Market trends
- HPI YoY
- ▼ -73.42%
- Current HPI
- 169.408
- Rent YoY
- ▲ 3.16%
- Metro
- Enid, OK
- State GDP YoY
- ▲ 1.55%
- F500 in state
- 6
Industry mix (Fortune 500 HQ in OK)
| Industry | F500 HQs | Revenue |
|---|---|---|
| Energy | 3 | $48B |
|
||
Price history
1 event — show timeline
- 2026-04-30 Listed $68,900 NWOAR
Property tax history
+21.4%/yrLatest (2025): $624 · +167.8% YoY. Source: county tax records.
Cash-flow waterfall
monthlySold comps — $/sqft
last 12 mo · ≤1 miLoading sold comps…