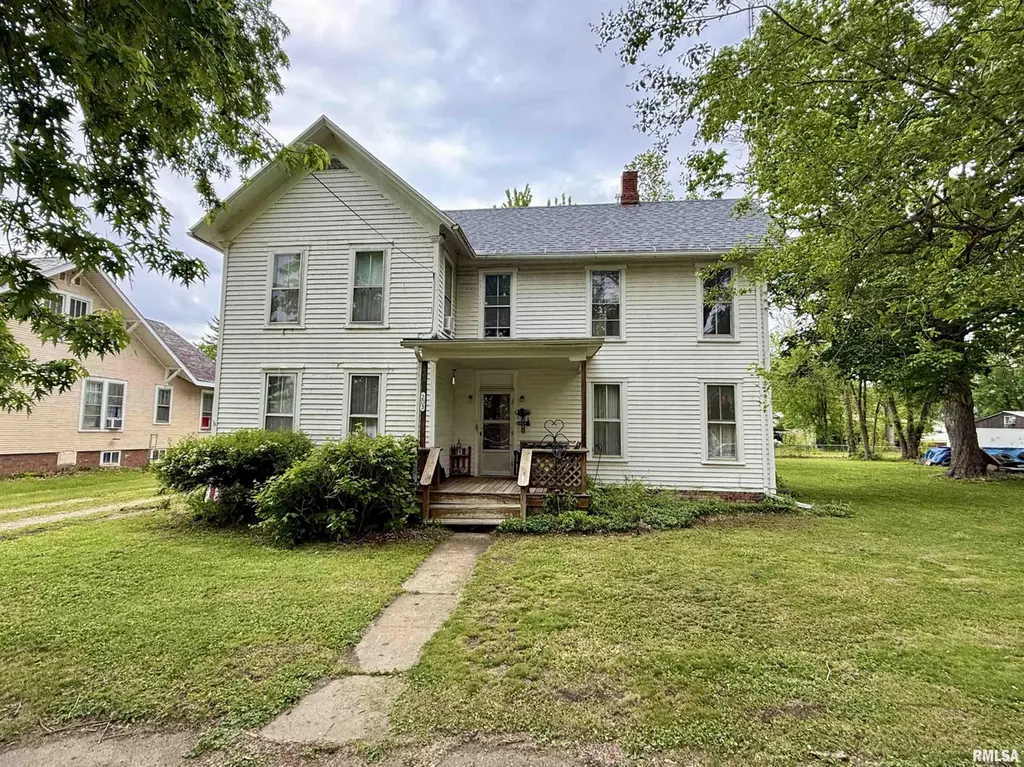
203 E Water St · London Mills, IL
Flood risk 1/10 · Minimal
- FEMA flood zone
- X (unshaded)
- Chance of flooding over 30 yrs
- 0.0%
- Est. flood insurance / yr
- $473 – $860
Fire risk 1/10 · Minimal
- Est. fire insurance / yr
- $804 – $1,492
Heat risk 3/10 · Minor
- Hot days now (above 105°F)
- 7 days/yr
- Hot days in 30 yrs
- 18 days/yr
Wind risk 2/10 · Minimal
- Chance of severe wind over 30 yrs
- 0.0%
Air-quality risk 2/10 · Minimal
- Unhealthy air days now
- 1 days/yr
- Unhealthy air days in 30 yrs
- 1 days/yr
Risk factors via First Street. Map © Google.
Why this score? — see what drove the A grade
The composite is a weighted blend of 9 inputs, each scored 0–100. Each bar is that input's sub-score; the figure is the points it added to the 100-point composite (weight × sub-score).
- Cash flow +30.0/30.0
- ARV discount +15.0/15.0
- 1% rule +10.0/10.0
- DSCR +10.0/10.0
- Appreciation +8.9/10.0
- Schools +3.7/10.0
- Livability +2.9/5.0
- Rent growth +2.5/5.0
- Condition / age +2.5/5.0
$64,900
🖨 Deal sheet (PDF) 📄 Offer letter ✓ Due diligence
Listing remarks
So much space and potential in this centrally located London Mills home! This home features 2+ bedrooms and two full baths. The main floor features a large formal dining room and oversized living room with tall ceilings. There's an adjacent piano room/den, main floor full bath and a huge family room with woodburning stove. Conveniently situated next to the dining room is the galley style eat-in kitchen with appliances that remain. Convenient main floor laundry. The enclosed back porch has the access to the basement and crawl space. Upstairs you will find a great storage room or potential home office, a mostly renovated bathroom, second bedroom and a huge primary bedroom with attached nurser
Key facts
- Enclosed back porch
- Formal dining room
- Piano room
Tags
Property features AI
Exterior
- Parking: Detached carport/garage with gravel parking; 1 garage space
- Utilities: Public water; Public sewer
- Home design: Single-family residence; Two levels
- Construction: Built in 1885; Rubber and shingle roof; Crawl space and full unfinished basement
- Exterior features: Level lot; Lot dimensions approximately 154 x 64
Interior
- Kitchen: Kitchen on main level; Refrigerator included
- Bedrooms: 2 bedrooms (upper level bedrooms; egress windows in bedrooms); Primary bedroom includes a den off primary (additional connected room)
- Flooring: Vinyl flooring in kitchen, laundry and some rooms; Laminate flooring in some upper-level rooms; Carpet in living room, family room, dining room and other areas
- Bathrooms: 2 full bathrooms
- Heating & cooling: Propane heating with forced air; Propane rented; Electric water heater; Window unit(s) for cooling
- Interior features: Ceiling fan(s); One fireplace
- Laundry & utility: Main-level laundry room; Washer and dryer included
Neighborhood map
What this means for you Summary
Snapshot
- This is a 2-bed/2.0-bath single-family listed at $65k.
Deal economics
- At list price, monthly cash flow is $395 ($5k/yr) — positive.
- The deal already cash-flows at list — no discount required.
- Meets the 1% rule at list price ($1k rent vs $65k).
- Recommended offer: $63k (3.0% below list) — sets the bar for market timing.
Location & tenants
- Location reads 58/100 on livability (#1,101 in IL) — a working-class tenant base; expect higher turnover. Strengths: cost of living A+, housing A; Watch: crime D, amenities F, commute F.
- Spoon River Valley CUSD 4 (rural): math 35% / reading 45% proficiency, ranked #314 of 919 in IL (top 34%) — families likely to look elsewhere, expect single-tenant / working-renter base with shorter leases.
- Zoned schools: Spoon River Valley Sr High Sch (math 30% / reading 30%, grade F, #179 of 693 statewide, top 27%, 73 students, 0% FRL) — zoned schools average 0% FRL vs 35% district-wide (35 pts lower); this property's tenant base skews higher-income than the district average.
- Market conditions: 1 active listings in the ZIP; 14 units permitted in Fulton County in 2024 (0 in 5+ unit buildings).
Forward outlook
- In year one you build about $6k of equity ($449 loan paydown + $5k appreciation (7.9% local appreciation)).
- Fulton County population projected at -20% by 2050 — secular population decline; favor cash flow + early exit over multi-decade hold.
- At projected returns (7.9% appreciation + 3.0% rent growth), your $18k cash investment doubles in ~2 years — after that, you're playing with house money.
- By year 6, paydown + projected appreciation supports a ~$31k cash-out refi (75% LTV) — recoverable capital for the next deal without selling this one.
Negotiation context
- It's been on market 51 days — a 3% lower offer ($63k) is reasonable based on typical stale-listing flexibility.
Risks & watch-outs
- Watch-outs: built in 1885 — expect roof / HVAC / electrical / plumbing capex.
Questions for the listing agent
- It's been on market 51 days. Have you received any prior offers? Is the seller open to a 3% concession, seller financing, or rate buy-down credit?
- Built in 1885 — when were the roof, HVAC, electrical panel, plumbing, and water heater last replaced?
- Is there a deadline driving the sale (1031 exchange, divorce, estate, relocation)? That informs how much negotiation room exists.
- Schools are F-rated, which usually means shorter tenancies and higher turnover. Who's the typical renter profile here, and what's been the actual vacancy rate?
- Crime grade is D in this area — have there been break-ins, vandalism, or insurance claims at this property in the last 3 years? What carrier currently insures it and at what premium?
- What's the average days-on-market for RENTAL listings here right now (not sales)? A rising rental-DOM trend means longer vacancies and softer asking-rent achievability than the comps imply.
- What's the recent tenant-quality profile in this submarket — average credit score on applications, eviction rate, late-payment / NSF rate, and stable-employment percentage? A property-management company in the area should have these aggregated.
- How much new for-sale + rental construction is in the pipeline within 1–3 miles? Heavy new supply typically softens prices + rents 12–24 months out; constrained supply supports both.
Investment metrics
- 1% rule
- 1.60% ✓
- Cap rate
- 13.60%
- Cash-on-cash
- 26.10%
- DSCR
- 2.16
- GRM
- 5.2
CMA / ARV
- ARV (median comp)
- $108,956
- List price
- $64,900
- Delta
- -40.43%
- Verdict
- UNDERPRICED
- Comps
- 1 within 2.0 mi
Show comp detail 1 sale within ~0.75 mi
| Address | Dist | Beds/Ba | Sqft | Sold | Price | $/sf | Match |
|---|---|---|---|---|---|---|---|
| 306 W South St | 0.38mi | 3/2.0 (+1) | 1,324 (+5%) | 19mo | $89,900 | $68 | 52 |
Match score weights: distance 35% · size 25% · config 20% · recency 20%. Top-matched comps best support the ARV.
Projected returns pro-forma
7.87% appreciation · 3.0% rent growth · sell at horizon
- IRR
- 40.5%
- Equity multiple
- 3.83×
- Total profit
- $51,369
- Equity at exit
- $48,735
- IRR
- 36.3%
- Equity multiple
- 8.17×
- Total profit
- $130,326
- Equity at exit
- $96,200
Cash invested: $18,172 (down + closing). Projections, not guarantees.
Landlord ↔ Tenant lean methodology
- Overall (STATE)
- 43 Moderately Tenant-Leaning
- State Illinois
- 43 Moderately Tenant-Leaning · D+7
- County
- — inherits STATE
- City
- — inherits STATE
ZIP-level market 61544
- Home prices YoY
- 5.0%
- Active inventory
- 1
- Price-to-rent
- 5.2×
Monthly cashflow live
- Estimated rent
- $1,037 medium interval (Pro) →
- Mortgage (P&I)
- −$340
- Tax from tax record
- −$56 /mo · $675/yr
- Insurance
- −$27
- HOA
- −$0
- Vacancy / Maint / Mgmt
- −$218
- Net cashflow
- $395
Break-even live
Sensitivity live
| Price | -10% $432 | -5% $414 | +0% $395 | +5% $377 | +10% $358 |
|---|---|---|---|---|---|
| Rent | -10% $313 | -5% $354 | +0% $395 | +5% $436 | +10% $477 |
| Rate | -1.0pp $428 | -0.5pp $412 | base $395 | +0.5pp $378 | +1.0pp $361 |
UW: 25.0% down · 7.5% · 30yr · 1.5% tax · 5.0% vac · 8.0% maint · 8.0% mgmt
Financing live
Cash to close
- Down payment
- $16,225
- Closing costs
- $1,947
- Reserves months
- —
- Total cash needed
- —
Loan-product check · same deal, 3 products live
Conventional
25% down · 7.5% · 30yr
- Down + closing
- —
- Monthly P&I
- —
- Monthly cashflow
- —
- DSCR
- —
- Eligible?
- —
Personal DTI + credit; lowest rate.
DSCR
20% down · 8.5% · 30yr
- Down + closing
- —
- Monthly P&I
- —
- Monthly cashflow
- —
- DSCR
- —
- Eligible?
- —
No personal income docs; deal must DSCR.
Hard money
10% down · 12.0% · 12mo
- Down + closing
- —
- Monthly P&I
- —
- Monthly cashflow
- —
- DSCR
- —
- Eligible?
- —
Short-term bridge; refi at stabilization.
Listing history 17 events
-
2026-06-21days on market $64,900 Active 51 DOM
-
2026-06-18days on market $64,900 Active 49 DOM
-
2026-06-17days on market $64,900 Active 48 DOM
-
2026-06-16days on market $64,900 Active 47 DOM
-
2026-06-15days on market $64,900 Active 46 DOM
-
2026-06-13days on market $64,900 Active 44 DOM
-
2026-06-12days on market $64,900 Active 43 DOM
-
2026-06-09days on market $64,900 Active 40 DOM
-
2026-06-08days on market $64,900 Active 39 DOM
-
2026-06-07days on market $64,900 Active 38 DOM
-
2026-06-05days on market $64,900 Active 36 DOM
-
2026-06-04pricedays on market $64,900 Active 34 DOM
-
2026-06-02days on market $75,000 Active 33 DOM
-
2026-06-01days on market $75,000 Active 32 DOM
-
2026-05-31days on market $75,000 Active 31 DOM
-
2026-05-31days on market $75,000 Active 30 DOM
-
2026-04-30$75,000 Active 1014-char remark
ⓘ Source: listings_history table (triggers on properties + properties_extension) + one-shot
backfill from property_details.listing_events for pre-trigger history.
Tax reassessment forecast IL · Partial reset (capped growth)
- Current annual tax
- $675 · $56/mo
- Projected year-2 tax
- $1,074 · $90/mo
- Expected delta
- +$399/yr (+$33/mo · 59.1%)
ⓘ Screening estimate from a state-policy table — verify with the county assessor before closing.
Climate risk First Street
- Flood 1/10 Low FEMA zone X (unshaded) · 0% chance over 30 yrs
- Wildfire 1/10 Low
- Heat 3/10 Moderate 7 d/yr ≥105°F today · 18 d/yr by 30 yrs out
- Wind 2/10 Low 0% chance of damaging wind over 30 yrs
- Air quality 2/10 Low 1 unhealthy d/yr today · 1 by 30 yrs out
Nearby sold comps map
Loading sold comps map…
Walkable amenities ~0.75 mi
Loading nearby amenities…
Taxation est. · year 1
- Rental income
- $12,438
- − Mortgage interest
- −$3,635
- − Property taxes
- −$675
- − Insurance
- −$324
- − Repairs & maintenance
- −$995
- − Management
- −$995
- − Depreciation
- −$1,888
- Taxable income
- $3,925
- Est. tax owed @ 24.0%
- −$942
- After-tax cash flow
- $3,800/yr
For passive investors: Depreciation is non-cash, so a rental often shows a tax loss while cash-flowing — sheltering income. Rental losses are passive: they offset passive income freely, and up to $25,000/yr can offset ordinary (W-2) income if you actively participate and your MAGI is under $100k (phasing out to $0 by $150k); unused losses carry forward. On sale, claimed depreciation is recaptured at up to 25%, and gains may owe capital-gains tax (a 1031 exchange can defer both). Figures are a year-1 estimate at your 24.0% rate — not tax advice; consult a CPA.
Schools (NCES district)
- District
- Spoon River Valley CUSD 4
- NCES district ID
- 1736960
- Math proficiency
- 35% ▬ 0.00%
- Reading proficiency
- 45% ▲ 5.00%
- Median HH income
- $51,341
- Composite
- 37.03/100
- National rank
- #9073
- State rank
- #314 of 919 in IL
Livability — London Mills
- Score
- 58/100
- State rank
- #1101
- US rank
- #20873
Category grades
Schools grade is shown separately in the Schools card above.
Census & demographics
- Census place
- London Mills, IL
- Population (ZIP)
- 815
Population outlook (Fulton County) Hauer SSP2
- Today (2025)
- 33,356 people
- By 2030
- 32,144 · -3.6%
- By 2040
- 29,518 · -11.5%
- By 2050
- 26,775 · -19.7%
- By 2075
- 19,972 · -40.1%
- By 2100
- 13,580 · -59.3%
Race, ethnicity, and origin ACS 2023
- Neighborhood character
- Predominantly White (98%)
- Race & ethnicity
- White 98% Two or more races 2%
- Common ancestry
- Slovak 5% Lithuanian 4% Serbian 2%
Political lean MEDSL · Fulton
- 2024 margin
- Strong R (+23.8) · D 37.1% · R 60.9% · Other 2.0%
- 2008→2024 swing
- -45.2pp toward R · 2008: 21.3pp · 2024: -23.8pp
- All cycles
- 2024: R+23.8 2020: R+20.1 2016: R+15.1 2012: D+11.1 2008: D+21.3
Not yet ingested
- Civics
- —
Market trends
- HPI YoY
- ▲ 7.87%
- Current HPI
- 166.8572
- Rent YoY
- —
- Metro
- —
- State GDP YoY
- ▲ 1.59%
- F500 in state
- 60
Industry mix (Fortune 500 HQ in IL)
| Industry | F500 HQs | Revenue |
|---|---|---|
| Insurance | 4 | $201B |
|
||
| Consumer Goods | 4 | $87B |
|
||
| Industrial Machinery | 3 | $64B |
|
||
| Healthcare | 2 | $55B |
|
||
| Retail / Pharmacy | 1 | $148B |
|
||
| Agriculture / Food | 1 | $86B |
|
||
Price history
-13.5% since first listed2 events — show timeline
- 2026-06-03 Price Changed $64,900 RMLSA as Distributed by MLS Grid
- 2026-04-30 Listed $75,000 RMLSA as Distributed by MLS Grid
Property tax history
+12.5%/yrLatest (2024): $675 · +13.4% YoY. Source: county tax records.
Cash-flow waterfall
monthlySold comps — $/sqft
last 12 mo · ≤1 miLoading sold comps…