6337 Lynam Dr · Point Baker, FL
Flood risk 1/10 · Minimal
- FEMA flood zone
- X (unshaded)
- Chance of flooding over 30 yrs
- 0.0%
- Est. flood insurance / yr
- $507 – $1,088
Fire risk 6/10 · Moderate
- Est. fire insurance / yr
- $947 – $1,759
Heat risk 9/10 · Severe
- Hot days now (above 106°F)
- 7 days/yr
- Hot days in 30 yrs
- 20 days/yr
Wind risk 9/10 · Severe
- Chance of severe wind over 30 yrs
- 99.0%
Air-quality risk 2/10 · Minimal
- Unhealthy air days now
- 1 days/yr
- Unhealthy air days in 30 yrs
- 1 days/yr
Risk factors via First Street. Map © Google.
Why this score? — see what drove the B grade
The composite is a weighted blend of 9 inputs, each scored 0–100. Each bar is that input's sub-score; the figure is the points it added to the 100-point composite (weight × sub-score).
- Cash flow +30.0/30.0
- 1% rule +10.0/10.0
- DSCR +10.0/10.0
- ARV discount +7.5/15.0
- Schools +5.3/10.0
- Rent growth +3.2/5.0
- Livability +3.2/5.0
- Condition / age +2.5/5.0
- Appreciation +0.0/10.0
$119,900
🖨 Deal sheet (PDF) 📄 Offer letter ✓ Due diligence
Listing remarks
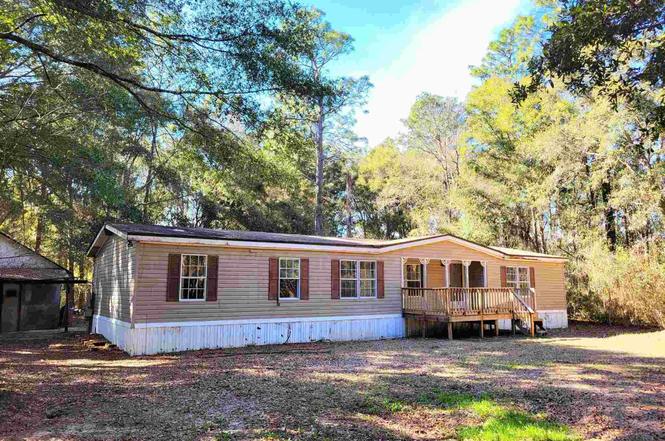
Nestled on a generous 1.44-acre lot, this 1996 mobile home offers 3 bedrooms and 2 bathrooms, providing ample space and potential for your personal touch. With an open layout that enhances both space and natural light, this fixer-upper home is a blank canvas ready for transformation. The expansive lot offers endless possibilities for outdoor activities, gardening, or future additions, giving you room to make it your own. Located in a peaceful setting while still close to top-rated schools, shopping, and dining, this property perfectly balances tranquility and convenience. With some TLC, this could be the ideal home for those looking for both value and opportunity.
Key facts
- Generous lot
- Open layout
- Shopping
Tags
Property features AI
Finance
- Other: Resale property; Lot approx. 1.44 acres; Building area approx. 1,718 square feet; Road surface: paved
- HOA & community: No homeowners association
Exterior
- Parking: Driveway with open parking
- Utilities: Public water; Electric with circuit breakers and copper wiring; Public sewer (assumed included with public water and county road service)
- Home design: Mobile/manufactured home; One story; Off-grade foundation
- Construction: Frame construction; Roof: see remarks
- Exterior features: Partial fencing; Porch; Paved road access; County-maintained road
Interior
- Kitchen: Electric water heater
- Bedrooms: Master bedroom on the first floor (approx. 12 x 16); Bedroom on the first floor (approx. 12 x 12); Second bedroom on the first floor (approx. 14 x 12)
- Flooring: Carpet
- Bathrooms: Two full bathrooms
- Heating & cooling: Central heating; Central air; Ceiling fans
- Interior features: Carpet flooring; Formal dining room
Neighborhood map
What this means for you Summary
Snapshot
- This is a 3-bed/2.0-bath manufactured listed at $120k.
Deal economics
- At list price, monthly cash flow is $749 ($9k/yr) — positive.
- The deal already cash-flows at list — no discount required.
- Meets the 1% rule at list price ($2k rent vs $120k).
- Recommended offer: $106k (12.0% below list) — sets the bar for market timing.
- Cap rate 13.8% vs local median 4.2% in Point Baker — top-decile yield for the area; either an underpriced asset or a hidden risk that comps aren't pricing in. Stress-test before assuming the spread holds.
Location & tenants
- Location reads 63/100 on livability (#735 in FL) — a middle-class / working-renter tenant base. Strengths: crime A+, cost of living A+, housing A+; Watch: schools F, amenities F, commute F.
- Santa Rosa (suburban): math 63% / reading 60% proficiency, ranked #8 of 73 in FL (top 11%) — acceptable for families but not a draw, mixed tenant base, ~2y average lease.
- Market conditions: Rents rising (+2.7%/yr); 360 active listings in the ZIP; 4 comparable units currently listed for rent nearby; rentals at typical pace (median 25d on market — plan ~3-4 weeks tenant-placement turnaround); solid renter incomes; 1,983 units permitted in Santa Rosa County in 2024 (128 in 5+ unit buildings).
- This rent runs 30% of the median local income ($77k/yr) — at the standard rent-burdened threshold; future hikes will face affordability resistance.
Forward outlook
- Local home prices are declining (-3.0%/yr); year-one equity from $829 of loan paydown is wiped out by about $4k of value loss. Plan a longer hold.
- Santa Rosa County population projected at +31% by 2050 — long-run rental-demand tailwind backs the buy-and-hold thesis.
- At projected returns (-3.0% appreciation + 2.7% rent growth), your $34k cash investment doubles in ~5 years — after that, you're playing with house money.
Negotiation context
- It's been on market 418 days — a 12% lower offer ($106k) is reasonable based on typical stale-listing flexibility.
- 3 sale attempts; this cycle's ask has dropped $35k (23%) from the opening price — seller is motivated, your offer sets the floor, not the list.
Risks & watch-outs
- Climate carrying-cost: severe wind risk, 99% chance of damaging wind over 30y; major wildfire risk; extreme-heat days projected 7→20/yr by 2055 (HVAC capex compounding) — expect insurance premiums to compound above CPI over the hold.
Questions for the listing agent
- It's been on market 418 days. Have you received any prior offers? Is the seller open to a 12% concession, seller financing, or rate buy-down credit?
- Why hasn't it sold? Are there any deal-killer items the seller is aware of (foundation, flood, title, zoning, code violations)?
- Is there a deadline driving the sale (1031 exchange, divorce, estate, relocation)? That informs how much negotiation room exists.
- Schools are F-rated, which usually means shorter tenancies and higher turnover. Who's the typical renter profile here, and what's been the actual vacancy rate?
- What's the average days-on-market for RENTAL listings here right now (not sales)? A rising rental-DOM trend means longer vacancies and softer asking-rent achievability than the comps imply.
- What's the recent tenant-quality profile in this submarket — average credit score on applications, eviction rate, late-payment / NSF rate, and stable-employment percentage? A property-management company in the area should have these aggregated.
- How much new for-sale + rental construction is in the pipeline within 1–3 miles? Heavy new supply typically softens prices + rents 12–24 months out; constrained supply supports both.
Investment metrics
- 1% rule
- 1.63% ✓
- Cap rate
- 13.79%
- Cash-on-cash
- 26.78%
- DSCR
- 2.19
- GRM
- 5.1
CMA / ARV
No comps found within radius.
Projected returns pro-forma
-3.0% appreciation · 2.7% rent growth · sell at horizon
- IRR
- 20.3%
- Equity multiple
- 1.83×
- Total profit
- $27,709
- Equity at exit
- $17,877
- IRR
- 28.3%
- Equity multiple
- 3.48×
- Total profit
- $83,208
- Equity at exit
- $10,367
Cash invested: $33,572 (down + closing). Projections, not guarantees.
Landlord ↔ Tenant lean methodology
- Overall (STATE)
- 87 Strongly Landlord-Friendly
- State Florida
- 87 Strongly Landlord-Friendly · R+3
- County
- — inherits STATE
- City
- — inherits STATE
ZIP-level market 32570
- Home prices YoY
- -15.1%
- Rents YoY
- 2.7%
- Active inventory
- 360
- Price-to-rent
- 5.1×
Monthly cashflow live
- Estimated rent
- $1,952 medium interval (Pro) →
- Mortgage (P&I)
- −$629
- Tax from tax record
- −$114 /mo · $1,369/yr
- Insurance
- −$50
- HOA
- −$0
- Vacancy / Maint / Mgmt
- −$410
- Net cashflow
- $749
Break-even live
Sensitivity live
| Price | -10% $817 | -5% $783 | +0% $749 | +5% $715 | +10% $681 |
|---|---|---|---|---|---|
| Rent | -10% $595 | -5% $672 | +0% $749 | +5% $826 | +10% $903 |
| Rate | -1.0pp $810 | -0.5pp $780 | base $749 | +0.5pp $718 | +1.0pp $687 |
UW: 25.0% down · 7.5% · 30yr · 1.5% tax · 5.0% vac · 8.0% maint · 8.0% mgmt
Financing live
Cash to close
- Down payment
- $29,975
- Closing costs
- $3,597
- Reserves months
- —
- Total cash needed
- —
Loan-product check · same deal, 3 products live
Conventional
25% down · 7.5% · 30yr
- Down + closing
- —
- Monthly P&I
- —
- Monthly cashflow
- —
- DSCR
- —
- Eligible?
- —
Personal DTI + credit; lowest rate.
DSCR
20% down · 8.5% · 30yr
- Down + closing
- —
- Monthly P&I
- —
- Monthly cashflow
- —
- DSCR
- —
- Eligible?
- —
No personal income docs; deal must DSCR.
Hard money
10% down · 12.0% · 12mo
- Down + closing
- —
- Monthly P&I
- —
- Monthly cashflow
- —
- DSCR
- —
- Eligible?
- —
Short-term bridge; refi at stabilization.
Rent comps 4 comps
| Address | Beds | Baths | Sqft | Rent | $/sqft | DOM | Units | Dist |
|---|---|---|---|---|---|---|---|---|
| 6707 Cedar Ridge Cir Milton, FL | 3.0 | 2.5 | 1669 | $1,900 | $1.14 | 15d | 1 | 0.96mi |
| 6747 Weathered Dr Milton, FL | 3.0 | 2.0 | 1546 | $1,800 | $1.16 | 24d | 1 | 1.25mi |
| 6716 Barnwood Dr Milton, FL | 3.0 | 2.0 | 1753 | $1,850 | $1.06 | 24d | 1 | 1.26mi |
| 5733 Orange St Milton, FL | 3.0 | 1.5 | 1640 | $1,500 | $0.91 | 24d | 1 | 1.49mi |
Listing history 26 events
-
2026-06-18days on market $119,900 Active 418 DOM
-
2026-06-17days on market $119,900 Active 417 DOM
-
2026-06-16days on market $119,900 Active 416 DOM
-
2026-06-15days on market $119,900 Active 415 DOM
-
2026-06-14days on market $119,900 Active 413 DOM
-
2026-06-10days on market $119,900 Active 410 DOM
-
2026-06-09days on market $119,900 Active 409 DOM
-
2026-06-08days on market $119,900 Active 408 DOM
-
2026-06-07days on market $119,900 Active 407 DOM
-
2026-06-05days on market $119,900 Active 404 DOM
-
2026-06-03days on market $119,900 Active 403 DOM
-
2026-06-02days on market $119,900 Active 402 DOM
-
2026-06-01days on market $119,900 Active 401 DOM
-
2026-05-31days on market $119,900 Active 400 DOM
-
2026-05-31days on market $119,900 Active 399 DOM
-
2026-04-12status Active
-
2026-04-12price $119,900
-
2026-03-12historical
-
2025-10-24status Active
-
2025-10-24price $75,000
-
2025-10-02historical
-
2025-08-14price $129,900
-
2025-06-13price $137,400
-
2025-05-22price $139,900
-
2025-05-01price $144,900
-
2025-03-04$154,900 Active
ⓘ Source: listings_history table (triggers on properties + properties_extension) + one-shot
backfill from property_details.listing_events for pre-trigger history.
Tax reassessment forecast FL · Resets to sale price
- Current annual tax
- $1,369 · $114/mo
- Projected year-2 tax
- $1,369 · $114/mo
- Expected delta
- $0/yr ($0/mo · 0.0%)
ⓘ Screening estimate from a state-policy table — verify with the county assessor before closing.
Climate risk First Street
- Flood 1/10 Low FEMA zone X (unshaded) · 0% chance over 30 yrs
- Wildfire 6/10 Major
- Heat 9/10 Extreme 7 d/yr ≥106°F today · 20 d/yr by 30 yrs out
- Wind 9/10 Extreme 99% chance of damaging wind over 30 yrs
- Air quality 2/10 Low 1 unhealthy d/yr today · 1 by 30 yrs out
Nearby sold comps map
Loading sold comps map…
Walkable amenities ~0.75 mi
Loading nearby amenities…
Taxation est. · year 1
- Rental income
- $23,424
- − Mortgage interest
- −$6,716
- − Property taxes
- −$1,369
- − Insurance
- −$600
- − Repairs & maintenance
- −$1,874
- − Management
- −$1,874
- − Depreciation
- −$3,488
- Taxable income
- $7,503
- Est. tax owed @ 24.0%
- −$1,801
- After-tax cash flow
- $7,190/yr
For passive investors: Depreciation is non-cash, so a rental often shows a tax loss while cash-flowing — sheltering income. Rental losses are passive: they offset passive income freely, and up to $25,000/yr can offset ordinary (W-2) income if you actively participate and your MAGI is under $100k (phasing out to $0 by $150k); unused losses carry forward. On sale, claimed depreciation is recaptured at up to 25%, and gains may owe capital-gains tax (a 1031 exchange can defer both). Figures are a year-1 estimate at your 24.0% rate — not tax advice; consult a CPA.
Schools (NCES district)
- District
- Santa Rosa
- NCES district ID
- 1201650
- Math proficiency
- 63% ▼ -6.00%
- Reading proficiency
- 60% ▼ -5.00%
- Median HH income
- $58,161
- Composite
- 53.12/100
- National rank
- #1511
- State rank
- #8 of 73 in FL
Livability — Point Baker
- Score
- 63/100
- State rank
- #735
- US rank
- #15840
Category grades
Schools grade is shown separately in the Schools card above.
Census & demographics
- County
- Santa Rosa County · 194,764 people
- City population
- 69,025
- Metro
- Pensacola-Ferry Pass-Brent, FL
- Population (ZIP)
- 37,197
- Household income
- $77,222
- Rent vs Own
- Severe rent burden
- 590.0
Population outlook (Santa Rosa County) Hauer SSP2
- Today (2025)
- 195,978 people
- By 2030
- 209,782 · +7.0%
- By 2040
- 235,293 · +20.1%
- By 2050
- 256,408 · +30.8%
- By 2075
- 298,074 · +52.1%
- By 2100
- 303,216 · +54.7%
Race, ethnicity, and origin ACS 2023
- Neighborhood character
- Predominantly White (80%)
- Race & ethnicity
- White 80% Two or more races 7% Black 6% Hispanic / Latino 6% Asian 1%
- Hispanic origin (detail)
- Mexican 2% Puerto Rican 2%
- Common ancestry
- Italian 4% Lithuanian 3% Portuguese 2%
- Foreign-born
- 4% · Canada
- Languages at home
- 94% English-only · Spanish 4% Other Asian/Pacific 1%
Political lean MEDSL · Santa Rosa
- 2024 margin
- Solid R (+51.0) · D 24.1% · R 75.0%
- 2008→2024 swing
- -3.0pp toward R · 2008: -47.9pp · 2024: -51.0pp
- All cycles
- 2024: R+51.0 2020: R+46.5 2016: R+53.5 2012: R+52.6 2008: R+47.9
Not yet ingested
- Civics
- —
Market trends
- HPI YoY
- ▼ -51.06%
- Current HPI
- 287.7469
- Rent YoY
- ▲ 2.70%
- Metro
- Pensacola-Ferry Pass-Brent, FL
- State GDP YoY
- ▲ 3.28%
- F500 in state
- 36
Industry mix (Fortune 500 HQ in FL)
| Industry | F500 HQs | Revenue |
|---|---|---|
| Industrial Technology | 2 | $29B |
|
||
| Insurance | 2 | $17B |
|
||
| Retail | 1 | $60B |
|
||
| Technology Distribution | 1 | $58B |
|
||
| Homebuilding | 1 | $35B |
|
||
| Technology Manufacturing | 1 | $35B |
|
||
Price history
-22.6% since first listed11 events — show timeline
- 2026-04-12 Relisted — PARMLS
- 2026-04-12 Price Changed $119,900 PARMLS
- 2026-03-12 Listing Removed — PARMLS
- 2025-10-24 Relisted — PARMLS
- 2025-10-24 Price Changed $75,000 PARMLS
- 2025-10-02 Listing Removed — PARMLS
- 2025-08-14 Price Changed $129,900 PARMLS
- 2025-06-13 Price Changed $137,400 PARMLS
- 2025-05-22 Price Changed $139,900 PARMLS
- 2025-05-01 Price Changed $144,900 PARMLS
- 2025-03-04 Listed $154,900 PARMLS
Property tax history
+10.6%/yrLatest (2025): $1,369 · +10.5% YoY. Source: county tax records.
Cash-flow waterfall
monthlySold comps — $/sqft
last 12 mo · ≤1 miLoading sold comps…