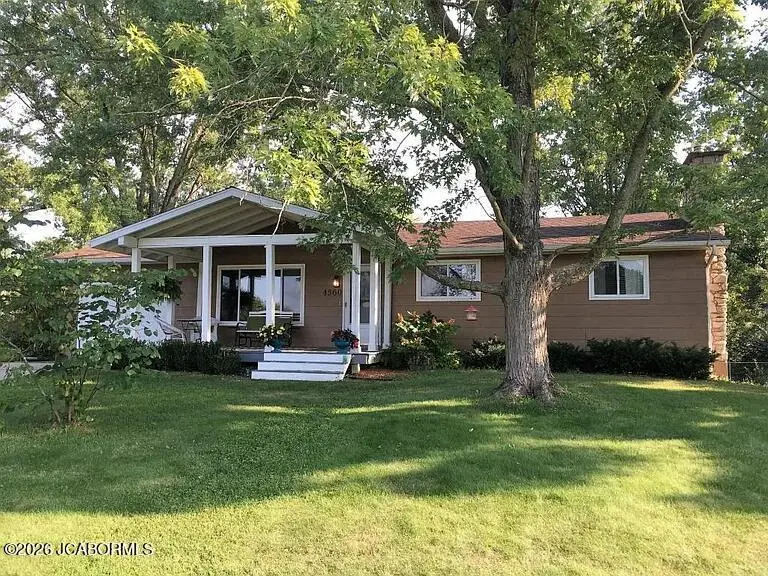
4360 E Lang Dr · Columbia, MO
Flood risk 1/10 · Minimal
- FEMA flood zone
- X (unshaded)
- Chance of flooding over 30 yrs
- 0.0%
- Est. flood insurance / yr
- $473 – $860
Fire risk 1/10 · Minimal
- Est. fire insurance / yr
- $1,054 – $1,958
Heat risk 4/10 · Minor
- Hot days now (above 106°F)
- 7 days/yr
- Hot days in 30 yrs
- 19 days/yr
Wind risk 2/10 · Minimal
- Chance of severe wind over 30 yrs
- —
Air-quality risk 1/10 · Minimal
- Unhealthy air days now
- 0 days/yr
- Unhealthy air days in 30 yrs
- 0 days/yr
Risk factors via First Street. Map © Google.
Why this score? — see what drove the B- grade
The composite is a weighted blend of 9 inputs, each scored 0–100. Each bar is that input's sub-score; the figure is the points it added to the 100-point composite (weight × sub-score).
- Cash flow +23.3/30.0
- ARV discount +15.0/15.0
- DSCR +7.5/10.0
- 1% rule +5.7/10.0
- Livability +4.2/5.0
- Rent growth +4.0/5.0
- Schools +3.9/10.0
- Condition / age +2.5/5.0
- Appreciation +0.0/10.0
$149,900
🖨 Deal sheet (PDF) 📄 Offer letter ✓ Due diligence
Listing remarks MLS
Ranch-style home with great potential! This property features hardwood floors, a primary bedroom with private bath, and a 1-car garage. The basement has been partially demoed and is ready for someone to finish to their liking. With a level backyard and solid layout, this home offers a great opportunity for an investor or a buyer willing to put in some sweat equity. A little TLC could go a long way in making this home shine.
Key facts
- Private bath
- Level backyard
- Solid layout
Tags
Neighborhood map
What this means for you Summary
Snapshot
- This is a 3-bed/2.0-bath single-family listed at $150k.
Deal economics
- At list price, monthly cash flow is $275 ($3k/yr) — positive.
- The deal already cash-flows at list — no discount required.
- Meets the 1% rule at list price ($2k rent vs $150k).
- Recommended offer: $145k (3.0% below list) — sets the bar for market timing.
- Cap rate 8.5% vs local median 2.9% in Columbia — top-decile yield for the area; either an underpriced asset or a hidden risk that comps aren't pricing in. Stress-test before assuming the spread holds.
Location & tenants
- Location reads 83/100 on livability (#9 in MO, #862 nationally) — a professional / high-income tenant draw. Strengths: amenities A+, commute A+, cost of living A+; Watch: crime D+.
- Hallsville R-IV (rural): math 45% / reading 45% proficiency, ranked #87 of 324 in MO (top 27%) — families likely to look elsewhere, expect single-tenant / working-renter base with shorter leases.
- Zoned schools: Hallsville Primary (351 students, 28% FRL); Hallsville Middle (math 48% / reading 44%, grade D+, #102 of 391 statewide, top 26%, 365 students, 28% FRL); Hallsville High (math 52% / reading 47%, grade D, #124 of 521 statewide, top 28%, 448 students, 25% FRL) — zoned schools at 27% FRL track the district average.
- Market conditions: Rents rising fast (+6.0%/yr); 351 active listings in the ZIP; 1,303 units permitted in Boone County in 2024 (549 in 5+ unit buildings).
Forward outlook
- Local home prices are declining (-3.0%/yr); year-one equity from $1k of loan paydown is wiped out by about $4k of value loss. Plan a longer hold.
- Boone County population projected at +36% by 2050 — long-run rental-demand tailwind backs the buy-and-hold thesis.
- At projected returns (-3.0% appreciation + 6.0% rent growth), your $42k cash investment doubles in ~10 years — after that, you're playing with house money.
Negotiation context
- It's been on market 36 days — a 3% lower offer ($145k) is reasonable based on typical stale-listing flexibility.
- 5 sale attempts since 9y ago; this cycle's ask has dropped $50k (25%) from the opening price — seller is motivated, your offer sets the floor, not the list.
Questions for the listing agent
- It's been on market 36 days. Have you received any prior offers? Is the seller open to a 3% concession, seller financing, or rate buy-down credit?
- Built in 1967 — when were the roof, HVAC, electrical panel, plumbing, and water heater last replaced?
- Is there a deadline driving the sale (1031 exchange, divorce, estate, relocation)? That informs how much negotiation room exists.
- Schools are B-rated — typically a magnet for longer-tenancy family renters. What's the average tenant stay here, and is there a school-zone premium baked into asking?
- Crime grade is D in this area — have there been break-ins, vandalism, or insurance claims at this property in the last 3 years? What carrier currently insures it and at what premium?
- What's the average days-on-market for RENTAL listings here right now (not sales)? A rising rental-DOM trend means longer vacancies and softer asking-rent achievability than the comps imply.
- What's the recent tenant-quality profile in this submarket — average credit score on applications, eviction rate, late-payment / NSF rate, and stable-employment percentage? A property-management company in the area should have these aggregated.
- How much new for-sale + rental construction is in the pipeline within 1–3 miles? Heavy new supply typically softens prices + rents 12–24 months out; constrained supply supports both.
Investment metrics
- 1% rule
- 1.07% ✓
- Cap rate
- 8.49%
- Cash-on-cash
- 7.85%
- DSCR
- 1.35
- GRM
- 7.8
CMA / ARV
- ARV (on-the-fly)
- $239,946
- Comps found
- 2
Show comp detail 2 sales within ~0.75 mi
| Address | Dist | Beds/Ba | Sqft | Sold | Price | $/sf | Match |
|---|---|---|---|---|---|---|---|
| 4360 E Lang Dr | 0.00mi | 3/1.5 | 1,218 (0%) | 1mo | $149,900 | $123 | 98 |
| 4275 E Hillcrest Dr | 0.09mi | 3/1.5 | 1,184 (-3%) | 13mo | $232,800 | $197 | 78 |
Match score weights: distance 35% · size 25% · config 20% · recency 20%. Top-matched comps best support the ARV.
Projected returns pro-forma
-3.0% appreciation · 5.96% rent growth · sell at horizon
- IRR
- -1.2%
- Equity multiple
- 0.95×
- Total profit
- $-1,903
- Equity at exit
- $22,351
- IRR
- 11.3%
- Equity multiple
- 2.01×
- Total profit
- $42,235
- Equity at exit
- $12,961
Cash invested: $41,972 (down + closing). Projections, not guarantees.
Landlord ↔ Tenant lean methodology
- Overall (STATE)
- 81 Strongly Landlord-Friendly
- State Missouri
- 81 Strongly Landlord-Friendly · R+10
- County
- — inherits STATE
- City
- — inherits STATE
ZIP-level market 65202
- Rents YoY
- 6.0%
- Active inventory
- 351
- Price-to-rent
- 7.8×
Monthly cashflow live
- Estimated rent
- $1,600 medium interval (Pro) →
- Mortgage (P&I)
- −$786
- Tax from tax record
- −$141 /mo · $1,691/yr
- Insurance
- −$62
- HOA
- −$0
- Vacancy / Maint / Mgmt
- −$336
- Net cashflow
- $275
Break-even live
Sensitivity live
| Price | -10% $359 | -5% $317 | +0% $275 | +5% $232 | +10% $190 |
|---|---|---|---|---|---|
| Rent | -10% $148 | -5% $211 | +0% $275 | +5% $338 | +10% $401 |
| Rate | -1.0pp $350 | -0.5pp $313 | base $275 | +0.5pp $236 | +1.0pp $196 |
UW: 25.0% down · 7.5% · 30yr · 1.5% tax · 5.0% vac · 8.0% maint · 8.0% mgmt
Financing live
Cash to close
- Down payment
- $37,475
- Closing costs
- $4,497
- Reserves months
- —
- Total cash needed
- —
Loan-product check · same deal, 3 products live
Conventional
25% down · 7.5% · 30yr
- Down + closing
- —
- Monthly P&I
- —
- Monthly cashflow
- —
- DSCR
- —
- Eligible?
- —
Personal DTI + credit; lowest rate.
DSCR
20% down · 8.5% · 30yr
- Down + closing
- —
- Monthly P&I
- —
- Monthly cashflow
- —
- DSCR
- —
- Eligible?
- —
No personal income docs; deal must DSCR.
Hard money
10% down · 12.0% · 12mo
- Down + closing
- —
- Monthly P&I
- —
- Monthly cashflow
- —
- DSCR
- —
- Eligible?
- —
Short-term bridge; refi at stabilization.
Listing history 13 events
-
2026-04-17status Pending 427-char remark
Show marketing remark (427 chars)
Ranch-style home with great potential! This property features hardwood floors, a primary bedroom with private bath, and a 1-car garage. The basement has been partially demoed and is ready for someone to finish to their liking. With a level backyard and solid layout, this home offers a great opportunity for an investor or a buyer willing to put in some sweat equity. A little TLC could go a long way in making this home shine.
-
2026-04-17status Pending
Show marketing remark (427 chars)
Ranch-style home with great potential! This property features hardwood floors, a primary bedroom with private bath, and a 1-car garage. The basement has been partially demoed and is ready for someone to finish to their liking. With a level backyard and solid layout, this home offers a great opportunity for an investor or a buyer willing to put in some sweat equity. A little TLC could go a long way in making this home shine.
-
2026-04-15price $149,900 427-char remark
Show marketing remark (427 chars)
Ranch-style home with great potential! This property features hardwood floors, a primary bedroom with private bath, and a 1-car garage. The basement has been partially demoed and is ready for someone to finish to their liking. With a level backyard and solid layout, this home offers a great opportunity for an investor or a buyer willing to put in some sweat equity. A little TLC could go a long way in making this home shine.
-
2026-04-14price $149,900
-
2026-03-20price $179,900
Show marketing remark (427 chars)
Ranch-style home with great potential! This property features hardwood floors, a primary bedroom with private bath, and a 1-car garage. The basement has been partially demoed and is ready for someone to finish to their liking. With a level backyard and solid layout, this home offers a great opportunity for an investor or a buyer willing to put in some sweat equity. A little TLC could go a long way in making this home shine.
-
2026-03-20price $179,900 427-char remark
Show marketing remark (427 chars)
Ranch-style home with great potential! This property features hardwood floors, a primary bedroom with private bath, and a 1-car garage. The basement has been partially demoed and is ready for someone to finish to their liking. With a level backyard and solid layout, this home offers a great opportunity for an investor or a buyer willing to put in some sweat equity. A little TLC could go a long way in making this home shine.
-
2026-03-12$199,900 Active
-
2026-03-11$199,900 Active 427-char remark
Show marketing remark (427 chars)
Ranch-style home with great potential! This property features hardwood floors, a primary bedroom with private bath, and a 1-car garage. The basement has been partially demoed and is ready for someone to finish to their liking. With a level backyard and solid layout, this home offers a great opportunity for an investor or a buyer willing to put in some sweat equity. A little TLC could go a long way in making this home shine.
-
2024-07-27$185,000 Active
-
2024-03-12$199,900 Active
-
2017-11-15soldstatus
-
2017-11-15soldstatus
-
2017-08-31$125,000
ⓘ Source: listings_history table (triggers on properties + properties_extension) + one-shot
backfill from property_details.listing_events for pre-trigger history.
Tax reassessment forecast MO · Resets to sale price
- Current annual tax
- $1,691 · $141/mo
- Projected year-2 tax
- $1,691 · $141/mo
- Expected delta
- $0/yr ($0/mo · 0.0%)
ⓘ Screening estimate from a state-policy table — verify with the county assessor before closing.
Climate risk First Street
- Flood 1/10 Low FEMA zone X (unshaded) · 0% chance over 30 yrs
- Wildfire 1/10 Low
- Heat 4/10 Moderate 7 d/yr ≥106°F today · 19 d/yr by 30 yrs out
- Wind 2/10 Low
- Air quality 1/10 Low 0 unhealthy d/yr today · 0 by 30 yrs out
Nearby sold comps map
Loading sold comps map…
Walkable amenities ~0.75 mi
Loading nearby amenities…
Taxation est. · year 1
- Rental income
- $19,200
- − Mortgage interest
- −$8,397
- − Property taxes
- −$1,691
- − Insurance
- −$750
- − Repairs & maintenance
- −$1,536
- − Management
- −$1,536
- − Depreciation
- −$4,361
- Taxable income
- $930
- Est. tax owed @ 24.0%
- −$223
- After-tax cash flow
- $3,071/yr
For passive investors: Depreciation is non-cash, so a rental often shows a tax loss while cash-flowing — sheltering income. Rental losses are passive: they offset passive income freely, and up to $25,000/yr can offset ordinary (W-2) income if you actively participate and your MAGI is under $100k (phasing out to $0 by $150k); unused losses carry forward. On sale, claimed depreciation is recaptured at up to 25%, and gains may owe capital-gains tax (a 1031 exchange can defer both). Figures are a year-1 estimate at your 24.0% rate — not tax advice; consult a CPA.
Schools (NCES district)
- District
- Hallsville R-IV
- NCES district ID
- 2913560
- Math proficiency
- 45% ▼ -4.00%
- Reading proficiency
- 45% ▼ -7.00%
- Median HH income
- $52,529
- Composite
- 38.89/100
- National rank
- #4097
- State rank
- #87 of 324 in MO
Livability — Columbia
- Score
- 83/100
- State rank
- #9
- US rank
- #862
Category grades
Schools grade is shown separately in the Schools card above.
Census & demographics
- County
- Boone County · 158,877 people
- City population
- 158,877
- Metro
- Columbia, MO
- Population (ZIP)
- 47,327
- Household income
- $72,289
- Rent vs Own
- Severe rent burden
- 1326.0
Population outlook (Boone County) Hauer SSP2
- Today (2025)
- 202,891 people
- By 2030
- 217,799 · +7.3%
- By 2040
- 246,789 · +21.6%
- By 2050
- 276,116 · +36.1%
- By 2075
- 348,426 · +71.7%
- By 2100
- 400,856 · +97.6%
Race, ethnicity, and origin ACS 2023
- Neighborhood character
- Predominantly White (68%)
- Race & ethnicity
- White 68% Black 16% Two or more races 8% Hispanic / Latino 6% Asian 3%
- Hispanic origin (detail)
- Mexican 4%
- Common ancestry
- Lithuanian 2% Italian 2% Slovak 2%
- Foreign-born
- 6% · Canada, South Korea
- Languages at home
- 91% English-only · Spanish 3% Other Asian/Pacific 1% French/Haitian/Cajun 1%
Political lean MEDSL · Boone
- 2024 margin
- Lean D (+9.8) · D 53.9% · R 44.1% · Other 2.1%
- 2008→2024 swing
- -2.2pp toward R · 2008: 12.0pp · 2024: 9.8pp
- All cycles
- 2024: D+9.8 2020: D+12.5 2016: D+5.9 2012: D+3.1 2008: D+12.0
Not yet ingested
- Civics
- —
Market trends
- HPI YoY
- ▼ -171.32%
- Current HPI
- 205.5154
- Rent YoY
- ▲ 5.96%
- Metro
- Columbia, MO
- State GDP YoY
- ▲ 1.84%
- F500 in state
- 20
Industry mix (Fortune 500 HQ in MO)
| Industry | F500 HQs | Revenue |
|---|---|---|
| Healthcare | 1 | $163B |
|
||
| Insurance | 1 | $21B |
|
||
| Industrial Technology | 1 | $17B |
|
||
| Retail | 1 | $16B |
|
||
| Industrial Distribution | 1 | $10B |
|
||
| Utilities | 1 | $9B |
|
||
Price history
+19.9% since first listed13 events — show timeline
- 2026-04-17 Pending — JCMLS
- 2026-04-17 Pending — CBORMLS
- 2026-04-15 Price Changed $149,900 JCMLS
- 2026-04-14 Price Changed $149,900 CBORMLS
- 2026-03-20 Price Changed $179,900 CBORMLS
- 2026-03-20 Price Changed $179,900 JCMLS
- 2026-03-12 Listed $199,900 CBORMLS
- 2026-03-11 Listed $199,900 JCMLS
- 2024-07-27 Listed $185,000 CBORMLS
- 2024-03-12 Listed $199,900 CBORMLS
- 2017-11-15 Sold (Public Records) — Public Records
- 2017-11-15 Sold (MLS) — CBORMLS
- 2017-08-31 Listed $125,000 CBORMLS
Property tax history
+3.1%/yrLatest (2025): $1,691 · +7.0% YoY. Source: county tax records.
Cash-flow waterfall
monthlySold comps — $/sqft
last 12 mo · ≤1 miLoading sold comps…