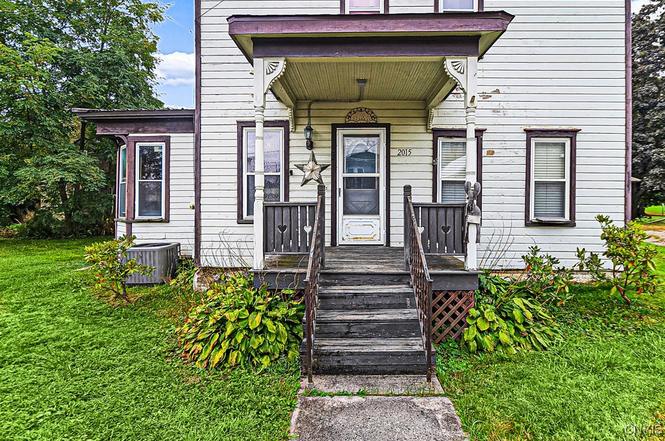
2015 State Route 8 Hwy · Unadilla Forks, NY
Flood risk 1/10 · Minimal
- FEMA flood zone
- X
- Chance of flooding over 30 yrs
- 0.0%
- Est. flood insurance / yr
- $473 – $860
Fire risk 2/10 · Minimal
- Est. fire insurance / yr
- $691 – $1,283
Heat risk 2/10 · Minimal
- Hot days now (above 92°F)
- 8 days/yr
- Hot days in 30 yrs
- 18 days/yr
Wind risk 2/10 · Minimal
- Chance of severe wind over 30 yrs
- 1.0%
Air-quality risk 1/10 · Minimal
- Unhealthy air days now
- 0 days/yr
- Unhealthy air days in 30 yrs
- 0 days/yr
Risk factors via First Street. Map © Google.
Why this score? — see what drove the C- grade
The composite is a weighted blend of 9 inputs, each scored 0–100. Each bar is that input's sub-score; the figure is the points it added to the 100-point composite (weight × sub-score).
- Cash flow +17.5/30.0
- ARV discount +7.5/15.0
- DSCR +5.5/10.0
- 1% rule +5.0/10.0
- Appreciation +5.0/10.0
- Schools +4.2/10.0
- Rent growth +2.5/5.0
- Livability +2.5/5.0
- Condition / age +2.5/5.0
$139,999
🖨 Deal sheet 📄 Offer letter ✓ Due diligence
Listing remarks
Nestled in the serene countryside of Leonardsville, NY, & priced to Sell, this charming 4-bedroom, 2-bathroom home offers peaceful living with modern comforts. Located on State Highway 8, the property boasts a beautiful country setting perfect for those seeking a retreat from city life. Step inside to discover spacious living areas, ideal for family gatherings or quiet nights in. The fully screened-in porch is a standout feature, perfect for enjoying the outdoors without the hassle of insects. A new roof adds value and peace of mind, ensuring low-maintenance living for years to come. With its generous 4 bedrooms, there's plenty of space for a growing family or guests. Whether you're lo
Key facts
- New roof
- 8,712 sq ft lot
- 2 garage spots
Tags
Neighborhood map
What this means for you Summary
Snapshot
- This is a 4-bed/1.0-bath single-family listed at $140k.
Deal economics
- At list price, monthly cash flow is $109 ($1k/yr) — positive.
- The deal already cash-flows at list — no discount required.
- To meet the 1% rule (rent ≥ 1% of price), the offer needs to be $140k (0.1% below list).
- Recommended offer: $140k (0.1% below list) — sets the bar for 1% rule.
Location & tenants
- Location reads: area grade C — affects rentability + tenant quality, not the cash-flow math above.
- Mount Markham Central School District (rural): math 47% / reading 52% proficiency, ranked #393 of 590 in NY (top 67%) — families likely to look elsewhere, expect single-tenant / working-renter base with shorter leases.
- Market conditions: 4 active listings in the ZIP; 137 units permitted in Madison County in 2024 (46 in 5+ unit buildings).
Forward outlook
- In year one you build about $5k of equity ($968 loan paydown + $4k appreciation (3.0% local appreciation)).
- Madison County population projected at -24% by 2050 — secular population decline; favor cash flow + early exit over multi-decade hold.
- At projected returns (3.0% appreciation + 3.0% rent growth), your $39k cash investment doubles in ~6 years — after that, you're playing with house money.
- By year 7, paydown + projected appreciation supports a ~$33k cash-out refi (75% LTV) — recoverable capital for the next deal without selling this one.
Negotiation context
- Only 14 days on market — expect competitive offers; lowballing is unlikely to land.
- 8 sale attempts since 8y ago with the ask held roughly flat each time — persistent listings suggest the price (not the market) is what's stuck; bring a comps-based counter.
Risks & watch-outs
- Watch-outs: built in 1893 — expect roof / HVAC / electrical / plumbing capex.
Questions for the listing agent
- Built in 1893 — when were the roof, HVAC, electrical panel, plumbing, and water heater last replaced?
- Is there a deadline driving the sale (1031 exchange, divorce, estate, relocation)? That informs how much negotiation room exists.
- What's the average days-on-market for RENTAL listings here right now (not sales)? A rising rental-DOM trend means longer vacancies and softer asking-rent achievability than the comps imply.
- What's the recent tenant-quality profile in this submarket — average credit score on applications, eviction rate, late-payment / NSF rate, and stable-employment percentage? A property-management company in the area should have these aggregated.
- How much new for-sale + rental construction is in the pipeline within 1–3 miles? Heavy new supply typically softens prices + rents 12–24 months out; constrained supply supports both.
Investment metrics
- 1% rule
- 1.00% ✗
- Cap rate
- 7.22%
- Cash-on-cash
- 3.32%
- DSCR
- 1.15
- GRM
- 8.3
CMA / ARV
No comps found within radius.
Projected returns pro-forma
3.0% appreciation · 3.0% rent growth · sell at horizon
- IRR
- 10.6%
- Equity multiple
- 1.61×
- Total profit
- $23,821
- Equity at exit
- $62,950
- IRR
- 12.9%
- Equity multiple
- 2.92×
- Total profit
- $75,181
- Equity at exit
- $97,013
Cash invested: $39,200 (down + closing). Projections, not guarantees.
Landlord ↔ Tenant lean methodology
- Overall (STATE)
- 15 Strongly Tenant-Friendly
- State New York
- 15 Strongly Tenant-Friendly · D+10
- County
- — inherits STATE
- City
- — inherits STATE
ZIP-level market 13364
- Active inventory
- 4
- Price-to-rent
- 8.3×
Monthly cashflow live
- Estimated rent
- $1,399 medium interval (Pro) →
- Mortgage (P&I)
- −$734
- Tax from tax record
- −$204 /mo · $2,449/yr
- Insurance
- −$58
- HOA
- −$0
- Vacancy / Maint / Mgmt
- −$294
- Net cashflow
- $109
Break-even live
UW: 25.0% down · 7.5% · 30yr · 1.5% tax · 5.0% vac · 8.0% maint · 8.0% mgmt
Financing live
Cash to close
- Down payment
- $35,000
- Closing costs
- $4,200
- Reserves months
- —
- Total cash needed
- —
Loan-product check · same deal, 3 products live
Conventional
25% down · 7.5% · 30yr
- Down + closing
- —
- Monthly P&I
- —
- Monthly cashflow
- —
- DSCR
- —
- Eligible?
- —
Personal DTI + credit; lowest rate.
DSCR
20% down · 8.5% · 30yr
- Down + closing
- —
- Monthly P&I
- —
- Monthly cashflow
- —
- DSCR
- —
- Eligible?
- —
No personal income docs; deal must DSCR.
Hard money
10% down · 12.0% · 12mo
- Down + closing
- —
- Monthly P&I
- —
- Monthly cashflow
- —
- DSCR
- —
- Eligible?
- —
Short-term bridge; refi at stabilization.
Listing history 21 events
-
2026-02-23soldstatus $132,000
-
2025-12-10status Pending
-
2025-11-26$139,999 Active
-
2025-03-10historical
-
2024-10-07$169,999 Active
-
2021-06-23soldstatus $85,000
-
2021-06-23$92,500
-
2021-06-09soldstatus $85,000
-
2021-06-08soldstatus $85,000
-
2021-06-08soldstatus $85,000
-
2020-12-05$92,500
-
2020-12-05$92,500
-
2020-10-09historical
-
2020-04-27status Active
-
2020-03-25historical Continue to Show- Under Contract
-
2020-03-21status Under Contract- Do Not Show
-
2019-10-08$94,900 Active
-
2019-09-25historical
-
2019-06-20price $82,900
-
2018-09-13price $84,900
-
2018-05-04$89,900 Active
ⓘ Source: listings_history table (triggers on properties + properties_extension) + one-shot
backfill from property_details.listing_events for pre-trigger history.
Tax reassessment forecast NY · Partial reset (capped growth)
- Current annual tax
- $2,449 · $204/mo
- Projected year-2 tax
- $2,449 · $204/mo
- Expected delta
- $0/yr ($0/mo · 0.0%)
ⓘ Screening estimate from a state-policy table — verify with the county assessor before closing.
Climate risk First Street
- Flood 1/10 Low FEMA zone X · 0% chance over 30 yrs
- Wildfire 2/10 Low
- Heat 2/10 Low 8 d/yr ≥92°F today · 18 d/yr by 30 yrs out
- Wind 2/10 Low 100% chance of damaging wind over 30 yrs
- Air quality 1/10 Low 0 unhealthy d/yr today · 0 by 30 yrs out
Nearby sold comps map
Loading sold comps map…
Walkable amenities ~0.75 mi
Loading nearby amenities…
Taxation est. · year 1
- Rental income
- $16,788
- − Mortgage interest
- −$7,842
- − Property taxes
- −$2,449
- − Insurance
- −$700
- − Repairs & maintenance
- −$1,343
- − Management
- −$1,343
- − Depreciation
- −$4,073
- Taxable loss
- −$962
- Est. tax savings @ 24.0%
- +$231
- After-tax cash flow
- $1,534/yr
For passive investors: Depreciation is non-cash, so a rental often shows a tax loss while cash-flowing — sheltering income. Rental losses are passive: they offset passive income freely, and up to $25,000/yr can offset ordinary (W-2) income if you actively participate and your MAGI is under $100k (phasing out to $0 by $150k); unused losses carry forward. On sale, claimed depreciation is recaptured at up to 25%, and gains may owe capital-gains tax (a 1031 exchange can defer both). Figures are a year-1 estimate at your 24.0% rate — not tax advice; consult a CPA.
Schools (NCES district)
- District
- Mount Markham Central School District
- NCES district ID
- 3630930
- Math proficiency
- 47% ▼ -2.00%
- Reading proficiency
- 52% ▲ 10.00%
- Median HH income
- $49,456
- Composite
- 42.3/100
- National rank
- #3262
- State rank
- #393 of 590 in NY
Livability — Unadilla Forks
No livability data for this city. (Only ~50 U.S. cities are tracked.)
Census & demographics
- Population (ZIP)
- 359
Population outlook (Madison County) Hauer SSP2
- Today (2025)
- 69,528 people
- By 2030
- 66,599 · -4.2%
- By 2040
- 59,814 · -14.0%
- By 2050
- 52,842 · -24.0%
- By 2075
- 39,167 · -43.7%
- By 2100
- 28,442 · -59.1%
Race, ethnicity, and origin ACS 2023
- Neighborhood character
- Predominantly White (81%)
- Race & ethnicity
- White 81% Two or more races 17% Asian 2%
- Common ancestry
- Romanian 9%
Political lean MEDSL · Madison
- 2024 margin
- R (+13.1) · D 43.5% · R 56.5%
- 2008→2024 swing
- -13.9pp toward R · 2008: 0.9pp · 2024: -13.1pp
- All cycles
- 2024: R+13.1 2020: R+10.6 2016: R+15.9 2012: D+0.3 2008: D+0.9
Not yet ingested
- Civics
- —
Market trends
- HPI YoY
- —
- Current HPI
- —
- Rent YoY
- —
- Metro
- —
- State GDP YoY
- ▲ 2.60%
- F500 in state
- 92
Industry mix (Fortune 500 HQ in NY)
| Industry | F500 HQs | Revenue |
|---|---|---|
| Financial Services | 10 | $950B |
|
||
| Consumer Goods | 9 | $162B |
|
||
| Insurance | 4 | $225B |
|
||
| Telecommunications | 2 | $144B |
|
||
| Pharmaceuticals | 2 | $112B |
|
||
| Media / Entertainment | 2 | $69B |
|
||
Price history
+46.8% since first listed21 events — show timeline
- 2026-02-23 Sold (Public Records) $132,000 Public Records
- 2025-12-10 Pending — CNYIS
- 2025-11-26 Listed $139,999 CNYIS
- 2025-03-10 Listing Removed — CNYIS
- 2024-10-07 Listed $169,999 CNYIS
- 2021-06-23 Listed $92,500 CNYIS
- 2021-06-23 Sold (MLS) $85,000 CNYIS
- 2021-06-09 Sold (Public Records) $85,000 Public Records
- 2021-06-08 Sold (MLS) $85,000 ODBOR
- 2021-06-08 Sold (MLS) $85,000 UNYREIS
- 2020-12-05 Listed $92,500 ODBOR
- 2020-12-05 Listed $92,500 UNYREIS
- 2020-10-09 Listing Removed — CNYIS
- 2020-04-27 Relisted — CNYIS
- 2020-03-25 Contingent — CNYIS
- 2020-03-21 Pending — CNYIS
- 2019-10-08 Listed $94,900 CNYIS
- 2019-09-25 Listing Removed — CNYIS
- 2019-06-20 Price Changed $82,900 CNYIS
- 2018-09-13 Price Changed $84,900 CNYIS
- 2018-05-04 Listed $89,900 CNYIS
Property tax history
+4.1%/yrLatest (2025): $2,449 · +2.8% YoY. Source: county tax records.
Cash-flow waterfall
monthlySold comps — $/sqft
last 12 mo · ≤1 miLoading sold comps…