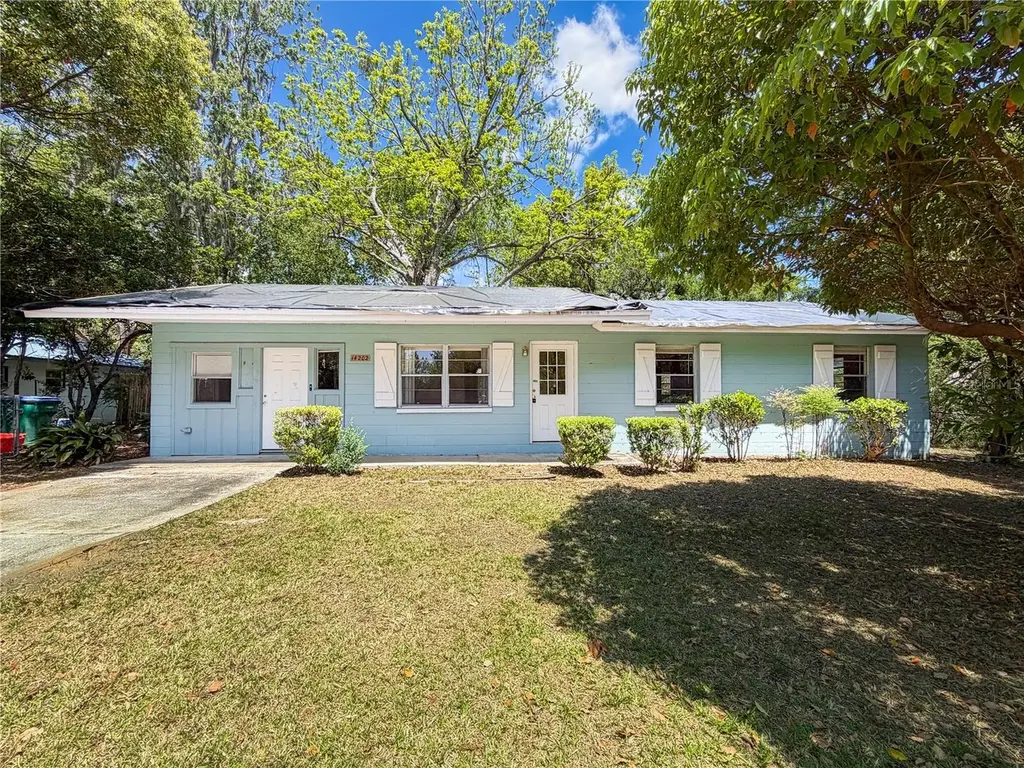
14202 NW 158th Ave · Alachua, FL
Flood risk 1/10 · Minimal
- FEMA flood zone
- X (unshaded)
- Chance of flooding over 30 yrs
- 0.0%
- Est. flood insurance / yr
- $507 – $1,088
Fire risk 6/10 · Moderate
- Est. fire insurance / yr
- $947 – $1,759
Heat risk 8/10 · Major
- Hot days now (above 108°F)
- 7 days/yr
- Hot days in 30 yrs
- 22 days/yr
Wind risk 9/10 · Severe
- Chance of severe wind over 30 yrs
- 99.0%
Air-quality risk 4/10 · Minor
- Unhealthy air days now
- 4 days/yr
- Unhealthy air days in 30 yrs
- 5 days/yr
Risk factors via First Street. Map © Google.
Why this score? — see what drove the B grade
The composite is a weighted blend of 9 inputs, each scored 0–100. Each bar is that input's sub-score; the figure is the points it added to the 100-point composite (weight × sub-score).
- Cash flow +30.0/30.0
- 1% rule +10.0/10.0
- DSCR +10.0/10.0
- ARV discount +7.5/15.0
- Schools +4.3/10.0
- Livability +3.9/5.0
- Rent growth +2.5/5.0
- Condition / age +2.5/5.0
- Appreciation +0.0/10.0
$119,900
🖨 Deal sheet (PDF) 📄 Offer letter ✓ Due diligence
Listing remarks
An excellent opportunity on almost half an acre in the heart of the good life community! This 1970s-built concrete block home has a 3 bedroom/1.5 bath floorplan with a sunny living room, adjacent dining space with sliding doors to the rear patio, and a galley-style kitchen. There is also a bonus/flex space with its own entrance that could be utilized as an additional living room, home office, craft/hobby space, etc. Located less than a mile from charming Main Street Alachua with easy access to Gainesville via I-75 or US 441.
Key facts
- Sunny living room
- Galley style kitchen
- Half an acre
Tags
Property features AI
Finance
- Other: Lot about 0.41 acres (1/4 to less than 1/2 acre); Zoning: RSF-3
- HOA & community: No association; Development: Alachua Realty
Exterior
- Utilities: Public water; Public sewer; Electricity available
- Home design: Single family residence; Residential property; Fixer condition; One story; Faces south; Entry on main level
- Construction: Block construction; Shingle roof; Slab foundation; Built area approx. 1,472 total
- Exterior features: Patio; Private mailbox; Paved public-maintained road
Interior
- Kitchen: No appliances included
- Bedrooms: 3 bedrooms
- Flooring: Ceramic tile; Laminate
- Bathrooms: 1 full bathroom; 1 half bathroom
- Heating & cooling: Central heating; Central air conditioning
- Interior features: Walk-in closet(s)
- Laundry & utility: Laundry inside
Neighborhood map
What this means for you Summary
Snapshot
- This is a 3-bed/2.0-bath single-family listed at $120k.
Deal economics
- At list price, monthly cash flow is $613 ($7k/yr) — positive.
- The deal already cash-flows at list — no discount required.
- Meets the 1% rule at list price ($2k rent vs $120k).
- Recommended offer: $118k (1.5% below list) — sets the bar for market timing.
Location & tenants
- Location reads 77/100 on livability (#188 in FL, #2,996 nationally) — a middle-class / working-renter tenant base. Strengths: housing A+, health & safety A+, cost of living A; Watch: amenities F, commute F.
- Alachua (urban): math 49% / reading 54% proficiency, ranked #30 of 73 in FL (top 41%) — acceptable for families but not a draw, mixed tenant base, ~2y average lease.
- Zoned schools: W. W. Irby Elementary School (379 students, 66% FRL); A. L. Mebane Middle School (math 36% / reading 40%, grade F, #388 of 571 statewide, top 69%, 332 students, 61% FRL); Santa Fe High School (math 35% / reading 56%, grade D-, #223 of 667 statewide, top 34%, 1,154 students, 47% FRL).
- Market conditions: 402 active listings in the ZIP; 1,774 units permitted in Alachua County in 2024 (984 in 5+ unit buildings).
Forward outlook
- Local home prices are declining (-3.0%/yr); year-one equity from $829 of loan paydown is wiped out by about $4k of value loss. Plan a longer hold.
- Alachua County population projected at +26% by 2050 — long-run rental-demand tailwind backs the buy-and-hold thesis.
- At projected returns (-3.0% appreciation + 3.0% rent growth), your $34k cash investment doubles in ~6 years — after that, you're playing with house money.
Negotiation context
- It's been on market 17 days — a 2% lower offer ($118k) is reasonable based on typical stale-listing flexibility.
- 6 sale attempts since 14y ago with the ask held roughly flat each time — persistent listings suggest the price (not the market) is what's stuck; bring a comps-based counter.
Risks & watch-outs
- Watch-outs: property tax is 2.9% of price.
- Climate carrying-cost: severe wind risk, 99% chance of damaging wind over 30y; major wildfire risk; extreme-heat days projected 7→22/yr by 2055 (HVAC capex compounding) — expect insurance premiums to compound above CPI over the hold.
Questions for the listing agent
- Built in 1976 — when were the roof, HVAC, electrical panel, plumbing, and water heater last replaced?
- Property tax is high relative to price — has the assessment been appealed recently, and will the sale trigger a re-assessment?
- Is there a deadline driving the sale (1031 exchange, divorce, estate, relocation)? That informs how much negotiation room exists.
- Schools are B-rated — typically a magnet for longer-tenancy family renters. What's the average tenant stay here, and is there a school-zone premium baked into asking?
- What's the average days-on-market for RENTAL listings here right now (not sales)? A rising rental-DOM trend means longer vacancies and softer asking-rent achievability than the comps imply.
- What's the recent tenant-quality profile in this submarket — average credit score on applications, eviction rate, late-payment / NSF rate, and stable-employment percentage? A property-management company in the area should have these aggregated.
- How much new for-sale + rental construction is in the pipeline within 1–3 miles? Heavy new supply typically softens prices + rents 12–24 months out; constrained supply supports both.
Investment metrics
- 1% rule
- 1.67% ✓
- Cap rate
- 12.43%
- Cash-on-cash
- 21.91%
- DSCR
- 1.98
- GRM
- 5.0
CMA / ARV
No comps found within radius.
Projected returns pro-forma
-3.0% appreciation · 3.0% rent growth · sell at horizon
- IRR
- 14.7%
- Equity multiple
- 1.59×
- Total profit
- $19,738
- Equity at exit
- $17,877
- IRR
- 23.4%
- Equity multiple
- 3.02×
- Total profit
- $67,950
- Equity at exit
- $10,367
Cash invested: $33,572 (down + closing). Projections, not guarantees.
Landlord ↔ Tenant lean methodology
- Overall (STATE)
- 87 Strongly Landlord-Friendly
- State Florida
- 87 Strongly Landlord-Friendly · R+3
- County
- — inherits STATE
- City
- — inherits STATE
ZIP-level market 32615
- Home prices YoY
- -21.6%
- Active inventory
- 402
- Price-to-rent
- 5.0×
Monthly cashflow live
- Estimated rent
- $2,006 medium interval (Pro) →
- Mortgage (P&I)
- −$629
- Tax from tax record
- −$293 /mo · $3,517/yr
- Insurance
- −$50
- HOA
- −$0
- Vacancy / Maint / Mgmt
- −$421
- Net cashflow
- $613
Break-even live
Sensitivity live
| Price | -10% $681 | -5% $647 | +0% $613 | +5% $579 | +10% $545 |
|---|---|---|---|---|---|
| Rent | -10% $455 | -5% $534 | +0% $613 | +5% $692 | +10% $772 |
| Rate | -1.0pp $673 | -0.5pp $644 | base $613 | +0.5pp $582 | +1.0pp $550 |
UW: 25.0% down · 7.5% · 30yr · 1.5% tax · 5.0% vac · 8.0% maint · 8.0% mgmt
Financing live
Cash to close
- Down payment
- $29,975
- Closing costs
- $3,597
- Reserves months
- —
- Total cash needed
- —
Loan-product check · same deal, 3 products live
Conventional
25% down · 7.5% · 30yr
- Down + closing
- —
- Monthly P&I
- —
- Monthly cashflow
- —
- DSCR
- —
- Eligible?
- —
Personal DTI + credit; lowest rate.
DSCR
20% down · 8.5% · 30yr
- Down + closing
- —
- Monthly P&I
- —
- Monthly cashflow
- —
- DSCR
- —
- Eligible?
- —
No personal income docs; deal must DSCR.
Hard money
10% down · 12.0% · 12mo
- Down + closing
- —
- Monthly P&I
- —
- Monthly cashflow
- —
- DSCR
- —
- Eligible?
- —
Short-term bridge; refi at stabilization.
Listing history 19 events
-
2026-05-08status Pending
-
2026-04-21$119,900 Active
-
2025-08-31historical
-
2024-06-28status Active
-
2024-05-22status Pending
-
2024-05-06price $210,000
-
2024-04-03$220,000 Active
-
2024-01-02historical
-
2023-09-01price $225,000
-
2023-08-03$230,000 Active
-
2022-06-14soldstatus $201,000
-
2022-05-31soldstatus $201,000 Closed
-
2022-04-03status Pending
-
2022-03-29$182,000 Active
-
2013-04-23soldstatus $47,000
-
2012-06-21historical
-
2012-01-30$69,900
-
2000-10-16soldstatus $51,500
-
1998-11-20soldstatus $21,500
ⓘ Source: listings_history table (triggers on properties + properties_extension) + one-shot
backfill from property_details.listing_events for pre-trigger history.
Tax reassessment forecast FL · Resets to sale price
- Current annual tax
- $3,517 · $293/mo
- Projected year-2 tax
- $3,517 · $293/mo
- Expected delta
- $0/yr ($0/mo · 0.0%)
ⓘ Screening estimate from a state-policy table — verify with the county assessor before closing.
Climate risk First Street
- Flood 1/10 Low FEMA zone X (unshaded) · 0% chance over 30 yrs
- Wildfire 6/10 Major
- Heat 8/10 Severe 7 d/yr ≥108°F today · 22 d/yr by 30 yrs out
- Wind 9/10 Extreme 99% chance of damaging wind over 30 yrs
- Air quality 4/10 Moderate 4 unhealthy d/yr today · 5 by 30 yrs out
Nearby sold comps map
Loading sold comps map…
Walkable amenities ~0.75 mi
Loading nearby amenities…
Taxation est. · year 1
- Rental income
- $24,074
- − Mortgage interest
- −$6,716
- − Property taxes
- −$3,517
- − Insurance
- −$600
- − Repairs & maintenance
- −$1,926
- − Management
- −$1,926
- − Depreciation
- −$3,488
- Taxable income
- $5,902
- Est. tax owed @ 24.0%
- −$1,416
- After-tax cash flow
- $5,941/yr
For passive investors: Depreciation is non-cash, so a rental often shows a tax loss while cash-flowing — sheltering income. Rental losses are passive: they offset passive income freely, and up to $25,000/yr can offset ordinary (W-2) income if you actively participate and your MAGI is under $100k (phasing out to $0 by $150k); unused losses carry forward. On sale, claimed depreciation is recaptured at up to 25%, and gains may owe capital-gains tax (a 1031 exchange can defer both). Figures are a year-1 estimate at your 24.0% rate — not tax advice; consult a CPA.
Schools (NCES district)
- District
- Alachua
- NCES district ID
- 1200030
- Math proficiency
- 49% ▼ -9.00%
- Reading proficiency
- 54% ▼ -3.00%
- Median HH income
- $42,683
- Composite
- 43.31/100
- National rank
- #3038
- State rank
- #30 of 73 in FL
Livability — Alachua
- Score
- 77/100
- State rank
- #188
- US rank
- #2996
Category grades
Schools grade is shown separately in the Schools card above.
Census & demographics
- Census place
- Alachua, FL
- City population
- 31,819
- Population (ZIP)
- 16,244
Population outlook (Alachua County) Hauer SSP2
- Today (2025)
- 289,834 people
- By 2030
- 305,873 · +5.5%
- By 2040
- 335,246 · +15.7%
- By 2050
- 364,719 · +25.8%
- By 2075
- 436,665 · +50.7%
- By 2100
- 482,920 · +66.6%
Race, ethnicity, and origin ACS 2023
- Neighborhood character
- Predominantly White (67%)
- Race & ethnicity
- White 67% Black 18% Hispanic / Latino 10% Two or more races 8% Asian 1%
- Hispanic origin (detail)
- Mexican 1% Puerto Rican 2% Cuban 3% Dominican 1%
- Common ancestry
- Italian 4% Slovak 4% Lithuanian 2%
- Foreign-born
- 7% · Canada, Jamaica, Guatemala
- Languages at home
- 90% English-only · Spanish 7% Other Indo-European 1% German/W. Germanic 1%
Political lean MEDSL · Alachua
- 2024 margin
- Strong D (+21.0) · D 59.7% · R 38.8% · Other 1.5%
- 2008→2024 swing
- -0.6pp no change · 2008: 21.6pp · 2024: 21.0pp
- All cycles
- 2024: D+21.0 2020: D+27.2 2016: D+22.5 2012: D+17.3 2008: D+21.6
Not yet ingested
- Civics
- —
Market trends
- HPI YoY
- ▼ -77.36%
- Current HPI
- 280.2476
- Rent YoY
- —
- Metro
- —
- State GDP YoY
- ▲ 3.28%
- F500 in state
- 36
Industry mix (Fortune 500 HQ in FL)
| Industry | F500 HQs | Revenue |
|---|---|---|
| Industrial Technology | 2 | $29B |
|
||
| Insurance | 2 | $17B |
|
||
| Retail | 1 | $60B |
|
||
| Technology Distribution | 1 | $58B |
|
||
| Homebuilding | 1 | $35B |
|
||
| Technology Manufacturing | 1 | $35B |
|
||
Price history
+457.7% since first listed19 events — show timeline
- 2026-05-08 Pending — Stellar MLS as Distributed by MLS Grid
- 2026-04-21 Listed $119,900 Stellar MLS as Distributed by MLS Grid
- 2025-08-31 Listing Removed — Stellar MLS as Distributed by MLS Grid
- 2024-06-28 Relisted — Stellar MLS as Distributed by MLS Grid
- 2024-05-22 Pending — Stellar MLS as Distributed by MLS Grid
- 2024-05-06 Price Changed $210,000 Stellar MLS as Distributed by MLS Grid
- 2024-04-03 Listed $220,000 Stellar MLS as Distributed by MLS Grid
- 2024-01-02 Listing Removed — Stellar MLS as Distributed by MLS Grid
- 2023-09-01 Price Changed $225,000 Stellar MLS as Distributed by MLS Grid
- 2023-08-03 Listed $230,000 Stellar MLS as Distributed by MLS Grid
- 2022-06-14 Sold (Public Records) $201,000 Public Records
- 2022-05-31 Sold (MLS) $201,000 Stellar MLS as Distributed by MLS Grid
- 2022-04-03 Pending — Stellar MLS as Distributed by MLS Grid
- 2022-03-29 Listed $182,000 Stellar MLS as Distributed by MLS Grid
- 2013-04-23 Sold (Public Records) $47,000 Public Records
- 2012-06-21 Listing Removed — Stellar MLS as Distributed by MLS Grid
- 2012-01-30 Listed $69,900 Stellar MLS as Distributed by MLS Grid
- 2000-10-16 Sold (Public Records) $51,500 Public Records
- 1998-11-20 Sold (Public Records) $21,500 Public Records
Property tax history
+14.7%/yrLatest (2025): $3,517 · +7.3% YoY. Source: county tax records.
Cash-flow waterfall
monthlySold comps — $/sqft
last 12 mo · ≤1 miLoading sold comps…